Abstract
Background
Currently, there are no optimal biomarkers available for distinguishing patients who will respond to immune checkpoint inhibitors (ICIs) therapies. Consequently, the exploration of novel biomarkers that can predict responsiveness to ICIs is crucial in the field of immunotherapy.
Methods
We estimated the proportions of 22 immune cell components in 10 cancer types (6,128 tumors) using the CIBERSORT algorithm, and further classified patients based on their tumor immune cell proportions in a pan-cancer setting using k-means clustering. Differentially expressed immune genes between the patient subgroups were identified, and potential predictive biomarkers for ICIs were explored. Finally, the predictive value of the identified biomarkers was verified in patients with urothelial carcinoma (UC) and esophageal squamous cell carcinoma (ESCC) who received ICIs.
Results
Our study identified two subgroups of patients with distinct immune infiltrating phenotypes and differing clinical outcomes. The patient subgroup with improved outcomes displayed tumors enriched with genes related to immune response regulation and pathway activation. Furthermore, CCL5 and CSF2 were identified as immune-related hub-genes and were found to be prognostic in a pan-cancer setting. Importantly, UC and ESCC patients with high expression of CCL5 and low expression of CSF2 responded better to ICIs.
Conclusion
We demonstrated CCL5 and CSF2 as potential novel biomarkers for predicting the response to ICIs in patients with UC and ESCC. The predictive value of these biomarkers in other cancer types warrants further evaluation in future studies.
Supplementary Information
The online version contains supplementary material available at 10.1186/s12935-024-03496-x.
Keywords: Biomarkers, Immune checkpoint inhibitors, CIBERSORT, Pan-cancer analysis, CCL5, CSF2
Introduction
Immunotherapies using immune checkpoint inhibitors (ICIs) have revolutionized cancer treatments over the past decade, demonstrating significant therapeutic benefits across various types of malignancies [1–3]. Immunotherapies of ICIs, which target the tumor-immune cell interaction, can significantly prolong the survival of a subset of patients with solid tumors, including melanoma, triple-negative breast cancer, and non-small-cell carcinoma, among others [4–7]. Factors that may influence the therapeutic efficacy of ICIs include the type of cancer, the treatment stage, and the use of different treatment combinations [8]. A widely adopted strategy to enhance the effectiveness of ICIs involves combining one ICI with other anticancer agents, such as chemotherapy and targeted therapies [9].
A major limitation of tumor immunotherapy is that only a fraction of cancer patients respond to the therapy [7, 10]. Consequently, the development of biomarkers to evaluate a patient’s responsiveness to ICIs is crucial for the successful application of immunotherapy. Several biomarkers have been proposed, including tumor mutational burden (TMB) and microsatellite instability (MSI) [11, 12], the overexpression of programmed death-ligand 1 (PD-L1) [13, 14], gut microbiota [15], and the composition of tumor-infiltrating immune cells [16, 17], among others. However, the predictive power of these biomarkers in distinguishing patients who would benefit from ICIs has been unsatisfactory. The application of TMB remains limited to clinical trials and has not yet been well validated [18]. Assessing PD-L1 in current practice presents several issues, such as the use of different cut-off thresholds and antibody clones [19], leading to inconsistent predictive values of PD-L1 expression for ICIs across different trials [20, 21]. Therefore, novel predictive biomarkers are warranted to better identify the most suitable candidates for ICIs.
Recent studies have suggested that the composition of immune cell types is associated with responses to immunotherapies [22–26]. Guven DC et al. evaluated the association between the neutrophil-to-lymphocyte ratio (NLR) and survival in ICI-treated patients [27]. Due to the technical limitations, these studies generally focus on only one or two immune cell types. However, evaluating just one or two types of immune cells may not always predict the response to immunotherapies [28]. The interactions between multiple immune cell types may be more closely associated with the efficacy of immunotherapies.
With the help of the bioinformatics tool CIBERSORT (Cell type Identification by Estimating Relative Subsets Of known RNA Transcripts), we can reconstruct the proportions of immune cell types from bulk transcriptome data and further investigate their impact on patient outcomes. It has been reported that the proportions of immune cell types derived from gene expression data can predict the responsiveness to immunotherapy and the prognosis of patients with breast cancer [24, 25, 29], colorectal cancer, and renal cell carcinoma patients [29, 30]. As a result, the model exhibits high prediction accuracy at the tumor type-specific level [24, 25, 29, 30]. However, a comprehensive analysis of immuno-subtyping and its predictive power for immunotherapy responsiveness in a pan-cancer setting remain unclear.
Therefore, we conducted a comprehensive pan-cancer analysis in an extensive dataset of 6,128 patients from 10 cancer types, using CIBERSORT to estimate the proportions of 22 tumor-infiltrating immune cells within each tumor. We further classified malignancies based on their immune cell components. After classification, differentially expressed immune-related biomarkers of immune subtypes were explored. Finally, the predictive value of the identified biomarkers for immunotherapy was evaluated in two cohorts of patients with urothelial carcinoma (UC) and esophageal squamous cell carcinoma (ESCC) who received ICIs.
Materials and methods
RNA data acquisition and clinicopathological data collection
RNA data and clinicopathological data for newly diagnosed primary tumors from patients with 10 cancer types and corresponding normal tissues were collected from The Cancer Genome Atlas (TCGA) via the GDC portal (https://portal.gdc.cancer.gov/). The 10 cancer types included triple-negative breast cancer (TNBC; TCGA term: BRCA), non-small cell lung cancer (NSCLC; TCGA term: LUAD, LUSC), head and neck squamous cell carcinoma (HNSC; TCGA term: HNSC), cervical squamous cell carcinoma and endocervical adenocarcinoma (CESC; TCGA term: CESC), stomach adenocarcinoma (STAD; TCGA term: STAD), renal cell carcinoma (RCC; TCGA term: KICH, KIRP, KIRC), bladder urothelial carcinoma (BLCA; TCGA term: BLCA), cutaneous skin melanoma (SKCM; TCGA term: SKCM), colon adenocarcinoma/rectum adenocarcinoma (COREAD; TCGA term: COAD, READ), and Liver hepatocellular carcinoma (LIHC; TCGA term: LIHC).
Estimation of the infiltrating immune cell fraction
We used CIBERSORT to estimate the fractions of 22 immune cell types in the 10 cancer types [31]. The sum of all estimated immune cell type fractions equaled 1. Specifically, we extracted the mRNA expression “FPKM” data from the total RNA data using Perl. Subsequently, we used “CIBERSORT R script v1.03” to estimate the immune cell proportions from the mRNA expression data. The CIBERSORT p-value reflects the proportion of immune cells versus non-immune cells within a sample [24]. A larger p-value indicate a greater proportion of non-immune cells within a sample [24].
Immune cytolytic activity test
Immune cytolytic activity is another in silico measure of immune infiltration, as described by Rooney et al. [32]. High cytolytic activity indicates a high concentration of immune cells in a sample [33]. The cytolytic immune activity of samples was determined by calculating the geometric mean of the expression quantities of GZMA (granzyme A) and PRF1 (perforin 1). To compare the cytolytic activity in samples with different p-values derived from CIBERSORT, all samples were divided into three groups based on the p-value: p < 0.01, p < 0.05 and p ≥ 0.05, after which the cytolytic activity of the samples in these three groups was calculated respectively.
Clustering analysis based on fractions of immune cells
To investigate whether tumors of different cancer types share the same distinct patterns of immune cell infiltration and whether these immune patterns are associated with patient prognosis, we conducted K-means clustering, Gaussian Mixture Model, and Hierarchical clustering of immune cell fractions of the pan-cancer dataset. The ratio of explained variance, reflecting the ratio of between-group variance to the total variation, was used to determine the optimal clustering method as well as the optimal number of clusters. The optimal number of distinct clusters maximally demonstrated intra-cluster similarity.
Functional and signal pathway enrichment analysis
Samples were divided into groups based on the clustering analysis. Then, the gene expression data of cluster 2 were compared with those of cluster 1&3. Differentially expressed genes (DEGs), defined as |log2FoldChange| ≥ 1 and p < 0.05, were identified using the limma package of R. Then, the related signaling pathways of the DEGs were obtained by gene ontology (GO) analyses and Kyoto encyclopedia of genes and genomes (KEGG) analyses using the clusterProfiler package of R. In addition, gene set enrichment analysis (GSEA) was applied based on the expression data of all genes to identify the key signaling pathways involved in different patient subgroups derived from the clustering analysis.
Identification of immune-related differentially expressed hub genes
Immune-related genes was downloaded from the Innate DB dataset (https://www.innatedb.ca/). By intersecting all immune-related genes with the DEGs, the immune-related DEGs were screened, meaning that these genes are not only significantly different in their expression levels, but also related to immunity. The protein-protein interaction (PPI) network was constructed using STRING v11.5 (https://www.string-db.org/). The PPI network was then subjected to Cytoscape v3.8.2 and cytoHubba plugin, where the degree of nodes was calculated as the direct number of edges linking to the node gene. The top 10 genes, determined by degree, were defined as hub genes.
Identification of potential predictive biomarkers for immunotherapy
The prognostic value of the immune-related differentially expressed genes was assessed by the COX regression analysis. The median expression level of the genes was used as cutoff to define high and low expression levels. The genes that were significantly associated with patient outcomes and were identified as hub genes in the above-mentioned PPI analysis were considered as potential predictive biomarkers for immunotherapy.
Verification of the predictive value of identified biomarkers in UC and ESCC
RNA-seq data and clinicopathological data (IMvigor210) from 348 patients with metastatic UC receiving immunotherapy (anti-PD-L1), were extracted using the R package IMvigor210CoreBiology (http://researchpub.gene.com/IMvigor210CoreBiology). The patients were divided into CCL5 or CSF2 high-expression groups and CCL5 or CSF2 low-expression groups according to the optimal cutoff values generated from the X-tile software [34]. Kaplan-Meier curves were drawn using the R package Survminer.
Esophageal cancer tissue slides and clinicopathological information from 36 patients with ESCC who received neoadjuvant immunotherapy (anti-PD-1) were obtained from Shantou Central Hospital. Ethical approval was obtained from the Ethical Committee of the Shantou Central Hospital. The expression of biomarkers (CCL5 and CSF2) in tumor tissue was assessed by immunohistochemistry (IHC), which was performed as previously described [35]. Briefly, the slides were incubated with the primary antibodies (anti-CCL5: E9S2K, Cell Signaling Technology, 1:150; anti-CSF2: 17762-1-AP, Proteintech, 1:200). The PV-9001 two-step Polymer Detection System (ZSGB-BIO) was performed according to the manufacturer’s instructions. The staining score: 0, no staining; 1+, weak staining; 2+, strong staining. Subsequently, H-scores were calculated by combining the staining intensity and percentage, using the following formula: (1 × percentage of cells with weak staining) + (2 × percentage of cells with strong staining). The H-score of each biomarker was used to define its high and low expression.
Statistical analysis
The categorical variables were described by percentages, and continuous variables by the median and interquartile range (IQR). The prognostic value of immune cell components was determined using univariable and multivariable Cox regression analysis. Survival analysis was conducted using the Kaplan-Meier method, with a log-rank test assessing differences. The p-values below 0.05 for two-sided tests were considered statistically significant. Statistical analysis was performed using the Statistical Package for the Social Sciences (SPSS) version 18.0 (SPSS. Inc.) and R version 3.6.3.
Results
CIBERSORT analysis revealed the cytolytic activity of tumor-infiltrating immune cells in a pan-cancer setting
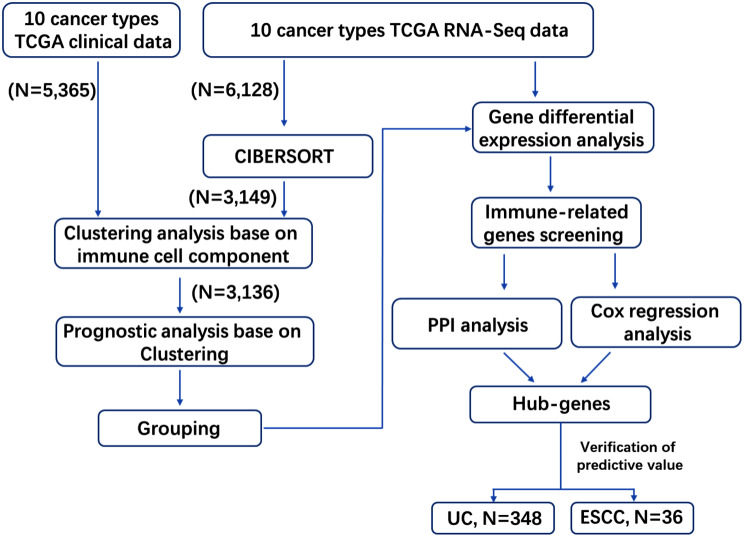
RNA sequencing data from 6,128 tumors and 5,365 corresponding clinicopathological data from 10 cancer types were obtained from the TCGA (Fig. 1 and S1, Table S1). The cytolytic immune activity of the samples was determined by the expression levels of GZMA (granzyme A) and PRF1 (perforin 1). The CIBERSORT p-value reflects the cytolytic activity of the tumor-infiltrating immune cell in the samples (Fig. S2 A). The cytolytic activity was significantly higher in samples with a CIBERSORT p-value < 0.01 or p < 0.05 compared to those with a p-value ≥ 0.05, while no significant difference was observed between samples with p-values < 0.01 and < 0.05 (Fig. S2 B). These results indicate that the cytolytic activity of tumor-infiltrating immune cells in samples with p-values < 0.05 was significantly higher than that in samples with p-value ≥ 0.05. TNBC and LIHC had the highest and lowest proportions of samples with p-values < 0.05 (90.7% and 16.5%, respectively). Overall, 58.7% of the samples had a p-value < 0.05 (Fig. S2A). CIBERSORT analysis reveals that nearly 60% of cancers exhibit high cytotoxicity from tumor-infiltrating immune cells, indicating the abundance of cytotoxic immune cells in the tumor microenvironment. Unless otherwise specified, further analyses were restricted to samples with a CIBERSORT p-value < 0.05 in the pan-cancer setting, including patients from 10 types of cancers.
Fig. 1.
Flow diagram of the study. The 10 cancer types downloaded from TCGA for analysis, included triple-negative breast cancer (TNBC), non-small cell lung cancer (NSCLC), head and neck squamous cell carcinoma (HNSC), cervical squamous cell carcinoma and endocervical adenocarcinoma (CESC), stomach adenocarcinoma (STAD), renal cell carcinoma (RCC), bladder urothelial carcinoma (BLCA), cutaneous skin melanoma (SKCM), colon/rectum adenocarcinoma (COREAD), and Liver hepatocellular carcinoma (LIHC). The cancer types used for verification of the predictive value of hub-genes were urothelial carcinoma (UC) and esophageal squamous cell carcinomas (ESCC)
Immune cell components as independent prognostic factors in the pan-cancer setting
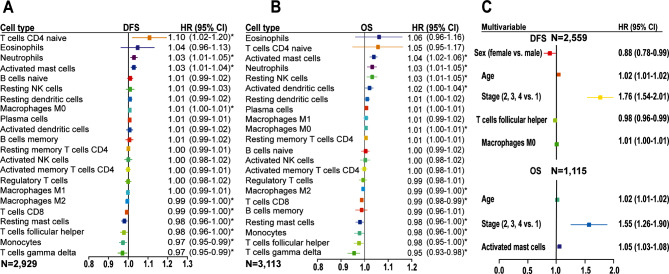
Figure 2 shows the prognostic association of immune cell components in the pan-cancer patients. A higher proportion of macrophages M0, T cells CD4 naive, neutrophils, and activated mast cells was associated with worse disease-free survival (DFS), with macrophages M0 remaining significant in the multivariable analysis (Fig. 2A and C). A high proportion of macrophages M2, T cells CD8, resting mast cells, T cells follicular helper, monocytes, and T cells gamma delta was found to be associated with prolonged DFS, and with T cells follicular helper confirmed as an independent prognostic predictor by multivariable analysis (Fig. 2A and C). For overall survival (OS) analysis, we observed the association of a high proportion of activated mast cells, neutrophils, resting NK cells, activated dendritic cells, and macrophages M0 with worse OS, and with activated mast cells remaining significant after adjusting for other features in the multivariable analysis (Fig. 2B and C). Conversely, a high proportion of macrophages M2, T cells CD8, resting mast cells, monocytes, T cells follicular helper, and T cells gamma delta was association with prolonged OS (Fig. 2B). The prognostic value of the immune cell subsets in individual cancer types is shown in Fig. S3. Additionally, a higher tumor stage and older age at diagnosis were independent prognostic factors for worse DFS and OS (Fig. 2C and Table S2). Taken together, tumor-infiltrating immune cells demonstrate different prognostic values in the pan-cancer setting, highlighting the importance of considering the entire immune landscape when assessing their influence on patient survival or treatment response.
Fig. 2.
Prognostic association of immune cell subsets in the pan-cancer setting. (A&B) Unadjusted HRs and 95% CI limited to patients with CIBERSORT p-value < 0.05. (C) HRs and 95% CI adjusted for clinicopathological features. CI, confidence interval; DFS, disease-free survival; HR, hazard ratio; OS, overall survival; *, p < 0.05
Immune clusters were associated with patient outcomes in the pan-cancer setting
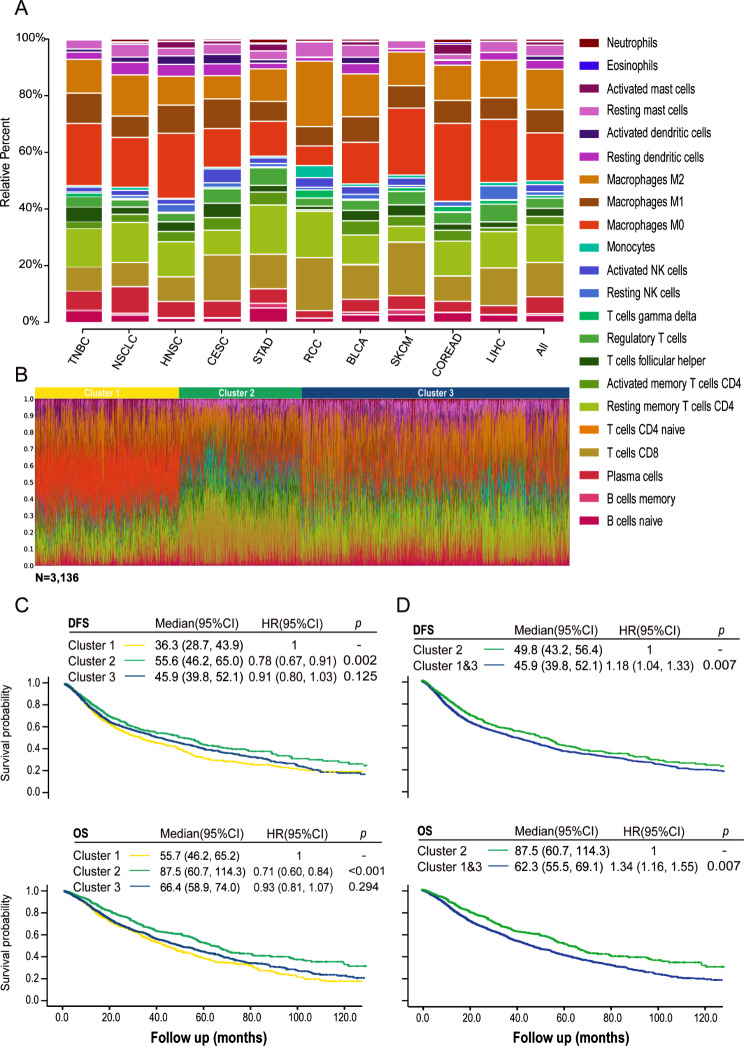
The proportions of immune cells varied among different cancer types (Fig. 3A, Fig. S4). In the pan-cancer sample set, the proportions of immune cells differed between tumor and normal tissues. The proportions of T cells CD8, gamma delta T cells, NK cells, macrophages M2, resting dendritic cells, mast cells, eosinophils, and neutrophils were significantly higher in cancer tissues than in normal tissues (Fig. S5). Conversely, B cells naive, T cells follicular helper, macrophages M0, and M1 were significantly lower in cancer tissues. At the individual patient level within each cancer type, diversity in the proportions of immune cell components was also observed (Fig. S6). To identify the optimal method for patient classification based on the 22 immune cell proportions in the pan-cancer setting, we selected k-means clustering as the optimal method (Fig. S7A). Three clusters were identified through k-means clustering, enabling the optimal classification of intra-cluster similarity in the pattern of immune infiltration (Fig. S7B).
Fig. 3.
K-means clustering of the pan-cancer samples based on immune cell proportions and survival analysis based on patient clustering. (A) Bar charts of immune cell proportions in the individual cancer types and the pan-cancer sample set. (B) Three clusters were identified based on immune cell proportions within the tumor using k-means clustering. (C&D) Kaplan-Meier analysis of DFS and OS classified by patient clustering in the pan-cancer setting. Cancer types used for analysis included triple-negative breast cancer (TNBC), non-small cell lung cancer (NSCLC), head and neck squamous cell carcinoma (HNSC), cervical squamous cell carcinoma and endocervical adenocarcinoma (CESC), stomach adenocarcinoma (STAD), renal cell carcinoma (RCC), bladder urothelial carcinoma (BLCA), cutaneous skin melanoma (SKCM), colon/rectum adenocarcinoma (COREAD), and Liver hepatocellular carcinoma (LIHC). DFS, disease-free survival; HR, hazard ratio; OS, overall survival
The proportions of different immune cells in each cluster are depicted in Fig. 3B. Figure S8 shows the distribution of pan-cancer cases by clustering, and individual patients with each cancer type. The number of patients with each cancer type by clustering is detailed in Table S3. Clusters 1 and 3 were characterized by a high level of macrophages and a low level of T cells CD8, whereas cluster 2 was enriched for T cells CD8 but lacked macrophages infiltration (Fig. 3B, Fig. S9). More importantly, patients in cluster 2 demonstrated prolonged DFS and OS compared with those in clusters 1 and 3 (Fig. 3C). No significant difference in DFS and OS was observed between patients in the two clusters (1 and 3). Based on these data, we combined clusters 1 and 3, dividing the patients into two groups with different immune profiles and patient prognosis, namely cluster 2 and the combined cluster 1&3 (Fig. 3D). In conclusion, tumor-infiltrating immune clustering is associated with patient prognosis in a pan-cancer setting.
Immune-related pathways were enriched in the tumors of patients with superior prognosis in the pan-cancer setting
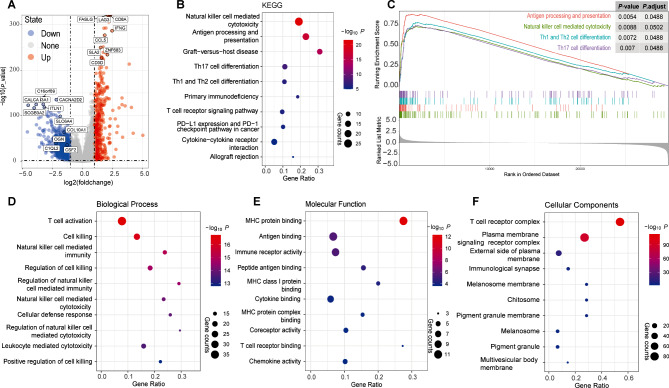
When comparing the gene expression data of cluster 2 with cluster 1&3, a total of 1,536 DEGs were obtained, with 422 up-regulated and 1114 down-regulated (Fig. 4A). Functional and signal pathway enrichment analysis showed that 742 GO terms and 100 KEGG pathways were significantly enriched (p < 0.05) (Supplemental Table S4). The down-regulated genes were significantly enriched in metabolism-related pathways (Supplemental Table S4). As shown in Fig. 4B and D-F, for the up-regulated genes, most of the top 10 GO terms and 10 KEGG pathways were immune-related, such as “T cell activation” in biological process terms, “MHC protein binding” in molecular function terms, “T cell receptor complex” in cellular components terms, and “Antigen processing and presentation” in KEGG pathways.
Fig. 4.
Differentially expressed genes and their associated enriched signal pathways in the pan-cancer analysis. (A) Volcano plot of differentially expressed genes (DEGs) (|log2FoldChange| ≥ 1, p-value < 0.05). (B–F) Enriched signal pathways of differentially expressed genes in KEGG (B), GSEA (C) and GO (D–F) analysis
GSEA was performed to validate the results of the GO and KEGG analyses. The whole gene set of samples was enriched in 114 pathways (p < 0.05) (Supplemental Table S5). The top 10 immune-related KEGG pathways were all significantly enriched in the GSEA (Fig. 4B and Supplemental Table S5), with some of these pathways being showed in Fig. 4C. The results of GO/KEGG and GSEA analyses indicate that the patient subgroup with improved prognosis has tumors significantly enriched in genes related to immune response regulation and pathway activation.
CCL5 and CSF2 were identified as immune-related hub genes
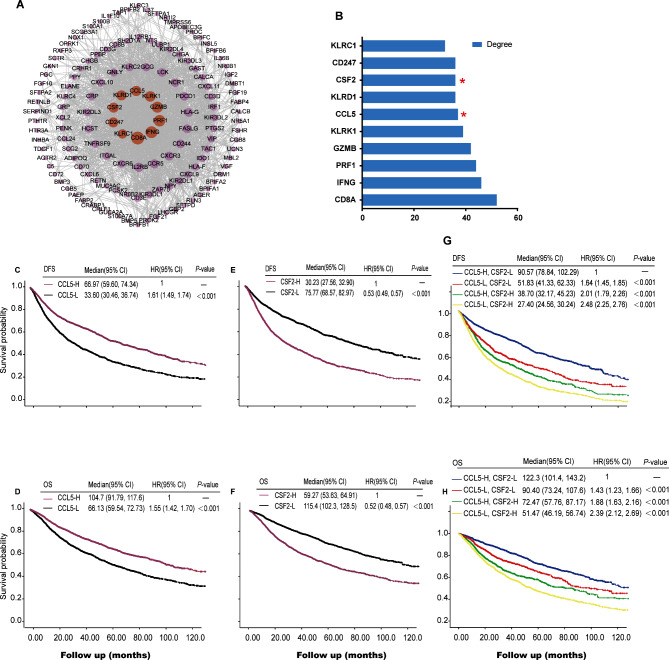
Based on the results from the GO, KEGG and GSEA analyses, we focused on identifying immune-related hub genes as potential predictive biomarkers for immunotherapy. A total of 240 genes were obtained by intersecting the DEGs with the immune-related gene list downloaded from the Innate DB dataset (https://www.innatedb.ca/), which contained 135 up-regulated genes and 105 down-regulated genes (Table S6). PPI network of the 240 immune-related DEGs is showed in Fig. 5A, and the 10 hub genes is showed in Fig. 5B. These hub genes are CD8A (CD8 Subunit Alpha), IFNG (Interferon, Gamma), PRF1 (Perforin 1), GZMB (Granzyme B), KLRK1 (Killer Cell Lectin Like Receptor K1), CCL5 (C-C chemokine ligand 5), KLRD1 (Killer Cell Lectin Like Receptor D1), CSF2 (Colony stimulating factor 2), CD247 and KLRC1 (Killer Cell Lectin Like Receptor C1).
Fig. 5.
Protein-protein interaction analysis and survival analysis of hub-genes in the pan-cancer setting. (A) Protein-protein interaction (PPI) analysis result. Each single point represents an individual protein, lines indicate the interaction between proteins. (B) Bar plots of degree of the top 10 genes. (C–F) DFS or OS curve base on expression of CCL5 or CSF2. (G&H) DFS or OS curve base on expression of CCL5 and CSF2. DFS, disease-free survival; OS, overall survival; Red star, candidate biomarkers
Univariate Cox regression analysis of the 240 immune-related DEGs demonstrated that 70 DEGs were correlated with DFS and 73 DEGs with OS (Table S7). CCL5 and CSF2 were selected as potential predictive biomarkers for immunotherapy, as they were both prognostic and identified as immune-related hub genes (Fig. 5B-H). As shown in Table S9, we analyzed the relationship between CCL5/CSF2 expression and clinical staging in pan-cancer patients. The expression of CCL5 in stage IV is higher than that in stages I-III. However, the expression of CSF2 was not correlated with clinical staging.
CCL5 and CSF2 were predictive for immune checkpoint inhibitors in UC and ESCC
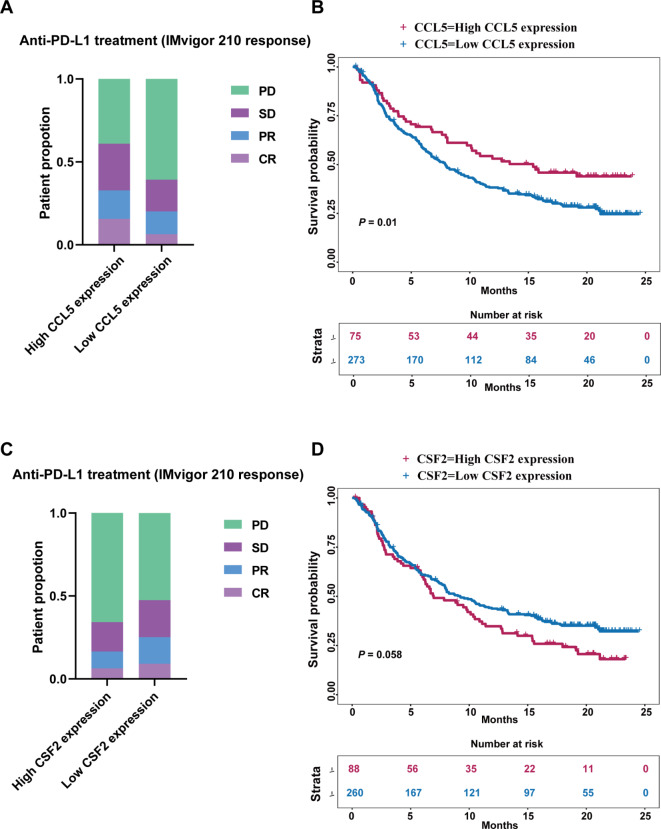
Patients in the IMvigor 210 cohort were divided into high and low expression groups using optimal expression cutoff values of the biomarkers, with 3.01 for CCL5 and 0.52 for CSF2 in their mRNA expression, respectively. A total of 75 patients had CCL5 high expression tumors and 273 patients had CCL5 low expression tumors. There were 88 patients with tumors exhibiting high CSF2 expression and 260 patients with tumors exhibiting low CSF2 expression. A lower proportion of patients with progressive disease was observed in the CCL5 high-expression group compared to the CCL5 low-expression group (Fig. 6A). Conversely, a higher proportion of patients with progressive disease was observed in the CSF2 high-expression group compared to those in the CSF2 low-expression group (Fig. 6C). Furthermore, the expression of CCL5 and CSF2 was prognostic in this patient cohort. Patients with CCL5 high-expression tumors had prolonged OS compared to those with CCL5 low-expression tumors (Fig. 6B). However, patients with CSF2 high-expression tumors had shortened OS compared to those with CSF2 low-expression tumors (Fig. 6D). These results indicate that the tumor expression of CCL5 and CSF2 is associated with the response to immunotherapy and patient survival in UC patients.
Fig. 6.
The predictive and prognostic value of CCL5 and CSF2 in urothelial carcinoma. (A&C) The therapeutic response to anti-PD-L1 treatment base on expression of CCL5 or CSF2. (B&D) OS curve base on expression of CCL5 or CSF2. CR, complete response; DFS, disease-free survival; OS, overall survival, PD, progression disease; PR, partial response; SD, stable disease
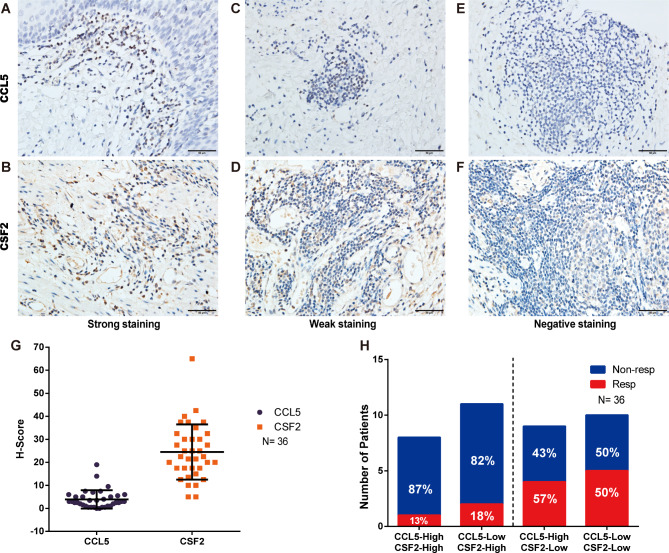
The clinicopathological characteristics of the 36 patients with ESCC are shown in Table S8. All patients received neoadjuvant ICIs in combination with chemotherapy. A total of 12 patients were classified as responders and 24 patients as non-responders (Table S8). Representative images of negative, weak, or strong staining of CCL5 and CSF2 are shown in Fig. 7A-F. The median H-scores were 3.0 (IQR, 1.0-5.1) and 22.5 (IQR, 17.5–30.6) for CCL5 and CSF2, respectively (Fig. 7G). Tumors with low expression of CSF2 and high expression of CCL5 demonstrated the highest response rate (57%) to ICIs. This was slightly higher than those with low expression of both CSF2 and CCL5 (50%). However, for tumors with high expression of CSF2, the response rates were low regardless of the CCL5 expression status (Fig. 7H). Thus, our results indicate that CCL5 and CSF2 are potentially novel predictive biomarkers for ICIs in patients with ESCC.
Fig. 7.
Immunohistochemical staining of CCL5 and CSF2 in esophageal squamous cell carcinoma and their predictive value for immune checkpoint inhibitors. (A–F) Examples of negative, weak, and strong staining of CCL5 and CSF2. (G) H-Score of CCL5 and CSF2. (H) Distribution of responders and non-responders in the subgroups classified by the expression of CCL5 and CSF2. Resp, responder; Non-resp, non-responder
Discussion
From this pan-cancer analysis of 10 solid tumors types that are indicated for immunotherapy, we have identified CCL5 and CSF2 as potential novel biomarkers for predicting response to immunotherapy. This finding is particularly significant given the recent developments in immune-modulating therapies.
Firstly, we observed striking differences in the relative composition of immune cells across various cancer types. We also noted variations in immune cell components within individual tumors of the same cancer type. These findings highlight the heterogeneity and complexity of the tumor immune microenvironment both between different cancer types and among individual tumors of the same type. Notably, tumors from different cancer types can share similar immune characteristics. Importantly, as demonstrated in this study, distinct immune subsets were associated with varying patient outcomes in the pan-cancer setting. The variation in patient outcomes is due to the differing biological roles these immune subsets play within the tumor microenvironment [36–41]. The interactions among different immune subsets may be even more critical than simply assessing their presence. Thus, a more comprehensive understanding of the heterogeneity and similarities of immune subsets across a pan-cancer setting is crucial for classifying patients into subgroups with different response to ICIs, despite having different tissue origins.
Based on the proportions of 22 immune cell components within tumors, we classified pan-cancer patients into two subgroups with distinct outcomes. Interestingly, the subgroup with superior prognosis had tumors enriched with T cells CD8 and is lacked infiltration by tumor-associated macrophages. Similarly, Thorsson et al. also found that patients with the lowest macrophage levels and highest lymphocyte infiltration had a superior prognosis [42]. Furthermore, differential gene expression analysis revealed that genes related to the immune activation pathways were up-regulated in these tumors. These results indicate that patients in this subgroup may be more responsive to ICIs. Conversely, tumors in the subgroup with worse prognosis were characterized by a high level of macrophages and low level of T cells CD8 infiltration. Genes related to immune activation pathways were down-regulated, while those related to the metabolism pathways were up-regulated in these tumors. Consequently, patients in this subgroup may be resistant to ICIs.
To facilitate the clinical application, we further explored biomarkers that can be easily evaluated by IHC and may predict responses to ICIs. We found that the immune-related hub genes CCL5 was up-regulated and CSF2 was down-regulated in the subgroup of patients with a good prognosis. Finally, these two genes were identified and validated as potential predictive biomarkers for ICIs, using data from patients with UC and ESCC who were treated with ICIs. This is the first study to demonstrate the predictive value of CCL5 and CSF2 for ICIs. Mechanistically, CCL5 regulates the deubiquitination and stability of PD-L1, inhibiting CD8 + T cell responses and leading to immune escape [43]. CSF2, also known as granulocyte-macrophage colony stimulating factor (GM-CSF), has been shown to inhibit the functions of CD8 + T cells by recruiting the myeloid-derived suppressor cells (MDSCs) in the tumor microenvironment [44]. Additionally, CSF2 mediates immune escape by upregulating PD-L1 expression [45]. Our findings could be important for clinical practice. The tumor expression of CCL5/CSF2 can be easily obtained in the pre-treatment setting and most metastatic setting. Therefore, the treatment response to ICIs in individual patients could be potentially determined. This would be crucial for optimizing treatment strategies.
As a validation dataset, we selected IMvigor 210 urothelium cancer cohort and our hospital’s ESCC cohort to evaluate the predictive value of biomarkers in population benefiting from ICIs. Our study has some limitations. First, the sample size for assessing the predictive value of CCL5 and CSF2 is small. Therefore, our results are preliminary and need to be validated in future studies with a larger sample size, as well as in other cancer types. Second, post-treatment samples were used for immunohistochemical staining of CCL5 and CSF2 in the present study. The expression of these two biomarkers may change after treatment. The pre-treatment samples will be used in future study to validate their predictive value for ICIs.
Conclusions
In conclusion, we have demonstrated CCL5 and CSF2 as potential novel biomarkers for predicting the response to ICIs in patients with UC and ESCC. Their predictive value for ICIs in other cancer types warrants evaluation in future studies.
Electronic supplementary material
Below is the link to the electronic supplementary material.
Acknowledgements
We would like to thank Dr. Wei-Nan Liao for the kind assistance in collecting the ESCC patients’ data. This work was supported by Natural Science Foundation Committee, China, grant numbers 82372032 and 81901801 to SQ, 82003221 to TZ, 82173011 to FP; Natural Science Foundation of Guangdong Province, China, grant numbers 2021A1515011180 to SQ, 2019A1515010239 to HL; Science and Technology Innovation Strategy Special Project of Guangdong Province City and County Science and Technology Innovation Support, grant numbers STKJ2023006 to SQ; Department of Education of Guangdong Province, China, grant numbers 2019KQNCX032 to TZ; Science and technology projects of Shantou, China, grant numbers 200601155261081 to TZ; Shantou Central Hospital Research Incubation Program, China, grant numbers 201905 to SQ; Cancer Hospital of Shantou University Medical College, China, grant numbers 2020A001 to TZ. The funding bodies did not participate in the design of the study; the collection, analysis, or interpretation of the data; the writing of the manuscript; or the decision to manuscript submission.
Abbreviations
- BLCA
Bladder urothelial carcinoma
- CESC
Cervical squamous cell carcinoma and endocervical adenocarcinoma
- COREAD
Colon/rectum adenocarcinoma
- CI
Confidence interval
- CSF2
Colony stimulating factor 2
- CCL5
Chemotactic cytokine ligand 5
- DFS
Disease-free survival
- HR
Hazard ratio
- HNSC
Head and neck squamous cell carcinoma
- IHC
Immunohistochemistry
- LIHC
Liver hepatocellular carcinoma
- NSCLC
Non-small cell lung cancer
- N
Number of cases
- Non-resp
Non-responder
- OS
Overall survival
- RCC
Renal cell carcinoma
- Resp
Responder
- STAD
Stomach adenocarcinoma
- SKCM
Cutaneous skin melanoma
- TNBC
Triple-negative breast cancer
Author contributions
YC, WZ and CL designed the study, performed the data acquisition, analyzed and interpreted the data, and drafted the manuscript. CL performed the immunohistochemical test. YZ, JL and SC interpreted the immunohistochemical results. TZ and ZD analyzed and interpreted the data, and critically reviewed the manuscript. HL and WS interpreted the data and critically reviewed the manuscript. FP and SQ designed and supervised the study, interpreted the data, and drafted the manuscript. All authors reviewed the final manuscript.
Data availability
No datasets were generated or analysed during the current study.
Declarations
Ethics approval and consent to participate
The study was conducted in accordance with the Declaration of Helsinki for participant’s well-being and safety. This study was approved by the Ethical committee of the Shantou Central Hospital (scientific research: 2021-086). The study was explained to all participants and written informed consent was obtained from each participant prior to their enrolment on the project.
Consent for publication
Not applicable.
Competing interests
The authors declare no competing interests.
Footnotes
Publisher’s note
Springer Nature remains neutral with regard to jurisdictional claims in published maps and institutional affiliations.
Yi-Chao Chen, Wei-Zhong Zheng and Chun-Peng Liu contributed equally to this work.
Contributor Information
Feng Pan, Email: panfengbio@126.com.
Si-Qi Qiu, Email: s_patrick@163.com.
References
- 1.Hodi FS, O’Day SJ, McDermott DF, Weber RW, Sosman JA, Haanen JB, et al. Improved survival with ipilimumab in patients with metastatic melanoma. N Engl J Med. 2010;363(8):711–23. 10.1056/NEJMoa1003466 [DOI] [PMC free article] [PubMed] [Google Scholar]
- 2.Forde PM, Chaft JE, Smith KN, Anagnostou V, Cottrell TR, Hellmann MD, et al. Neoadjuvant PD-1 blockade in Resectable Lung Cancer. N Engl J Med. 2018;378(21):1976–86. 10.1056/NEJMoa1716078 [DOI] [PMC free article] [PubMed] [Google Scholar]
- 3.June CH, O’Connor RS, Kawalekar OU, Ghassemi S, Milone MC. CAR T cell immunotherapy for human cancer. Science. 2018;359(6382):1361–5. 10.1126/science.aar6711 [DOI] [PubMed] [Google Scholar]
- 4.Ribas A, Hamid O, Daud A, Hodi FS, Wolchok JD, Kefford R, et al. Association of Pembrolizumab with Tumor Response and Survival among patients with Advanced Melanoma. JAMA. 2016;315(15):1600–9. 10.1001/jama.2016.4059 [DOI] [PubMed] [Google Scholar]
- 5.Nanda R, Chow LQ, Dees EC, Berger R, Gupta S, Geva R, et al. Pembrolizumab in patients with advanced triple-negative breast cancer: phase ib KEYNOTE-012 study. J Clin Oncol. 2016;34(21):2460–7. 10.1200/JCO.2015.64.8931 [DOI] [PMC free article] [PubMed] [Google Scholar]
- 6.McDermott DF, Sosman JA, Sznol M, Massard C, Gordon MS, Hamid O, et al. Atezolizumab, an anti-programmed death-ligand 1 antibody, in metastatic renal cell carcinoma: long-term safety, clinical activity, and Immune correlates from a phase Ia study. J Clin Oncol. 2016;34(8):833–42. 10.1200/JCO.2015.63.7421 [DOI] [PubMed] [Google Scholar]
- 7.Garon EB, Rizvi NA, Hui R, Leighl N, Balmanoukian AS, Eder JP, et al. Pembrolizumab for the treatment of non–small-cell Lung Cancer. N Engl J Med. 2015;372(21):2018–28. 10.1056/NEJMoa1501824 [DOI] [PubMed] [Google Scholar]
- 8.Rizzo A, Cusmai A, Gadaleta-Caldarola G, Palmiotti G. Which role for predictors of response to immune checkpoint inhibitors in hepatocellular carcinoma? Expert Rev Gastroenterol Hepatol. 2022;16(4):333–9. 10.1080/17474124.2022.2064273 [DOI] [PubMed] [Google Scholar]
- 9.Rizzo A, Ricci AD, Lanotte L, Lombardi L, Di Federico A, Brandi G, et al. Immune-based combinations for metastatic triple negative breast cancer in clinical trials: current knowledge and therapeutic prospects. Expert Opin Investig Drugs. 2022;31(6):557–65. 10.1080/13543784.2022.2009456 [DOI] [PubMed] [Google Scholar]
- 10.Robert C, Long GV, Brady B, Dutriaux C, Maio M, Mortier L, et al. Nivolumab in previously untreated melanoma without BRAF mutation. N Engl J Med. 2015;372(4):320–30. 10.1056/NEJMoa1412082 [DOI] [PubMed] [Google Scholar]
- 11.Cristescu R, Mogg R, Ayers M, Albright A, Murphy E, Yearley J, et al. Pan-tumor genomic biomarkers for PD-1 checkpoint blockade-based immunotherapy. Volume 362. New York, NY: Science; 2018. 6411. [DOI] [PMC free article] [PubMed] [Google Scholar]
- 12.Samstein RM, Lee C-H, Shoushtari AN, Hellmann MD, Shen R, Janjigian YY, et al. Tumor mutational load predicts survival after immunotherapy across multiple cancer types. Nat Genet. 2019;51(2):202–6. 10.1038/s41588-018-0312-8 [DOI] [PMC free article] [PubMed] [Google Scholar]
- 13.Gandhi L, Rodriguez-Abreu D, Gadgeel S, Esteban E, Felip E, De Angelis F, et al. Pembrolizumab plus chemotherapy in metastatic non-small-cell lung cancer. N Engl J Med. 2018;378(22):2078–92. 10.1056/NEJMoa1801005 [DOI] [PubMed] [Google Scholar]
- 14.Rouquette I, Taranchon-Clermont E, Gilhodes J, Bluthgen MV, Perallon R, Chalabreysse L, et al. Immune biomarkers in thymic epithelial tumors: expression patterns, prognostic value and comparison of diagnostic tests for PD-L1. Biomark Res. 2019;7:28. 10.1186/s40364-019-0177-8 [DOI] [PMC free article] [PubMed] [Google Scholar]
- 15.Divella R, G DEP, Tufaro A, Pelagio G, Gadaleta-Caldarola G, Bringiotti R, et al. Diet, Probiotics and physical activity: the right allies for a healthy microbiota. Anticancer Res. 2021;41(6):2759–72. 10.21873/anticanres.15057 [DOI] [PubMed] [Google Scholar]
- 16.Chen DS, Mellman I. Elements of cancer immunity and the cancer-immune set point. Nature. 2017;541(7637):321–30. 10.1038/nature21349 [DOI] [PubMed] [Google Scholar]
- 17.Llosa NJ, Cruise M, Tam A, Wicks EC, Hechenbleikner EM, Taube JM, et al. The vigorous immune microenvironment of microsatellite instable colon cancer is balanced by multiple counter-inhibitory checkpoints. Cancer Discov. 2015;5(1):43–51. 10.1158/2159-8290.CD-14-0863 [DOI] [PMC free article] [PubMed] [Google Scholar]
- 18.Pardoll DM. The blockade of immune checkpoints in cancer immunotherapy. Nat Rev Cancer. 2012;12(4):252–64. 10.1038/nrc3239 [DOI] [PMC free article] [PubMed] [Google Scholar]
- 19.Naso JR, Banyi N, Al-Hashami Z, Zhu J, Wang G, Ionescu DN, et al. Discordance in PD-L1 scores on repeat testing of non-small cell lung carcinomas. Cancer Treat Res Commun. 2021;27:100353. 10.1016/j.ctarc.2021.100353 [DOI] [PubMed] [Google Scholar]
- 20.Yau T, Park JW, Finn RS, Cheng AL, Mathurin P, Edeline J et al. LBA38_PRCheckMate 459: a randomized, multi-center phase III study of nivolumab (NIVO) vs sorafenib (SOR) as first-line (1L) treatment in patients (pts) with advanced hepatocellular carcinoma (aHCC). 2019, 30:v874–5.
- 21.El-Khoueiry AB, Sangro B, Yau T, Crocenzi TS, Kudo M, Hsu C, et al. Nivolumab in patients with advanced hepatocellular carcinoma (CheckMate 040): an open-label, non-comparative, phase 1/2 dose escalation and expansion trial. Lancet. 2017;389(10088):2492–502. 10.1016/S0140-6736(17)31046-2 [DOI] [PMC free article] [PubMed] [Google Scholar]
- 22.Hollern DP, Xu N, Thennavan A, Glodowski C, Garcia-Recio S, Mott KR, et al. B cells and T follicular helper cells mediate response to checkpoint inhibitors in high mutation burden mouse models of breast cancer. Cell. 2019;179(5):1191–e12061121. 10.1016/j.cell.2019.10.028 [DOI] [PMC free article] [PubMed] [Google Scholar]
- 23.Helmink BA, Reddy SM, Gao J, Zhang S, Basar R, Thakur R, et al. B cells and tertiary lymphoid structures promote immunotherapy response. Nature. 2020;577(7791):549–55. 10.1038/s41586-019-1922-8 [DOI] [PMC free article] [PubMed] [Google Scholar]
- 24.Ali HR, Chlon L, Pharoah PD, Markowetz F, Caldas C. Patterns of immune infiltration in breast cancer and their clinical implications: a gene-expression-based retrospective study. PLoS Med. 2016;13(12):e1002194. 10.1371/journal.pmed.1002194 [DOI] [PMC free article] [PubMed] [Google Scholar]
- 25.Bense RD, Sotiriou C, Piccart-Gebhart MJ, Haanen J, van Vugt M, de Vries EGE et al. Relevance of tumor-infiltrating immune cell composition and functionality for disease outcome in breast cancer. In: J Natl Cancer Inst 109, 2016/10/16 edn; 2017. [DOI] [PMC free article] [PubMed]
- 26.Wagner J, Rapsomaniki MA, Chevrier S, Anzeneder T, Langwieder C, Dykgers A, et al. A single-cell atlas of the tumor and immune ecosystem of human breast cancer. Cell. 2019;177(5):1330–e13451318. 10.1016/j.cell.2019.03.005 [DOI] [PMC free article] [PubMed] [Google Scholar]
- 27.Guven DC, Sahin TK, Erul E, Cakir IY, Ucgul E, Yildirim HC et al. The Association between early changes in neutrophil-lymphocyte ratio and survival in patients treated with immunotherapy. J Clin Med 2022, 11(15). [DOI] [PMC free article] [PubMed]
- 28.Roma-Rodrigues C, Mendes R, Baptista P, Fernandes A. Targeting tumor microenvironment for cancer therapy. Int J Mol Sci. 2019;20(4):840. 10.3390/ijms20040840 [DOI] [PMC free article] [PubMed] [Google Scholar]
- 29.Xiong Y, Wang K, Zhou H, Peng L, You W, Fu Z. Profiles of immune infiltration in colorectal cancer and their clinical significant: a gene expression-based study. Cancer Med. 2018;7(9):4496–508. 10.1002/cam4.1745 [DOI] [PMC free article] [PubMed] [Google Scholar]
- 30.Gentles AJ, Newman AM, Liu CL, Bratman SV, Feng W, Kim D, et al. The prognostic landscape of genes and infiltrating immune cells across human cancers. Nat Med. 2015;21(8):938–45. 10.1038/nm.3909 [DOI] [PMC free article] [PubMed] [Google Scholar]
- 31.Newman AM, Liu CL, Green MR, Gentles AJ, Feng W, Xu Y, et al. Robust enumeration of cell subsets from tissue expression profiles. Nat Methods. 2015;12(5):453–7. 10.1038/nmeth.3337 [DOI] [PMC free article] [PubMed] [Google Scholar]
- 32.Rooney MS, Shukla SA, Wu CJ, Getz G, Hacohen N. Molecular and genetic properties of tumors associated with local immune cytolytic activity. Cell. 2015;160(1–2):48–61. 10.1016/j.cell.2014.12.033 [DOI] [PMC free article] [PubMed] [Google Scholar]
- 33.Wakiyama H, Masuda T, Motomura Y, Hu Q, Tobo T, Eguchi H, et al. Cytolytic activity (CYT) score is a prognostic biomarker reflecting host immune status in hepatocellular carcinoma (HCC). Anticancer Res. 2018;38(12):6631–8. 10.21873/anticanres.13030 [DOI] [PubMed] [Google Scholar]
- 34.Camp RL, Dolled-Filhart M, Rimm DL. X-tile: a new bio-informatics tool for biomarker assessment and outcome-based cut-point optimization. Clin Cancer Res. 2004;10(21):7252–9. 10.1158/1078-0432.CCR-04-0713 [DOI] [PubMed] [Google Scholar]
- 35.Dinh H, Pan F, Wang G, Huang Q, Olingy C, Wu Z, et al. Integrated single-cell transcriptome analysis reveals heterogeneity of esophageal squamous cell carcinoma microenvironment. Nat Commun. 2021;12(1):7335. 10.1038/s41467-021-27599-5 [DOI] [PMC free article] [PubMed] [Google Scholar]
- 36.Qiu SQ, Waaijer SJH, Zwager MC, de Vries EGE, van der Vegt B, Schroder CP. Tumor-associated macrophages in breast cancer: innocent bystander or important player? Cancer Treat Rev. 2018;70:178–89. 10.1016/j.ctrv.2018.08.010 [DOI] [PubMed] [Google Scholar]
- 37.Gordon S, Taylor PR. Monocyte and macrophage heterogeneity. Nat Rev Immunol. 2005;5(12):953–64. 10.1038/nri1733 [DOI] [PubMed] [Google Scholar]
- 38.Shevyrev D, Tereshchenko V. Treg Heterogeneity, function, and homeostasis. Front Immunol. 2019;10:3100. 10.3389/fimmu.2019.03100 [DOI] [PMC free article] [PubMed] [Google Scholar]
- 39.Wing JB, Tanaka A, Sakaguchi S. Human FOXP3(+) Regulatory T cell heterogeneity and function in autoimmunity and cancer. Immunity. 2019;50(2):302–16. 10.1016/j.immuni.2019.01.020 [DOI] [PubMed] [Google Scholar]
- 40.Yin X, Chen S, Eisenbarth SC. Dendritic cell regulation of T helper cells. Annu Rev Immunol. 2021;39:759–90. 10.1146/annurev-immunol-101819-025146 [DOI] [PubMed] [Google Scholar]
- 41.Barbi J, Pardoll D, Pan F. Treg functional stability and its responsiveness to the microenvironment. Immunol Rev. 2014;259(1):115–39. 10.1111/imr.12172 [DOI] [PMC free article] [PubMed] [Google Scholar]
- 42.Thorsson V, Gibbs DL, Brown SD, Wolf D, Bortone DS, Ou Yang TH, et al. Immune Landsc Cancer Immun. 2018;48(4):812–e830814. [Google Scholar]
- 43.Liu C, Yao Z, Wang J, Zhang W, Yang Y, Zhang Y, et al. Macrophage-derived CCL5 facilitates immune escape of colorectal cancer cells via the p65/STAT3-CSN5-PD-L1 pathway. Cell Death Differ. 2020;27(6):1765–81. 10.1038/s41418-019-0460-0 [DOI] [PMC free article] [PubMed] [Google Scholar]
- 44.Pylayeva-Gupta Y, Lee KE, Hajdu CH, Miller G, Bar-Sagi D. Oncogenic Kras-induced GM-CSF production promotes the development of pancreatic neoplasia. Cancer Cell. 2012;21(6):836–47. 10.1016/j.ccr.2012.04.024 [DOI] [PMC free article] [PubMed] [Google Scholar]
- 45.Rong QX, Wang F, Guo ZX, Hu Y, An SN, Luo M, et al. GM-CSF mediates immune evasion via upregulation of PD-L1 expression in extranodal natural killer/T cell lymphoma. Mol Cancer. 2021;20(1):80. 10.1186/s12943-021-01374-y [DOI] [PMC free article] [PubMed] [Google Scholar]
Associated Data
This section collects any data citations, data availability statements, or supplementary materials included in this article.
Supplementary Materials
Data Availability Statement
No datasets were generated or analysed during the current study.


