Purpose and Appropriate Sample Types
The primary eight-color panel was designed to measure IFNγ, IL-2, and TNF production from viable CD4 and CD8 T cells from rhesus macaques in preclinical vaccine studies. An 11-color variant also allows for the assessment of memory subsets based on surface expression of CD28, CD45RA, and CCR7. The panel was optimized not only for use on cryopreserved peripheral blood mononuclear cell (PBMC) samples but also works well on fresh PBMC samples, cryopreserved tissue samples, and fresh tissue samples that have been treated with RBC lysis buffer (Table 1). The eight-color panel and associated staining procedure were tested in a formal qualification study and shown to be highly reproducible with low interaliquot, interday, and interanalyst variability according to the qualification criteria (manuscript in preparation).
Table 1.
Summary table for application of OMIP-005
| Purpose | T cell cytokine production and memory phenotype |
| Species | Rhesus macaque |
| Cell types | PBMC |
| Cross references | (Lamoreaux et al. OMIP-009) |
Background
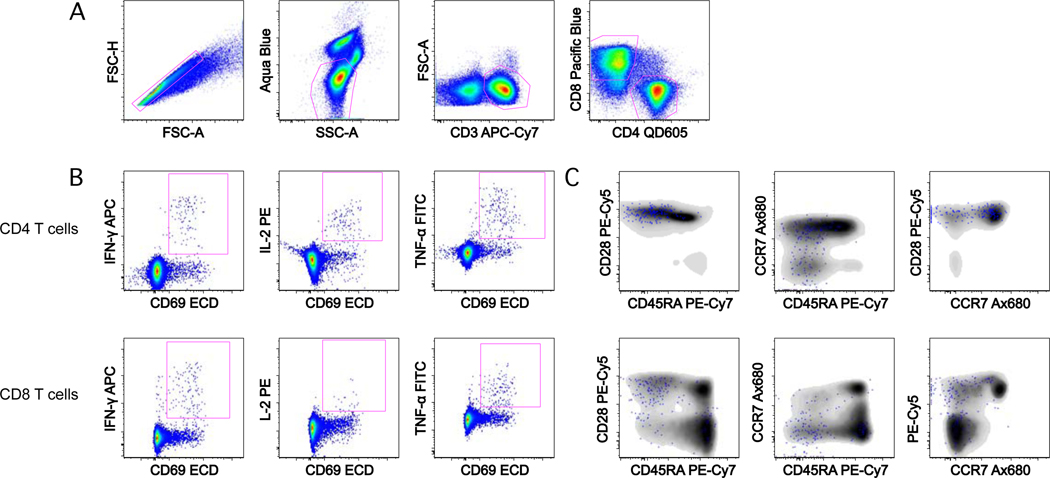
Measurement of Ag-specific T cell responses from vaccinated animals can be difficult due to low frequencies of cytokine-producing cells and high background. The approach that was used to design these panels was to prioritize the cytokine detection reagents on the brightest fluorochromes to allow for the most sensitive detection of weak responses. Then, the remaining antibody/conjugate combinations were tested to optimize detection on the other detectors (1). Because activated T cells often internalize CD3 following stimulation (2), we included anti-CD3 in the intracellular staining portion of the assay to ensure that cytokine producing cells were not excluded. To reduce background arising from cells nonspecifically binding cytokine antibodies, anti-CD69 and a live/dead discriminator were included (3,4). The eight-color panel is sufficient to measure cytokine production from CD4 and CD8 T cells, whereas the 11-color variant allows for the further discrimination of memory subsets (Table 2 and Figure 1). Unlike other similar panels, the anti-CD28 and anti-CCR7 antibodies were included with the other surface antibodies in a one-step stain because costimulatory antibodies were not used in this protocol and CCR7 staining at room temperature gave good separation.
Table 2.
Reagents used
| specificity | clone | fluorochrome | purpose |
|---|---|---|---|
|
| |||
| Dead cells | Aqua Blue | Exclusion | |
| CD3 | SP34.2 | APC-Cy7 | T cells |
| CD4 | S3.5 | QD605 | |
| CD8 | RPA-T8 | Pacific Blue | |
| CD69 | TP1.55.3 | ECD | Background reduction |
| IFNγ | B27 | APC | Cytokines |
| IL-2 | MQ1–17H12 | PE | |
| TNF | Mab11 | FITC | |
| CD45RA | L48 | PE-Cy7 | Memory markers (optional) |
| CD28 | 28.2 | PE-Cy5 | |
| CCR7 | 150503 | Ax680 | |
Figure 1.
Example staining and gating on rhesus macaque PBMC. (A) T cell subsets are selected by successive gating: first single cells, second live, SSC low cells, third CD3+, FSC low cells, and finally CD8+ and CD4+ T cells. (B) For each T cell subset, CD69+cytokine+ gates are drawn. (C) Memory subsets can be visualized by overlaying the cytokine-positive cells (IFNγ+ or IL-2+ or TNF+ Boolean gate in FlowJo; blue) on the total CD4 or CD8 T cell population (gray).
Similarity to Published OMIPs
None
Supplementary Material
Acknowledgments
The authors thank Laurie Lamoreaux for advice and help in developing and optimizing this panel; Pratip Chattopadhyay and Joanne Yu for advice in optimizing the multicolor panel and characterizing reagents; and Steven Perfetto and Richard Nguyen for expert flow cytometry advice; and the members of the Comprehensive T Cell Vaccine Immune Monitoring Core (NHP Core) for assistance in multisite evaluation and optimization.
Grant sponsor:
National Institute of Allergy and Infectious Diseases, NIH (Intramural Research Program); Grant sponsor: Collaboration for AIDS Vaccine Discovery (CAVD) award; Grant number: #38650
Footnotes
Additional Supporting Information may be found in the online version of this article.
Literature Cited
- 1.Mahnke Y, Roederer M. Optimizing a multicolor immunophenotyping assay. Clin Lab Med 2007;27:469–485. [DOI] [PMC free article] [PubMed] [Google Scholar]
- 2.Alcover A, Alarcon B. Internalization and intracellular fate of TCR-CD3 complexes. Crit Rev Immunol 2000;20:325–346. [PubMed] [Google Scholar]
- 3.Picker L, Singh M, Zdraveski Z, Treer J, Waldrop S, Bergstresser P, Maino V. Direct demonstration of cytokine synthesis heterogeneity among human memory/effector T cells by flow cytometry. Blood 1995;86:1408–1419. [PubMed] [Google Scholar]
- 4.Perfetto S, Chattopadhyay P, Lamoreaux L, Nguyen R, Ambrozak D, Koup R, Roderer M. Amine-reactive dyes for dead cell discrimination in fixed samples. Curr Protocols Cytometry 2010;53:9.34.1–9.34.14. [DOI] [PMC free article] [PubMed] [Google Scholar]
Associated Data
This section collects any data citations, data availability statements, or supplementary materials included in this article.


