

Abstract
HIV infection and its treatment are associated with mitochondrial dysfunction and metabolic derangement. However, longitudinal changes in oxidative phosphorylation activities [Complex I (C1) and Complex IV (C4)], or venous lactate/pyruvate ratios (LPR), and their relationships with insulin resistance (IR), remain unclear in youth living with perinatally-acquired HIV (YPHIV). We measured venous LPR, C1, and C4 activities in blood cells and homeostatic model assessment for IR (HOMA-IR) over two years. Limited longitudinal differences in mitochondrial-related measures and IR were observed in YPHIV vs youth perinatally HIV-exposed but uninfected. There were no systematic differences in C1, C4, or HOMA-IR between the groups.
Keywords: Insulin resistance, Lactate, Mitochondria, Oxidative phosphorylation, Perinatal HIV, Youth
1. Introduction
According to the World Health Organization, perinatal HIV exposure currently occurs in approximately 1.3 million pregnancies yearly across the world (Mother-to-child transmission of HIV [Internet]. [cited, 2022). However, the percentage of infants born with perinatally-acquired HIV (PHIV) has decreased dramatically with widespread access to antiretroviral therapy (ART) during pregnancy. In addition, morbidity and mortality have diminished remarkably in youth living with PHIV (YPHIV), with many on ART now reaching adolescence and adulthood. However, chronic comorbidities such as metabolic derangements associated with perturbed mitochondrial function and/or reduced insulin sensitivity remain an important area of concern, as adults with HIV are at increased risk for insulin resistance (IR), type 2 diabetes (T2D), and/or cardiovascular disease due to HIV (Cheney et al., 2011; Lecoeur et al., 2012; Ogawa et al., 2015; Rodríguez-Mora et al., 2015; Villeneuve et al., 2016; Sun et al., 2018; Noubissi et al., 2018) and ART (Dagan et al., 2002; Poirier et al., 2003; McComsey et al., 2008; Crain et al., 2010; Sims et al., 2018).
Cellular bioenergy in the form of adenosine triphosphate (ATP) is produced mainly via glucose catabolism during glycolysis in the cytosol or oxidative phosphorylation (OXPHOS) within the mitochondria, with the latter producing more ATP per glucose molecule (Mookerjee et al., 2017). The balance and interplay between generating ATP from glucose via glycolysis or OXPHOS can broadly be assessed by measuring lactate-to-pyruvate ratios (LPR), as high levels of venous lactate may indicate perturbations to the Cori cycle, and LPR may help to distinguish underlying mechanisms of hyperlactatemia (Ben-Hamouda et al., 2013; Redant et al., 2019). In the electron transport system of the mitochondrion, the activity of Complex I (C1) primarily relate to the utilization of glucose metabolites. In contrast, the activity of Complex II utilizes fatty acid metabolites, and Complex IV (C4) activity is responsible for passing along electrons from either metabolic pathway into ATP synthase (Vercellino and Sazanov, 2022). Concomitantly in the mitochondrion, electron leakage, reducing equivalents, and tricarboxylic acid cycle intermediates are generated that are known to affect physiology and disease states such as T2D (Vercellino and Sazanov, 2022; Rötig et al., 2003; Fex et al., 2018; Martínez-Reyes and Chandel, 2020). Thus, measurements of venous LPR or mitochondrial complex activity levels give a useful measure of an aspect of cardiometabolic derangement.
Our previous cross-sectional analyses from the Mitochondrial Determinants Component (MDC) sub-study of the prospective US-based Pediatric HIV/AIDS Cohort Study (PHACS) Adolescent Master Protocol (AMP) (Protocols, 2022) showed that YPHIV display: (1) elevated biomarkers for cardiometabolic dysfunction at early ages (Miller et al., 2012); (2) elevated prevalence of IR compared to HIV-uninfected non-obese youth (Geffner et al., 2018); (3) increased risk of IR if they display mitochondrial dysfunction (i.e., lowered OXPHOS C1 activity) and classical anthropometrics of concern (e.g., high BMI) (Gojanovich et al., 2020); and (4) perturbed mitochondrial function and substrate utilization, as reflected by increased LPR (Jao et al., 2021). However, longitudinal analyses of relationships between mitochondrial dysfunction and IR in YPHIV and youth perinatally HIV-exposed but uninfected (YPHEU) are lacking.
The US Department of Health and Human Services Perinatal HIV Guidelines recommend that information on perinatal HIV and ART exposure be retained in medical records for children without HIV; there may be potential metabolic abnormalities when youth with perinatal HIV/ARV exposure experience unexplained cardiac or neurologic dysfunction (Follow-Up, 2022). Thus, the objectives of our study were to determine whether: (1) exposure to perinatal HIV and ART are associated with detectable changes in OXPHOS activities and LPR over time; and (2) these putative changes are associated with changes in the Homeostatic Model Assessment of IR (HOMA-IR) over time.
2. Material and methods
2.1. Study Population, Inclusion/Exclusion criteria
The study cohort consisted of 243 YPHIV and 118 YPHEU participants in the MDC sub-study of the PHACS network as described previously (Jao et al., 2021). Briefly, participants for the MDC sub-study were enrolled in PHACS AMP from May 2011 to September 2013 and followed yearly for up to 2 years. Exclusion criteria (for both YPHIV and YPHEU) included: children with known mitochondrial abnormalities, type I diabetes, liver dysfunction (HCV, HBV), and conditions known to affect mitochondrial function or serum lactate levels (acute infection, malignancy, ischemic condition). Written informed consent was obtained from each youth’s parent or legal guardian, and assent was obtained from youth participants according to local IRB guidelines.
2.2. Sociodemographic, Clinical, and laboratory measurements
Sociodemographic characteristics were obtained from the PHACS AMP study database, including sex at birth, age, self-reported race and ethnicity, and household annual income. Sexual maturity assessments were performed using Tanner staging and categorized as Stages 1–2 or 3–5. Anthropometric measures were obtained using standard techniques (ACTG/IMPAACT Laboratory Resources [Internet]. HANC. [cited, 2023; Jacobson et al., 2011) with corresponding Z-scores calculated using the CDC 2000 reference norms for weight (WTZ), height (HTZ), body mass index (BMIZ), and mid-waist circumference (MWCZ) (Kuczmarski et al., 2000).
For YPHIV, absolute CD4 count and percentages, plasma HIV-1 viral load (VL), and ARV regimen history were abstracted from medical records. Use of individual ARVs was assessed based on whether patients were currently receiving or had ever received the medication, as was the cumulative duration of medication usage. Any regimens with ≥ 3 classes of ARVs immediately fall into the first category (≥3 classes of ARVs) before we proceed with defining the rest, strictly following the below order:
INSTI-based, defined as either (1 or more NRTIs + 1 or more INSTIs) or (1 or more INSTIs only)
PI-based, defined as either (1 or more NRTIs + 1 or more Pis) or (1 or more Pis only)
NNRTI-based, defined as either (1 or more NRTIs + 1 or more NNRTIs) or (1 or more NNRTIs only)
NRTI-based, defined as 1 or more NRTIs only
Other, defined as everything else.
Mitochondrial-related measurements (MM) of OXPHOS C1 and C4 activities and venous LPR were performed as described previously (Gojanovich et al., 2020; Jao et al., 2021). Briefly, peripheral blood mononuclear cells (PBMC) were obtained from EDTA vacutainers within 8 h of phlebotomy and isolated using the Ficoll-Hypaque Overlay Method. Isolated PBMC (5.0 × 10⁶ cells/0.5 mL) were cryopreserved (−140 °C) and shipped quarterly to the University of Hawaii on dry ice. Measurement of OXPHOS C1 and C4 enzymatic activities was performed in duplicate by thin-layer chromatography and immunoassays. Activity was measured as optical density (OD) per minute per microgram of protein per 103 PBMC. These measures were log10-transformed to more closely approximate normality.
Fasting glucose, insulin, and lipids were assayed centrally at the Diabetes Research Institute Clinical Chemistry Laboratory at the University of Miami on a Cobas 6000 analyzer (Roche Diagnostics, Indianapolis, IN) following manufacturer specifications. Specimens for the above measures were used within a ± 3-month window relative to each C1 or C4 specimen date or the LPR date for each respective analysis (Fig. 1). Insulin sensitivity was assessed by HOMA-IR (Kuczmarski et al., 2000; Matthews et al., 1985).
Fig. 1. Flow Chart for Study Participant Inclusion/Exclusion.
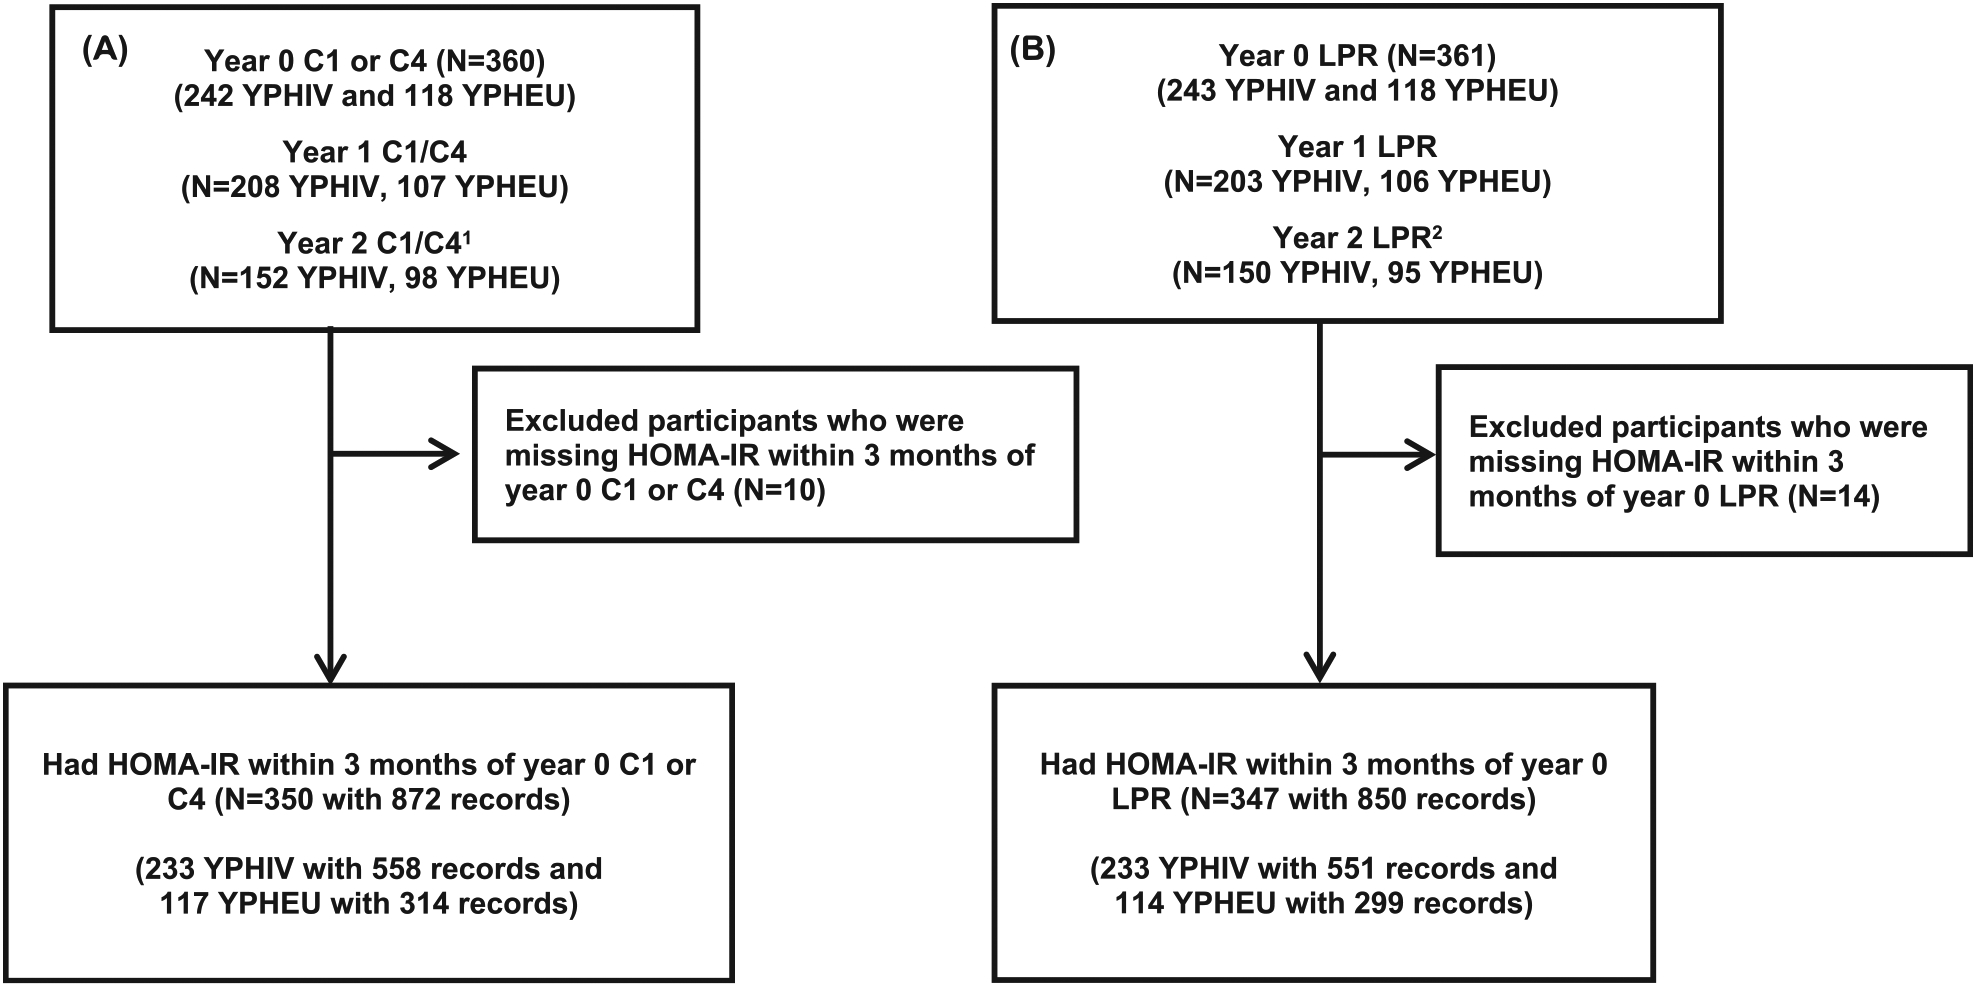
Representation of participant inclusion/exclusion criteria for A) OXPHOS C1 or C4 activities and B) LPR values. 1 8 YPHIV and 8 YPHEU had Year 2, but not Year 1, visits. 2 10 YPHIV and 8 YPHEU had Year 2, but not Year 1, visits. C1 = mitochondrial complex I; C4 = mitochondrial complex IV; HOMA-IR = homeostatic model assessment for insulin resistance; LPR = lactate/pyruvate ratio; YPHEU = Youth perinatally HIV-exposed but uninfected; YPHIV = Youth living with perinatally-acquired HIV.
Lactate (Lac) and Pyruvate (Pyr) were measured following PHACS AMP Protocol version 4.0, based on the ACTG/IMPAACT Laboratory Manual, available at: https://www.hanc.info/labs/labresources/procedures/Pages/actgImpaactLabManual.aspx. Lac and Pyr levels were determined at each clinical site following the above-mentioned, standardized protocols. Abnormal lactate was defined as > 2.0 mmol/L. If lactate was > 2.0 mmol/L, but the Lac/Pyr ratio was ≤ 20, a secondary collection was performed to determine Lac and Pyr concentrations.
2.3. Statistical analyses
Characteristics were described in YPHIV and YPHEU at the time of the first available C1, C4, or LPR specimen date (Year 0). To determine which variable of adiposity to include in models, we performed correlational analyses, which indicated BMIZ and MWCZ were highly correlated (rho = 0.85; data not shown) and similarly correlated with HOMA-IR. We determined MWCZ to be a better surrogate for adiposity, as participants with a low BMIZ could still show high MWCZ, but not vice versa. Year 0 liver and kidney function markers and blood analytes were compared between YPHIV and YPHEU using a Fisher exact test, Wilcoxon rank sum test, or t-test with unequal variances, as appropriate.
Linear mixed-effects models with random intercept and slope were fit to assess the association between PHIV status and trajectory of log10-transformed MM unadjusted or adjusted for a priori selected variables including sex at birth, age, and annual family income (≤$10,000 vs >$10,000) at Year 0. These models included non-stabilized inverse probability censoring weights (IPCW) to adjust for loss to follow-up. A logistic model was fit to calculate IPCW including PHIV status, sex, age, and annual family income (with a missing indicator) at the immediately prior visit.
We first categorized each Year 0 MM in YPHEU into three groups: the lower quartile (≤25 %), the intermediate quartiles (26 %-75 %, reference group), and the upper quartile (>75 %). We assumed that YPHEU were more likely than YPHIV to represent the distribution of MM among HIV-unexposed and –uninfected populations. Next, the values for each MM among the YPHIV were categorized using the quartile cut-offs established from the YPHEU. To assess whether the trajectories of log10-transformed HOMA-IR differed by Year 0 mitochondrial categories, linear mixed-effect models were fit, including main effect terms of years since Year 0, and Year 0 MM categories and the interaction terms of the main effects, separately for YPHIV and YPHEU. We presented the estimated slopes and 95 % confidence interval (CI) for each MM category. Among YPHEU, models were adjusted for sex, age, Tanner stage, MWCZ, and income level at Year 0. Among YPHIV, models were additionally adjusted for HIV disease severity measures, specifically ARV use (≥3 classes, PI-based, not on ARV vs non-PI-based) and log10-transformed peak VL at Year 0. These models included IPCW to account for loss to follow-up. For YPHEU, the IPCW was calculated via logistic regression models including MM categories, age, year of visit, sex, MWCZ, Tanner stage, and income level at the immediately prior visit. For YPHIV, the IPCW models additionally included ARV use and log10 peak VL at the immediately prior visit.
Linear regression models were fit using generalized estimating equations (GEE) to assess the association of changes of each MM in the log10-transformed scale from Year 0 to Year 1 with the outcome of log10-transformed HOMA-IR at Year 1, and also the association of changes of each MM from Year 0 to Year 2 in log10-transformed scale with the outcome of log10-transformed HOMA-IR at Year 2. Furthermore, separate models were also fit to assess the association of changes of each log10-transformed MM from Year 0 to Year 1 with changes in log10-transformed HOMA-IR from Year 0 to Year 1, or from Year 0 to Year 2. For YPHEU, models were adjusted for sex, Tanner stage, MWCZ, and income level at Year 0. For YPHIV, models were also adjusted as in the above paragraph.
SAS 9.4 was used in all analyses, and all statistical tests were two-sided.
3. RESULTS
3.1. Cohort
Among the 361 participants (243 YPHIV and 118 YPHEU) enrolled in the MDC study that had either C1, C4, or LPR at Year 0, 350 participants (233 YPHIV and 117 YPHEU) had HOMA-IR within 3 months of Year 0 C1/C4 and 347 participants (233 YPHIV and 114 YPHEU) had HOMA-IR within 3 months of Year 0 LPR (Fig. 1).
3.2. Participants
The sociodemographic and physical characteristics at the Year 0 visit for the YPHIV and YPHEU are shown in Table 1, with all visits in Table 1. YPHIV were on average 3.1 years older and more often had a higher Tanner stage than YPHEU (89 % vs 64 % at Tanner stage 3–5) at Year 0. As you can see in Supplemental Fig. 1, although the mean age of these two cohorts were 2 years different, each cohort had similarly dispersed age distribution over the same range of 13 years. YPHIV more often self-reported as Black (74 % vs 65 %), but less often as Hispanic (28 % vs 34 %). YPHIV more often reported an annual household income >$10,000 (78 % vs 64 %) and had lower median WTZ, HTZ, BMIZ, and MWCZ.
Table 1.
Study participant self-reported and medical record-derived characteristics at each visit by PHIV status.
| YPHIV | YPHEU | ||||||
|---|---|---|---|---|---|---|---|
| Year 0(N = 243) | Year 1(N = 212) | Year 2(N = 165) | Year 0(N = 118) | Year 1(N = 109) | Year 2(N = 103) | ||
| Age (years) | Median (Q1, Q3), N | 15.8 (13.7, 17.7), 243 | 16.8 (14.6, 18.6), 212 | 17.3 (14.9, 18.9), 165 | 12.7 (10.9, 14.4), 118 | 13.8 (11.9, 15.2), 109 | 14.7 (12.8, 16.2), 103 |
| Ethnicity | Hispanic or Latino | 67 (28 %) | 58 (27 %) | 46 (28 %) | 40 (34 %) | 37 (34 %) | 34 (33 %) |
| Not Hispanic or Latino | 175 (72 %) | 153 (72 %) | 118 (72%) | 77 (65 %) | 71 (65 %) | 68 (66 %) | |
| >1 ethnic groups | 0 (0 %) | 0 (0 %) | 0 (0 %) | 1 (1 %) | 1 (1 %) | 1 (1 %) | |
| Unknown | 1 | 1 | 1 | 0 | 0 | 0 | |
| Race | White | 58 (25 %) | 50 (25 %) | 42 (26 %) | 40 (34 %) | 37 (35 %) | 33 (33 %) |
| Black | 173 (74 %) | 151 (74 %) | 115 (72%) | 75 (65 %) | 69 (64 %) | 67 (66 %) | |
| Other | 3 (1 %) | 3 (1 %) | 3 (2 %) | 1 (1 %) | 1 (1 %) | 1 (1 %) | |
| Not known/reported | 9 | 8 | 5 | 2 | 2 | 2 | |
| Sex | M | 125 (51 %) | 111 (52%) | 91 (55 %) | 60 (51 %) | 55 (50 %) | 49 (48 %) |
| F | 118 (49 %) | 101 (48 %) | 74 (45 %) | 58 (49 %) | 54 (50 %) | 54 (52 %) | |
| Annual household income | <$10,001 | 52 (22 %) | 48 (23 %) | 37 (23 %) | 43 (36 %) | 35 (32 %) | 35 (34 %) |
| $10,001-$20,000 | 54 (23 %) | 38 (18 %) | 28 (17 %) | 30 (25 %) | 30 (28 %) | 34 (33 %) | |
| $20,001-$30,000 | 37 (15 %) | 32 (15 %) | 27 (17 %) | 22 (19 %) | 18 (17 %) | 13 (13 %) | |
| $30,001-$40,000 | 22 (9 %) | 20 (10 %) | 16 (10 %) | 4 (3 %) | 6 (6 %) | 5 (5 %) | |
| $40,001-$50,000 | 24 (10 %) | 21 (10 %) | 19 (12%) | 8 (7 %) | 9 (8 %) | 5 (5 %) | |
| $50,001-$70,000 | 20 (8 %) | 21 (10 %) | 11 (7%) | 5 (4 %) | 2 (2 %) | 4 (4 %) | |
| $70,001-$100,000 | 19 (8 %) | 19 (9 %) | 15 (9 %) | 4 (3 %) | 7 (6 %) | 5 (5 %) | |
| > $100,000 | 11 (5%) | 10 (5 %) | 9 (6 %) | 2 (2 %) | 2 (2 %) | 2 (2 %) | |
| Unknown | 4 | 3 | 3 | 0 | 0 | 0 | |
| ≤10,000 | 52 (22 %) | 48 (23 %) | 37 (23 %) | 43 (36 %) | 35 (32 %) | 35 (34 %) | |
| >10,000 | 187 (78 %) | 161 (77 %) | 125 (77 %) | 75 (64 %) | 74 (68 %) | 68 (66 %) | |
| Weight Z-score | Median (Q1, Q3), N | 0.2 (−0.7, 1.2), 235 | 0.1 (−0.6, 1.1), 186 | 0.3 (−0.7, 1.3), 127 | 0.9 (−0.1, 1.7), 118 | 0.7 (−0.2, 1.6), 108 | 0.7 (−0.2, 1.9), 98 |
| Height Z-score | Median (Q1, Q3), N | −0.4 (−1.2, 0.4), 234 | −0.4 (−1.0, 0.3), 186 | −0.5 (−1.0, 0.3), 127 | 0.3 (−0.3, 1.0), 118 | 0.2 (−0.3, 0.9), 108 | 0.1 (−0.4, 0.8), 98 |
| BMI Z-score | Median (Q1, Q3), N | 0.4 (−0.4, 1.2), 234 | 0.3 (−0.5, 1.2), 186 | 0.5 (−0.5, 1.4), 127 | 0.8 (−0.2, 1.8), 118 | 0.6 (−0.3, 1.7), 108 | 0.8 (−0.1, 1.9), 98 |
| MWC Z-score | Median (Q1, Q3), N | 0.4 (−0.4, 1.0), 208 | 0.3 (−0.4, 1.0), 156 | 0.3 (−0.6, 1.1), 119 | 0.8 (−0.1, 1.6), 116 | 0.5 (−0.2, 1.4), 103 | 0.5 (−0.1, 1.6), 95 |
| Tanner Stage | 1 | 9 (4 %) | 5 (2 %) | 1 (1 %) | 14 (12%) | 7 (6 %) | 1 (1 %) |
| 2 | 17 (7 %) | 9 (4 %) | 5 (3 %) | 28 (24 %) | 15 (14 %) | 9 (9 %) | |
| 3 | 33 (14 %) | 22 (10 %) | 14 (9 %) | 21 (18 %) | 16 (15 %) | 14 (14 %) | |
| 4 | 36 (15 %) | 28 (13 %) | 26 (16 %) | 26 (22 %) | 29 (27 %) | 19 (18 %) | |
| 5 | 146 (61 %) | 146 (70 %) | 116 (72%) | 29 (25 %) | 41 (38 %) | 60 (58 %) | |
| Missing | 2 | 2 | 3 | 0 | 1 | 0 | |
| 1–2 | 26 (11 %) | 14 (7 %) | 6 (4 %) | 42 (36 %) | 22 (20 %) | 10 (10 %) | |
| 3–5 | 215 (89 %) | 196 (93 %) | 156 (96 %) | 76 (64 %) | 86 (80 %) | 93 (90 %) | |
BMI = Body Mass Index; MWC = Mid-waist circumference; Q1 and Q3 = first and third quartiles; YPHEU = Youth perinatally HIV-exposed but uninfected; YPHIV = Youth living with perinatally-acquired HIV.
3.3. Clinical characteristics
Liver and kidney function measures and blood analyte concentrations at each visit are shown in Table 2, where significantly higher levels were observed in YPHIV than YPHEU for alanine aminotransferase (ALT), aspartate aminotransferase (AST), total cholesterol to high-density lipoprotein (HDL) ratios, triglycerides, creatinine, and blood urea nitrogen. Among YPHIV, current CD4 percentages increased between Year 0 and Year 1 and HIV VL decreased over time, respectively (Tables 3 and 4). At Year 0, almost all YPHIV (98 %) had some exposure to a thymidine analogue (zidovudine, didanosine, stavudine) with a median cumulative treatment duration of 11.4 years. About 50 % of YPHIV were on a PI-based regimen at Year 0 and 46–47 % at Years 1 and 2.
Table 2.
Liver and kidney function measures and fasting lipid profiles at each visit by PHIV status.
| Visit | YPHIVMedian (Q1, Q3), N |
YPHEUMedian (Q1, Q3), N |
p value | |
|---|---|---|---|---|
| Alanine Aminotransferase (ALT, U/L) | Year 0 | 20.0 (14.0, 28.0), 213 | 15.3 (11.8, 18.7), 94 | <0.001 |
| Year 1 | 19.0 (14.0, 26.0), 181 | 14.7 (11.0, 18.5), 88 | <0.001 | |
| Year 2 | 20.0 (15.0, 30.0), 118 | 14.0 (10.6, 18.7), 82 | <0.001 | |
| Aspartate Aminotransferase (AST, U/L) | Year 0 | 26.0 (21.0, 33.0), 212 | 21.3 (17.6, 25.1), 94 | <0.001 |
| Year 1 | 26.0 (21.0, 32.0), 178 | 20.0 (16.9, 23.9), 88 | <0.001 | |
| Year 2 | 26.0 (20.0, 34.0), 117 | 20.3 (17.4, 23.7), 82 | <0.001 | |
| Total Cholesterol (mg/dL) | Year 0 | 157.5 (136.0, 182.0), 234 | 152.5 (135.0, 172.0), 118 | 0.20 |
| Year 1 | 156.0 (134.0, 180.0), 198 | 155.6 (133.3, 177.4), 104 | 0.97 | |
| Year 2 | 155.0 (133.0, 181.0), 128 | 156.6 (142.0, 177.9), 96 | 0.43 | |
| High-density lipoprotein (HDL) cholesterol (mg/dL) | Year 0 | 46.0 (40.0, 56.0), 209 | 49.0 (40.9, 56.0), 98 | 0.35 |
| Year 1 | 47.0 (38.0, 55.0), 182 | 49.7 (41.9, 59.3), 86 | 0.069 | |
| Year 2 | 47.0 (39.0, 55.0), 117 | 50.9 (44.2, 58.1), 81 | 0.027 | |
| Total cholesterol/HDL ratio | Year 0 | 3.4 (2.8, 4.0), 209 | 3.1 (2.5, 3.6), 98 | 0.020 |
| Year 1 | 3.3 (2.7, 4.0), 182 | 3.0 (2.7, 3.4), 86 | 0.032 | |
| Year 2 | 3.2 (2.8, 3.8), 117 | 3.0 (2.6, 3.5), 81 | 0.026 | |
| Non-HDL cholesterol (mg/dL) | Year 0 | 105.0 (89.0, 133.0), 209 | 97.5 (82.0, 120.0), 98 | 0.081 |
| Year 1 | 107.0 (84.0, 130.0), 182 | 99.5 (89.7, 121.2), 86 | 0.44 | |
| Year 2 | 107.0 (85.0, 131.0), 117 | 100.0 (86.7, 127.7), 81 | 0.65 | |
| Low-density lipoprotein (LDL) cholesterol (mg/dL) | Year 0 | 87.0 (69.0, 111.0), 207 | 86.5 (73.0, 105.0), 98 | 0.98 |
| Year 1 | 86.0 (67.0, 105.0), 181 | 86.3 (74.9, 103.9), 86 | 0.24 | |
| Year 2 | 88.0 (70.5, 107.0), 116 | 86.7 (74.3, 110.4), 81 | 0.68 | |
| Total cholesterol/LDL ratio | Year 0 | 1.7 (1.6, 2.0), 207 | 1.7 (1.6, 1.9), 98 | 0.20 |
| Year 1 | 1.8 (1.6, 2.0), 181 | 1.8 (1.6, 1.9), 86 | 0.05 | |
| Year 2 | 1.8 (1.6, 1.9), 116 | 1.8 (1.6, 1.9), 81 | 0.86 | |
| Triglycerides (mg/dL) | Year 0 | 85.0 (63.0, 122.0), 211 | 58.5 (49.0, 83.0), 98 | <0.001 |
| Year 1 | 91.0 (65.0, 129.0), 182 | 66.7 (53.5, 83.8), 86 | <0.001 | |
| Year 2 | 84.0 (62.0, 124.0), 117 | 64.2 (47.9, 86.4), 81 | <0.001 | |
| Creatinine (mg/dL) | Year 0 | 0.7 (0.5, 0.8), 210 | 0.5 (0.4, 0.6), 94 | <0.001 |
| Year 1 | 0.7 (0.6, 0.8), 178 | 0.6 (0.5, 0.7), 88 | <0.001 | |
| Year 2 | 0.7 (0.6, 0.8), 118 | 0.6 (0.5, 0.7), 82 | <0.001 | |
| Blood urea nitrogen (mg/dL) | Year 0 | 11.0 (9.0, 13.0), 210 | 11.9 (10.0, 13.6), 94 | 0.004 |
| Year 1 | 10.0 (9.0, 13.0), 181 | 12.0 (10.1, 13.9), 88 | <0.001 | |
| Year 2 | 11.0 (9.0, 12.0), 116 | 11.5 (9.5, 14.2), 82 | 0.01 |
Q1 and Q3 = first and third quartiles; YPHEU = Youth perinatally HIV-exposed but uninfected; YPHIV = Youth living with perinatally-acquired HIV; p value = Wilcoxon test.
Table 3.
Study participants characteristics at Year 0 visit in YPHIV and YPHEU.
| YPHIV(N = 243) |
YPHEU(N = 118) |
||
|---|---|---|---|
| Age (years) | Median (Q1, Q3), N | 15.8 (13.7, 17.7), 243 | 12.7 (10.9, 14.4), 118 |
| Ethnicity 1 | Hispanic or Latino | 67 (28 %) | 40 (34 %) |
| Not Hispanic or Latino | 175 (72 %) | 77 (65 %) | |
| >1 ethnic groups | 0 (0 %) | 1 (1 %) | |
| Race 2 | White | 58 (25 %) | 40 (34 %) |
| Black | 173 (74 %) | 75 (65 %) | |
| Other | 3 (1 %) | 1 (1 %) | |
| Male sex at birth | N (%) | 125 (51 %) | 60 (51 %) |
| Annual household income 3 | ≤$10,000 | 52 (22 %) | 43 (36 %) |
| >$10,000 | 187 (78 %) | 75 (64 %) | |
| Weight Z-score | Median (Q1, Q3), N | 0.2 (−0.7, 1.2), 235 | 0.9 (−0.1, 1.7), 118 |
| Height Z-score | Median (Q1, Q3), N | −0.4 (−1.2, 0.4), 234 | 0.3 (−0.3, 1.0), 118 |
| BMI Z-score | Median (Q1, Q3), N | 0.4 (−0.4, 1.2), 234 | 0.8 (−0.2, 1.8), 118 |
| MWC Z-score | Median (Q1, Q3), N | 0.4 (−0.4, 1.0), 208 | 0.8 (−0.1, 1.6), 116 |
| Tanner Stage 4 | 1–2 | 26 (11 %) | 42 (36 %) |
| 3–5 | 216 (89 %) | 76 (64 %) | |
| Lifetime nadir CD4 (cells/mm3) | Median (Q1, Q3), N | 324.0 (162.0, 459.0), 243 | – |
| <200 | 72 (30 %) | – | |
| 200–500 | 123 (51 %) | – | |
| ≥500 | 48 (20 %) | – | |
| Current CD4 (cells/mm3) | Median (Q1, Q3), N | 617.0 (448.5, 840.0), 232 | – |
| <200 | 21 (9 %) | – | |
| 200–500 | 56 (24 %) | – | |
| ≥500 | 155 (67 %) | – | |
| Current CD4 percent | Median (Q1, Q3), N | 32.9 (25.0, 38.8), 231 | |
| Current log10-transfomed HIV RNA (copies/mL) | Median (Q1, Q3), N | 2.1 (1.6, 3.5), 223 | – |
| <400 | 131 (59 %) | – | |
| ≥400 | 92 (41 %) | – | |
| Lifetime peak log10-transformed HIV RNA (copies/mL) | Median (Q1, Q3), N | 5.5 (5.0, 5.9), 243 | – |
| Year 0 ARV use (categories) | ≥3 ARV classes | 44 (18 %) | – |
| INSTI-based cART | 9 (4 %) | – | |
| PI-based cART | 121 (50%) | – | |
| NNRTI-based cART | 38 (16 %) | – | |
| NRTI-based cART | 10 (4 %) | – | |
| Other | 1 (0 %) | – | |
| Not on ARV | 20 (8 %) | ||
| Lifetime thymidine analogue exposure (AZT, ddI, d4T) | Yes | 237 (98 %) | – |
| No | 6 (2 %) | – | |
| Cumulative duration (years) on thymidine analogues | Median (Q1, Q3),N | 11.4(8.8, 13.7), 243 | – |
ARV = Antiretroviral; AZT = Azidothymidine/Zidovudine; BMIZ = Body Mass Index Z-score; C1 = Complex 1; C4 = Complex 4; cART = combination Antiretroviral Therapy; CD = Cluster of Differentiation; d4T = Stavudine; ddI = didanosine; INSTI = Integrase strand transfer inhibitors; MWC = Mid-waist circumference; NRTI = Nucleoside Reverse Transcriptase Inhibitor; NNRTI = Non-nucleoside reverse transcriptase inhibitors; PI = Protease Inhibitors; Q1 and Q3 = first and third quartile, respectively; RNA = Ribonucleic Acid; YPHEU = Youth perinatally HIV-exposed but uninfected; YPHIV = Youth living with perinatally-acquired HIV. Lifetime nadir CD4 or peak log10 HIV RNA = nadir CD4 counts or peak log10 HIV RNA level, respectively, up to the specimen date of C1, C4 or LPR at Year 0 visit.
One YPHIV participant had missing or unknown ethnicity
Nine YPHIV and 2 YPHEU had unknown or no self-reported race
Four YPHIV were missing annual household income data
Two YPHIV were missing Tanner stage data.
Table 4.
HIV-specific clinical measures for YPHIV participants at each visit.
| Year 0(N = 243) |
Year 1(N = 212) |
Year 2(N = 165) |
||
|---|---|---|---|---|
| Lifetime nadir CD4 (cells/mm3) | Median (Q1, Q3), N | 324 (162, 459), 243 | 323 (159, 455), 212 | 326 (167, 467), 165 |
| <200 | 72 (30 %) | 68 (32 %) | 51 (31 %) | |
| 200–500 | 123 (51 %) | 106 (50 %) | 82 (50 %) | |
| ≥500 | 48 (20 %) | 38 (18 %) | 32 (19 %) | |
| Current CD4 (cells/mm3) 1 | Median (Q1, Q3), N | 617.0 (448.5, 840.0), 232 | 634 (440, 870), 195 | 624 (445, 826), 131 |
| <200 | 21 (9 %) | 18 (9 %) | 7 (5 %) | |
| 200–500 | 56 (24 %) | 47 (24 %) | 37 (28 %) | |
| ≥500 | 155 (67 %) | 130 (67 %) | 87 (66 %) | |
| Current CD4 percent | Median (Q1, Q3), N | 32.9 (25.0, 38.8), 231 | 34.0 (26.0, 39.0), 195 | 34.0 (25.0, 39.0), 131 |
| Current log10 HIV RNA (copies/mL) | Median (Q1, Q3), N | 2.1 (1.6, 3.5), 223 | 1.9 (1.6, 3.1), 193 | 1.7 (1.3, 3.1), 130 |
| <400 | 131 (59 %) | 126 (65 %) | 89 (68 %) | |
| ≥400 | 92 (41 %) | 67 (35 %) | 41 (32 %) | |
| Lifetime peak log10 HIV RNA (copies/mL) | Median (Q1, Q3), N | 5.5 (5.0, 5.9), 243 | 5.5 (5.0, 5.9), 212 | 5.5 (5.0, 5.9), 165 |
| Current ARV use (categories) 2 | ≥3 ARV classes | 44 (18 %) | 41 (19 %) | 31 (19 %) |
| INSTI-based cART | 9 (4 %) | 8 (4 %) | 7 (4 %) | |
| PI-based cART | 121 (50 %) | 99 (47 %) | 74 (46 %) | |
| NNRTI-based cART | 38 (16 %) | 39 (18 %) | 34 (21 %) | |
| NRTI-based cART | 10 (4 %) | 8 (4 %) | 4 (2 %) | |
| Other | 1 (0 %) | 1 (0 %) | 0 (0 %) | |
| Not on ARV | 20 (8 %) | 16 (8 %) | 12 (7 %) | |
| Ever thymidine analogue exposure (AZT, ddI, d4T) 3 | Yes | 237 (98 %) | 209 (99 %) | 159 (98 %) |
| No | 6 (2 %) | 3 (1 %) | 3 (2 %) | |
| Cumulative duration at visit (years) on thymidine analogues | Median (Q1, Q3), N | 11.4 (8.6, 13.7), 243 | 12.0 (9.3,14.1), 212 | 12.1 (9.3,14.1), 162 |
ARV = antiretroviral; AZT = Azidothymidine/Zidovudine; cART = combination antiretroviral therapy; CD = cluster of differentiation; d4T = Stavudine; ddI = didanosine; INSTI = integrase strand transfer inhibitors; NRTI = nucleoside reverse transcriptase inhibitor; NNRTI = non-nucleoside reverse transcriptase inhibitors; PI = protease inhibitors; Q1 and Q3 = first and third quartile; RNA = ribonucleic acid; YPHIV = youth living with perinatally-acquired HIV; Lifetime nadir CD4 or peak log10 HIV RNA = nadir CD4 counts or peak log10 HIV RNA level, respectively, up to the specimen date of C1, C4, or LPR at each visit; Cumulative duration: up to each visit.
11, 17 and 34 YPHIV participants had missing data at Year 0, Year 1 and Year 2 visits, respectively.
8 and 34 YPHIV participants had missing data at Year 1 and Year 2 visits, respectively.
8 and 34 YPHIV participants had missing data at Year 1 and Year 2 visits, respectively.
3.4. Mitochondrial-related measurements (MM) and HOMA-IR
Summaries of MM and HOMA-IR at each visit are shown in Table 5, while Fig. 2 graphically depicts distributions over time per group. At Year 0, YPHIV had higher median C1 and C4 compared to YPHEU, with a larger difference observed for C4 (75.0 vs 65.8 OD/min/ug e-3 PBMCs, P = 0.04). LPR was similar between the two groups over time. Median HOMA-IR was similar at Year 0 and Year 2, but lower in YPHIV compared to YPHEU at Year 1 (2.64 vs 3.48, P = 0.005).
Table 5.
Summaries of mitochondrial-related measurements (MM) and HOMA-IR at each visit by PHIV status.
| YPHIVMedian (Q1, Q3), N |
YPHEUMedian (Q1, Q3), N |
p
value |
||
|---|---|---|---|---|
| C1 enzyme activity (OD/min/ug e-3 PBMCs) | Year 0 | 45.9 (31.7, 59.6), 242 | 39.6 (30.3, 56.1), 118 | 0.11 |
| Year 1 | 52.8 (37.7, 66.9), 208 | 54.8 (45.7, 71.3), 107 | 0.07 | |
| Year 2 | 45.9 (32.0, 60.5), 148 | 46.1 (37.1, 59.0), 96 | 0.40 | |
| C4 enzyme activity (OD/min/ug e-3 PBMCs) | Year 0 | 75.0 (57.3, 88.9), 242 | 65.8 (56.2, 80.9), 118 | 0.04 |
| Year 1 | 103.4 (83.5, 125.7), 208 | 102.3 (79.2, 137.8), 107 | 0.56 | |
| Year 2 | 121.5 (102.6, 130.8), 152 | 120.0 (105.3, 139.2), 98 | 0.65 | |
| Venous lactate/pyruvate ratio (LPR) | Year 0 | 13.0 (9.8, 26.0), 243 | 12.5 (9.4, 21.1), 118 | 0.35 |
| Year 1 | 12.2 (8.8, 20.5), 198 | 11.6 (9.4, 18.5), 106 | 0.86 | |
| Year 2 | 13.0 (9.3, 20.7), 144 | 13.7 (10.1, 23.6), 91 | 0.67 | |
| HOMA-IR | Year 0 | 2.68 (1.86, 4.17), 234 | 2.74 (1.70, 4.26), 117 | 0.85 |
| Year 1 | 2.64 (1.78, 4.09), 198 | 3.48 (2.21, 5.17), 104 | 0.005 | |
| Year 2 | 2.81 (1.80, 5.07), 131 | 3.00 (2.03, 5.05), 96 | 0.38 |
C1 = Complex I; C4 = Complex IV; HOMA-IR = Homeostatic model assessment of insulin resistance; Q1 and Q3 = first and third quartile; PBMC = Peripheral blood mononuclear cells; YPHEU = Youth perinatally HIV-exposed but uninfected; YPHIV = Youth living with perinatally-acquired HIV; p value = Wilcoxon test.
Fig. 2. Distribution of mitochondrial-related measurements (MM) and HOMA-IR at each visit for YPHIV and YPHEU participants.
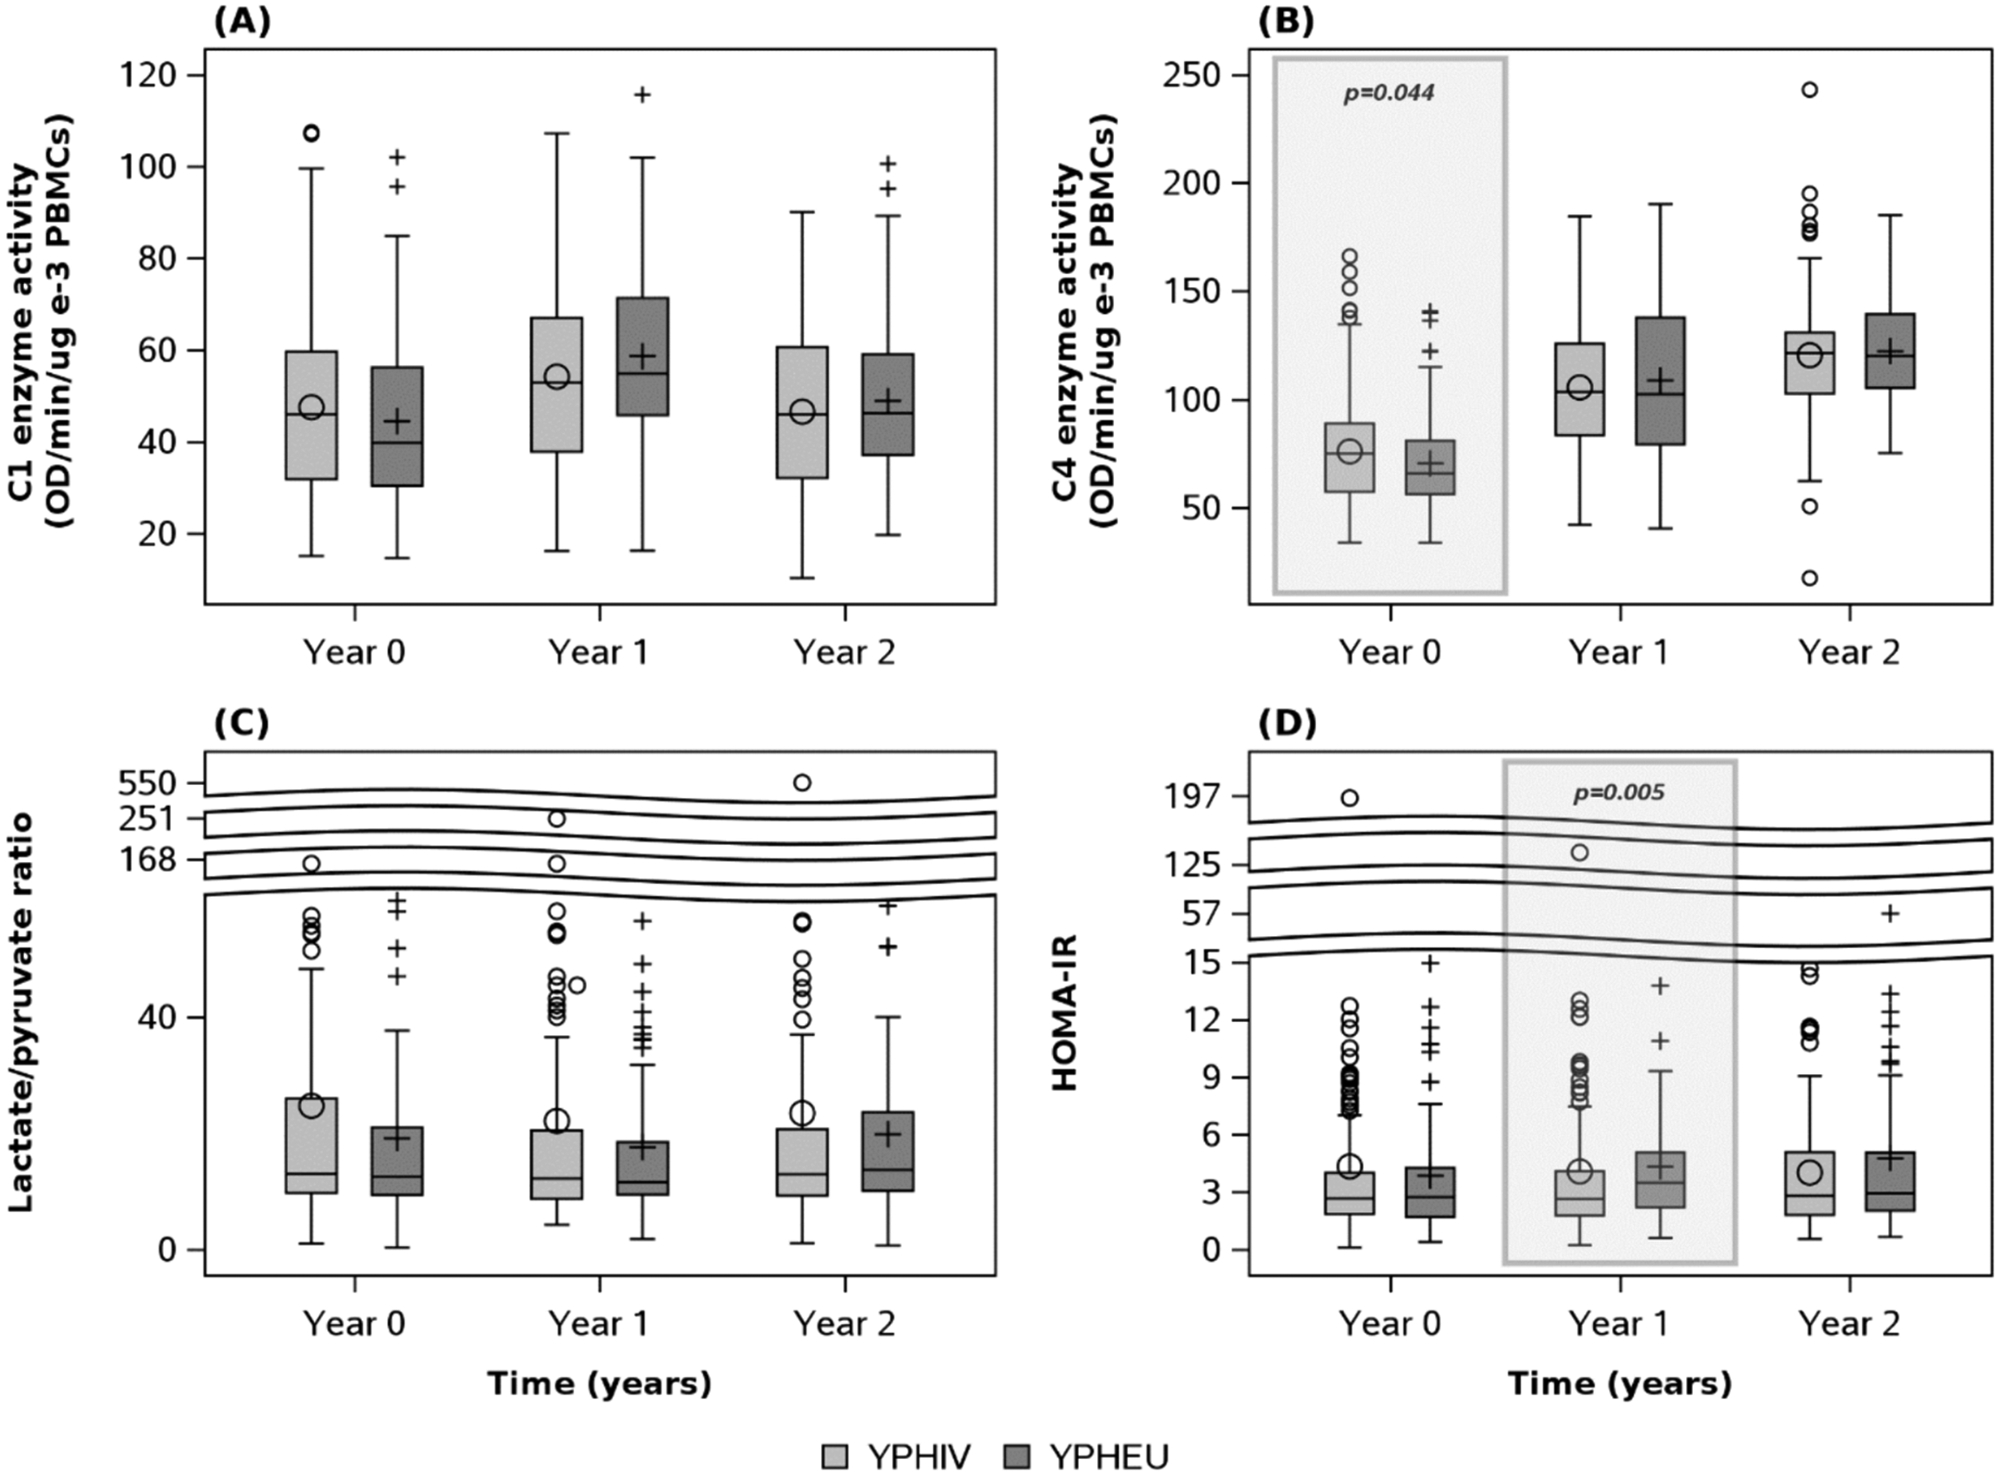
(A) No difference in distributions of C1 activity is observed between groups over time. (B) However, YPHIV display differing distributions of C4 activity at Year 0 compared with YPHEU. (C) No difference in lactate/pyruvate ratio distributions is observed between groups over time. (D) HOMA-IR distribution is significantly different between groups at year 1 only. C1 = Complex 1; C4 = Complex 4; HOMA-IR = homeostatic model assessment for insulin resistance; OD = optical density; PBMC = peripheral blood mononuclear cells; YPHIV = youth living with perinatally-acquired HIV; YPHEU = youth perinatally HIV-exposed but uninfected.
3.4.1. Relationships between PHIV status and MM (C1, C4, and LPR) over time
In adjusted weighted linear mixed-effects models (Tables 6 and 7), YPHIV compared with YPHEU had different trajectories for log10-transformed C1 activity levels [difference in slope = −0.024, 95 % CI (−0.059, 0.011)] and for log10-transformed LPR [−0.049, 95 % CI (−0.101, 0.004)], but not for log10-transformed C4 [−0.015, 95 % CI (−0.036, 0.006)]. Fig. 3 shows the calculated rates of change in mitochondrial C1 and C4 activities, and LPR over time by PHIV status, modeling a participant matching the median or majority characteristics. In Fig. 3(A), YPHIV and YPHEU had similar mean log10-transformed C1 at Year 0. Log10-transformed C1 activity decreased in YPHIV over time, while log10-transformed C1 activity in YPHEU increased over time ending with higher estimated overall activity at Year 2. YPHIV and YPHEU had similar rates of change in log10-transformed C4 activity over time [Fig. 3(B)]. In Fig. 3(C), YPHIV were observed to have higher log10-transformed LPR at Year 0 than YPHEU. However, YPHIV had a negative rate of change in log10-transformed LPR over time, resulting in similar ratios between groups by Year 2.
Table 6.
Estimates from adjusted weighted linear mixed-effects models for the association of PHIV status with each log10-transformed MM over time.
| Outcomes | ||||||
|---|---|---|---|---|---|---|
| Log10 C1 | Log10 C4 | Log10 LPR | ||||
| Parameters | Estimate (95 % CI) | p value | Estimate (95 % CI) | p value | Estimate (95 % CI) | p value |
| Intercept | 1.659 (1.591, 1.727) | <0.001 | 1.851 (1.796, 1.907) | <0.001 | 1.197 (1.029, 1.365) | <0.001 |
| YPHIV vs YPHEU | 0.005 (−0.037, 0.046) | 0.83 | 0.015 (−0.019, 0.048) | 0.39 | 0.107 (0.019, 0.195) | 0.02 |
| Years (since Year 0 visit) | 0.010 (−0.018, 0.038) | 0.48 | 0.116 (0.099, 0.134) | <0.001 | 0.017 (−0.025, 0.060) | 0.42 |
| Years (since Year 0 visit) by PHIV status | −0.024 (−0.059, 0.011) | 0.18 | −0.015 (−0.036, 0.006) | 0.17 | 0.049 (−0.101, 0.004) | 0.07 |
| Numerical years of age at Year 0 visit | 0.001 (−0.003, 0.006) | 0.56 | 0.002 (−0.002, 0.005) | 0.40 | 0.008 (−0.020, 0.004) | 0.19 |
| Female vs male | −0.001 (−0.024, 0.022) | 0.92 | −0.018 (−0.037, 0.002) | 0.07 | 0.031 (−0.029, 0.090) | 0.31 |
| Annual household income (≤$10,000 vs >$10,000) | −0.036 (−0.063, 0.009) | 0.01 | −0.013 (−0.034, 0.008) | 0.22 | 0.041 (−0.020, 0.102) | 0.18 |
| Annual household income (missing vs >$10,000) | 0.004 (−0.111, 0.119) | 0.94 | −0.044 (−0.138, 0.049) | 0.35 | −0.072 (−0.358, 0.214) | 0.62 |
C1 = Complex I; C4 = Complex IV; CI = Confidence Interval; LPR = Lactate/pyruvate ratio; MM = mitochondrial-related measurements; YPHEU = Youth perinatally HIV-exposed but uninfected; YPHIV = Youth living with perinatally-acquired HIV.
Table 7.
From adjusted weighted linear mixed-effects models, estimated mean of MM over time by PHIV status for a participant who was assumed to have characteristics at median or majority: male, age 14.77 years at Year 0, and annual household income >$10,000.
| PHIV status |
Visit | Estimated mean (95 % CI) MM | ||
|---|---|---|---|---|
| C1 | C4 | LPR | ||
| YPHIV | Year 0 | 48.2 (45.4, 51.2) | 77.6 (73.9, 81.4) | 15.4 (13.5, 17.6) |
| Year 1 | 46.8 (44.7, 48.9) | 98.0 (94.5, 101.7) | 14.3 (12.8, 16.1) | |
| Year 2 | 45.3 (42.2, 48.7) | 123.8 (118.3, 129.5) | 13.35 (11.6, 15.3) | |
| YPHEU | Year 0 | 47.7 (43.9, 51.9) | 75.0 (70.1, 80.3) | 12.0 (10.1, 14.4) |
| Year 1 | 48.9 (46.0, 51.9) | 98.1 (93.3, 103.1) | 12.5 (10.8, 14.6) | |
| Year 2 | 50.0 (45.6, 55.0) | 128.2 (120.9, 136.1) | 13.1 (10.9, 15.7) | |
C1 = Complex I; C4 = Complex IV; CI = Confidence Interval; LPR = Lactate/pyruvate ratio; MM = mitochondrial-related measurements; YPHEU = Youth perinatally HIV-exposed but uninfected; YPHIV = Youth living with perinatally-acquired HIV.
Fig. 3. Slopes of MM over time by HIV status.
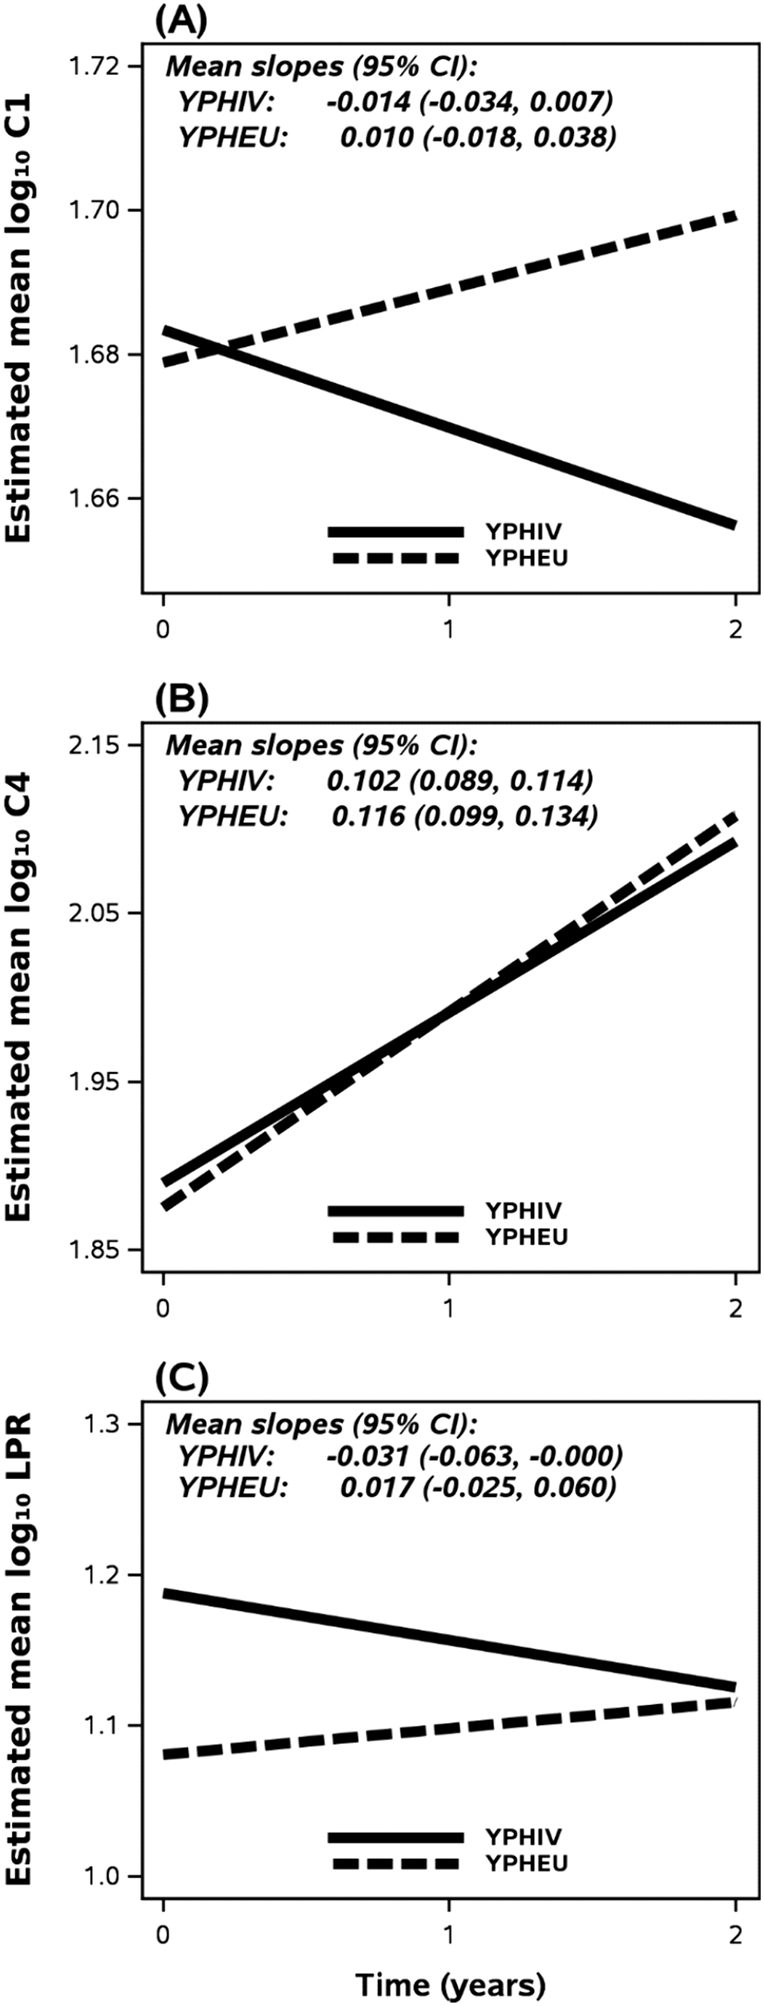
The mean log10 MM at each time point was estimated based on a participant who was assumed to have characteristics at median or majority: male, age 14.77 years at Year 0, and income >$10,000. (A) YPHIV characteristics result in a positive change in C1 activity, while YPHEU meeting these characteristics display a negative slope over time ending with higher estimated overall activity at Year 2. (B) No differences in slope for C4 activity are observed between groups. (C) LPR slopes for a participant from either group display differing directions over time, but models suggest a similar ratio by Year 2. C1 = Complex 1; C4 = Complex 4; CI = Confidence Interval; HOMA-IR = homeostatic model assessment for insulin resistance; LPR = lactate/pyruvate ratio; MM = mitochondrial-related measurements; YPHIV = youth living with perinatally-acquired HIV; YPHEU = youth perinatally HIV-exposed but uninfected.
3.4.2. Relationships between Year 0 MM and changes in HOMA-IR over time
To extend upon observations described previously only within YPHIV (Gojanovich et al., 2020), we assessed whether participants in either group without IR (HOMA-IR < 4 at Year 0, a previously defined cut-off for IR in this pubertal population (Kurtoğlu et al., 2010), displayed alterations to Year 0 C1 activity levels. Here, we observed that YPHEU with HOMA-IR < 4 displayed significantly lower Year 0 log10-transformed C1 activity [median (Q1, Q3); 1.58 (1.46, 1.73)] compared to YPHIV with HOMA-IR < 4 [1.69 (1.50, 1.77); p = 0.019, data not shown].
We then categorized participants by Year 0 C1 activity quartiles and observed that YPHEU with values in the ≤ 25 % quartile showed the highest Year 0 LPR [15.42 (10.00, 19.67)], while YPHIV in the 51–75 % quartile showed the highest LPR [14.61 (9.60, 32.27); data not shown]. YPHIV and YPHEU with Year 0 C4 activity in the 51–75 % quartile had the highest LPR (data not shown).
YPHEU in the highest Year 0 C1 activity quartile displayed the highest Year 0 HOMA-IR [3.12 (2.13, 5.01)], while YPHIV in the 26–50 % quartile of Year 0 C1 displayed the highest Year 0 HOMA-IR [2.99 (2.05, 4.99); data not shown]. YPHEU in the highest quartile for Year 0 C4 activity displayed the highest Year 0 HOMA-IR [3.00 (1.79, 5.06)], while YPHIV in the 26–50 % quartile had the highest HOMA-IR [2.94 (1.76, 3.90); data not shown]. Lastly, YPHEU in the 26–50 % quartile for Year 0 LPR, and YPHIV in the 51–75 % quartile, displayed the highest Year 0 HOMA-IR [3.58 (1.96, 5.14) and 3.10 (1.86, 4.77), respectively].
Combined, these above observations led us to ask whether participants categorized as having either high or low Year 0 levels of MM may be more likely to have greater perturbations in HOMA-IR over time. For example, does a YPHEU participant with a high level of C1 activity at Year 0 display a higher HOMA-IR at Year 2, as compared to a YPHEU participant in the Year 0 intermediate reference category (26–75 %)? Models are shown in Tables 8 and 9.
Table 8. Parameter estimates from adjusted weighted linear mixed-effects models assessing the association of log10-transformed HOMA-IR over time with each Year 0 MM categories, stratified by HIV status.
Based on data at Year 0 for YPHEU, each MM was divided into three categories: 0–25, 26–75 (reference group), and 76–100 %.
| YPHIV | YPHEU | ||||||
|---|---|---|---|---|---|---|---|
| Exposure of Interest | Parameters | N | Estimate (95 % CI) | p value | N | Estimate (95 % CI) | p value |
| Year 0 C1 categories | Intercept | 222 | 0.16 (−0.17, 0.48) | 0.34 | 118 | 0.76 (0.55, 0.97) | <0.001 |
| Year 0 C1 ≤ 25 % | −0.020 (−0.099, 0.059) | 0.62 | −0.15 (−0.23, −0.06) | 0.001 | |||
| Year 0 C1 > 75 % | −0.034 (−0.118, 0.050) | 0.43 | −0.019 (−0.121, 0.083) | 0.71 | |||
| Years since Year 0 | 0.026 (−0.009, 0.060) | 0.15 | −0.002 (−0.052, 0.047) | 0.92 | |||
| Year 0 C1 ≤ 25 % x years since Year 0 | −0.058 (−0.119, 0.003) | 0.064 | 0.086 (0.012, 0.161) | 0.024 | |||
| Year 0 C1 > 75 % x years since Year 0 | −0.008 (−0.064, 0.048) | 0.78 | 0.041 (−0.025, 0.108) | 0.22 | |||
| Age (years) at Year 0 | 0.007 (−0.009, 0.023) | 0.37 | −0.028 (−0.046, −0.011) | 0.002 | |||
| Male vs female | −0.12 (−0.18, −0.06) | <0.001 | −0.058 (−0.120, 0.004) | 0.068 | |||
| Year 0 mid waist circumference Z-score | 0.11 (0.08, 0.14) | <0.001 | 0.16 (0.13, 0.20) | <0.001 | |||
| Year 0 Tanner stage (3–5 vs 1–2) | 0.050 (−0.076, 0.176) | 0.43 | 0.082 (−0.016, 0.180) | 0.100 | |||
| Year 0 household income (≤$10,000 vs >$10,000) | −0.022 (−0.108, 0.064) | 0.62 | −0.050 (−0.105, 0.005) | 0.076 | |||
| Year 0 ARV use (≥3 classes vs non-PI) | 0.032 (−0.063, 0.128) | 0.50 | |||||
| Year 0 ARV use (PI vs non-PI) | −0.043 (−0.117, 0.031) | 0.26 | |||||
| Year 0 ARV use (Not on ARV vs non-PI) | −0.043 (−0.131, 0.044) | 0.33 | |||||
| Year 0 log10 peak HIV RNA | 0.035 (−0.009, 0.080) | 0.12 | |||||
| Year 0 C4 categories | Intercept | 222 | 0.19 (−0.13, 0.51) | 0.25 | 118 | 0.70 (0.46, 0.94) | <0.001 |
| Year 0 C4 ≤ 25 % | −0.032 (−0.105, 0.041) | 0.39 | −0.066 (−0.156, 0.023) | 0.14 | |||
| Year 0 C4 > 75 % | −0.031 (−0.113, 0.051) | 0.46 | −0.003 (−0.116, 0.110) | 0.96 | |||
| Years since Year 0 | 0.018 (−0.023, 0.059) | 0.39 | 0.006 (−0.037, 0.048) | 0.78 | |||
| Year 0 C4 ≤ 25 % x years since Year 0 | −0.019 (−0.078, 0.041) | 0.54 | 0.061 (−0.021, 0.143) | 0.14 | |||
| Year 0 C4 > 75 % x years since Year 0 | −0.010 (−0.067, 0.047) | 0.73 | 0.046 (−0.016, 0.109) | 0.14 | |||
| Age (years) at Year 0 | 0.006 (−0.009, 0.022) | 0.40 | −0.025 (−0.044, −0.006) | 0.010 | |||
| Male vs female | −0.13 (−0.19, −0.07) | <0.001 | −0.061 (−0.122, 0.001) | 0.054 | |||
| Year 0 mid waist circumference Z-score | 0.11 (0.08, 0.14) | <0.001 | 0.17 (0.14, 0.20) | <0.001 | |||
| Year 0 Tanner stage (3–5 vs 1–2) | 0.055 (−0.070, 0.180) | 0.38 | 0.067 (−0.031, 0.164) | 0.18 | |||
| Year 0 household income (≤$10,000 vs >$10,000) | −0.024 (−0.109, 0.061) | 0.58 | −0.048 (−0.107, 0.011) | 0.11 | |||
| Year 0 ARV use (≥3 classes vs non-PI) | 0.033 (−0.063, 0.128) | 0.50 | |||||
| Year 0 ARV use (PI vs non-PI) | −0.042 (−0.116, 0.033) | 0.27 | |||||
| Year 0 ARV use (Not on ARV vs non-PI) | −0.066 (−0.153, 0.021) | 0.13 | |||||
| Year 0 log10 peak HIV RNA | 0.033 (−0.011, 0.077) | 0.14 | |||||
| Year 0 LPR categories | Intercept | 220 | 0.17 (−0.16, 0.51) | 0.31 | 116 | 0.63 (0.40, 0.86) | <0.001 |
| Year 0 LPR ≤ 25 % | −0.057 (−0.135, 0.021) | 0.15 | −0.016 (−0.129, 0.097) | 0.77 | |||
| Year 0 LPR > 75 % | −0.055 (−0.140, 0.029) | 0.20 | 0.068 (−0.023, 0.159) | 0.14 | |||
| Years since Year 0 | 0.023 (−0.011, 0.058) | 0.18 | 0.022 (−0.032, 0.077) | 0.42 | |||
| Year 0 LPR ≤ 25 % x years since Year 0 | −0.014 (−0.077, 0.049) | 0.65 | 0.008 (−0.062, 0.079) | 0.81 | |||
| Year 0 LPR > 75 % x years since Year 0 | 0.005 (−0.053, 0.064) | 0.86 | −0.016 (−0.085, 0.052) | 0.64 | |||
| Age (years) at Year 0 | 0.008 (−0.008, 0.023) | 0.33 | −0.023 (−0.042, −0.003) | 0.022 | |||
| Male vs female | −0.13 (−0.19, −0.07) | <0.001 | −0.034 (−0.103, 0.035) | 0.33 | |||
| Year 0 mid waist circumference Z-score | 0.11 (0.08, 0.15) | <0.001 | 0.17 (0.14, 0.20) | <0.001 | |||
| Year 0 Tanner stage (3–5 vs 1–2) | 0.057 (−0.070, 0.183) | 0.38 | 0.067 (−0.033, 0.166) | 0.19 | |||
| Year 0 household income (≤$10,000 vs >$10,000) | 0.041 (−0.130, 0.047) | 0.36 | −0.046 (−0.102, 0.011) | 0.11 | |||
| Year 0 ARV use (≥3 classes vs non-PI) | 0.050 (−0.042, 0.142) | 0.28 | |||||
| Year 0 ARV use (PI vs non-PI) | −0.018 (−0.093, 0.057) | 0.63 | |||||
| Year 0 ARV use (Not on ARV vs non-PI) | −0.055 (−0.145, 0.035) | 0.23 | |||||
| Year 0 log10 peak HIV RNA | 0.031 (−0.014, 0.076) | 0.18 | |||||
C1 = Complex I; C4 = Complex IV; CI = Confidence Interval; HOMA-IR = Homeostatic model assessment of insulin resistance; LPR = Lactate/pyruvate ratio; MM = mitochondrial-related measurements; YPHEU = Youth perinatally HIV-exposed but uninfected; YPHIV = Youth living with perinatally-acquired HIV.
Table 9. Mean HOMA-IR estimated for each visit year from adjusted weighted linear mixed effects models assessing the association of log10-transformed HOMA-IR over time with each Year 0 MM categories, stratified by HIV status.
Based on data at Year 0 for YPHEU, the MM were categorized into three categories: 0–25, 26–75 (reference group), and 76–100 %. Mean HOMA-IR at each time point was estimated based on a participant who was assumed to have characteristics at median or majority: Male, age 14.77 years at Year 0, Tanner stage 3–5, and have a MWC Z-score of 0.45 For YPHIV, we additionally assumed that the participant was using a PI-based cART regimen and had a log10 peak HIV RNA of 5.51.
| Mean HOMA-IR (95 % CI) | |||||||
|---|---|---|---|---|---|---|---|
| C1 | C4 | LPR | |||||
| Year 0 category | Visit | YPHIV | YPHEU | YPHIV | YPHEU | YPHIV | YPHEU |
| ≤25 % | 0 | 2.36 (1.97, 2.83) | 1.98 (1.65, 2.36) | 2.32 (1.97, 2.73) | 2.22 (1.84, 2.69) | 2.28 (1.89, 2.74) | 2.45 (1.86, 3.21) |
| 1 | 2.20 (1.85, 2.60) | 2.40 (2.03, 2.83) | 2.32 (1.94, 2.78) | 2.59 (2.26, 2.97) | 2.33 (1.92, 2.81) | 2.62 (2.07, 3.33) | |
| 2 | 2.04 (1.63, 2.56) | 2.91 (2.29, 3.69) | 2.32 (1.82, 2.95) | 3.02 (2.39, 3.81) | 2.38 (1.83, 3.08) | 2.82 (2.20, 3.61) | |
| 26–75 % | 0 | 2.48 (2.05, 2.98) | 2.76 (2.35, 3.25) | 2.50 (2.07, 3.02) | 2.59 (2.19, 3.06) | 2.60 (2.19, 3.09) | 2.54 (2.16, 2.98) |
| 1 | 2.63 (2.18, 3.17) | 2.75 (2.38, 3.16) | 2.61 (2.17, 3.12) | 2.62 (2.25, 3.05) | 2.74 (2.34, 3.21) | 2.67 (2.30, 3.10) | |
| 2 | 2.78 (2.23, 3.47) | 2.73 (2.24, 3.33) | 2.72 (2.18, 3.38) | 2.66 (2.19, 3.23) | 2.89 (2.42, 3.47) | 2.81 (2.25, 3.52) | |
| >75 % | 0 | 2.29 (1.91, 2.74) | 2.64 (2.06, 3.39) | 2.33 (1.94, 2.80) | 2.57 (1.99, 3.32) | 2.29 (1.86, 2.82) | 2.97 (2.40, 3.67) |
| 1 | 2.38 (2.03, 2.81) | 2.89 (2.32, 3.60) | 2.37 (2.00, 2.82) | 2.90 (2.30, 3.66) | 2.44 (1.98, 3.01) | 3.01 (2.50, 3.62) | |
| 2 | 2.48 (2.02, 3.05) | 3.16 (2.50, 4.00) | 2.42 (1.97, 2.98) | 3.27 (2.54, 4.22) | 2.61 (2.01, 3.39) | 3.05 (2.49, 3.74) | |
C1 = Complex I; C4 = Complex IV; CI = Confidence Interval; HOMA-IR = Homeostatic model assessment of insulin resistance; LPR = Lactate/pyruvate ratio; MM = mitochondrial-related measurements; YPHEU = Youth perinatally HIV-exposed but uninfected; YPHIV = Youth living with perinatally-acquired HIV.
YPHIV with Year 0 C1 activity in the lowest quartile had reduced log10-transformed HOMA-IR over time, while all other categories across groups tended to increase in log10-transformed HOMA-IR over time, Fig. 4. Furthermore, YPHEU in the lowest Year 0 C1 quartile showed the greatest rate of change in HOMA-IR, with no change in the reference category. Lastly, our model suggests that YPHEU within the highest Year 0 C1 category displayed HOMA-IR, on average, above the reference category by Year 2.
Fig. 4. Estimated mean log10-transformed HOMA-IR over time as calculated by final adjusted models with inverse probability censoring weights of MM of interest.
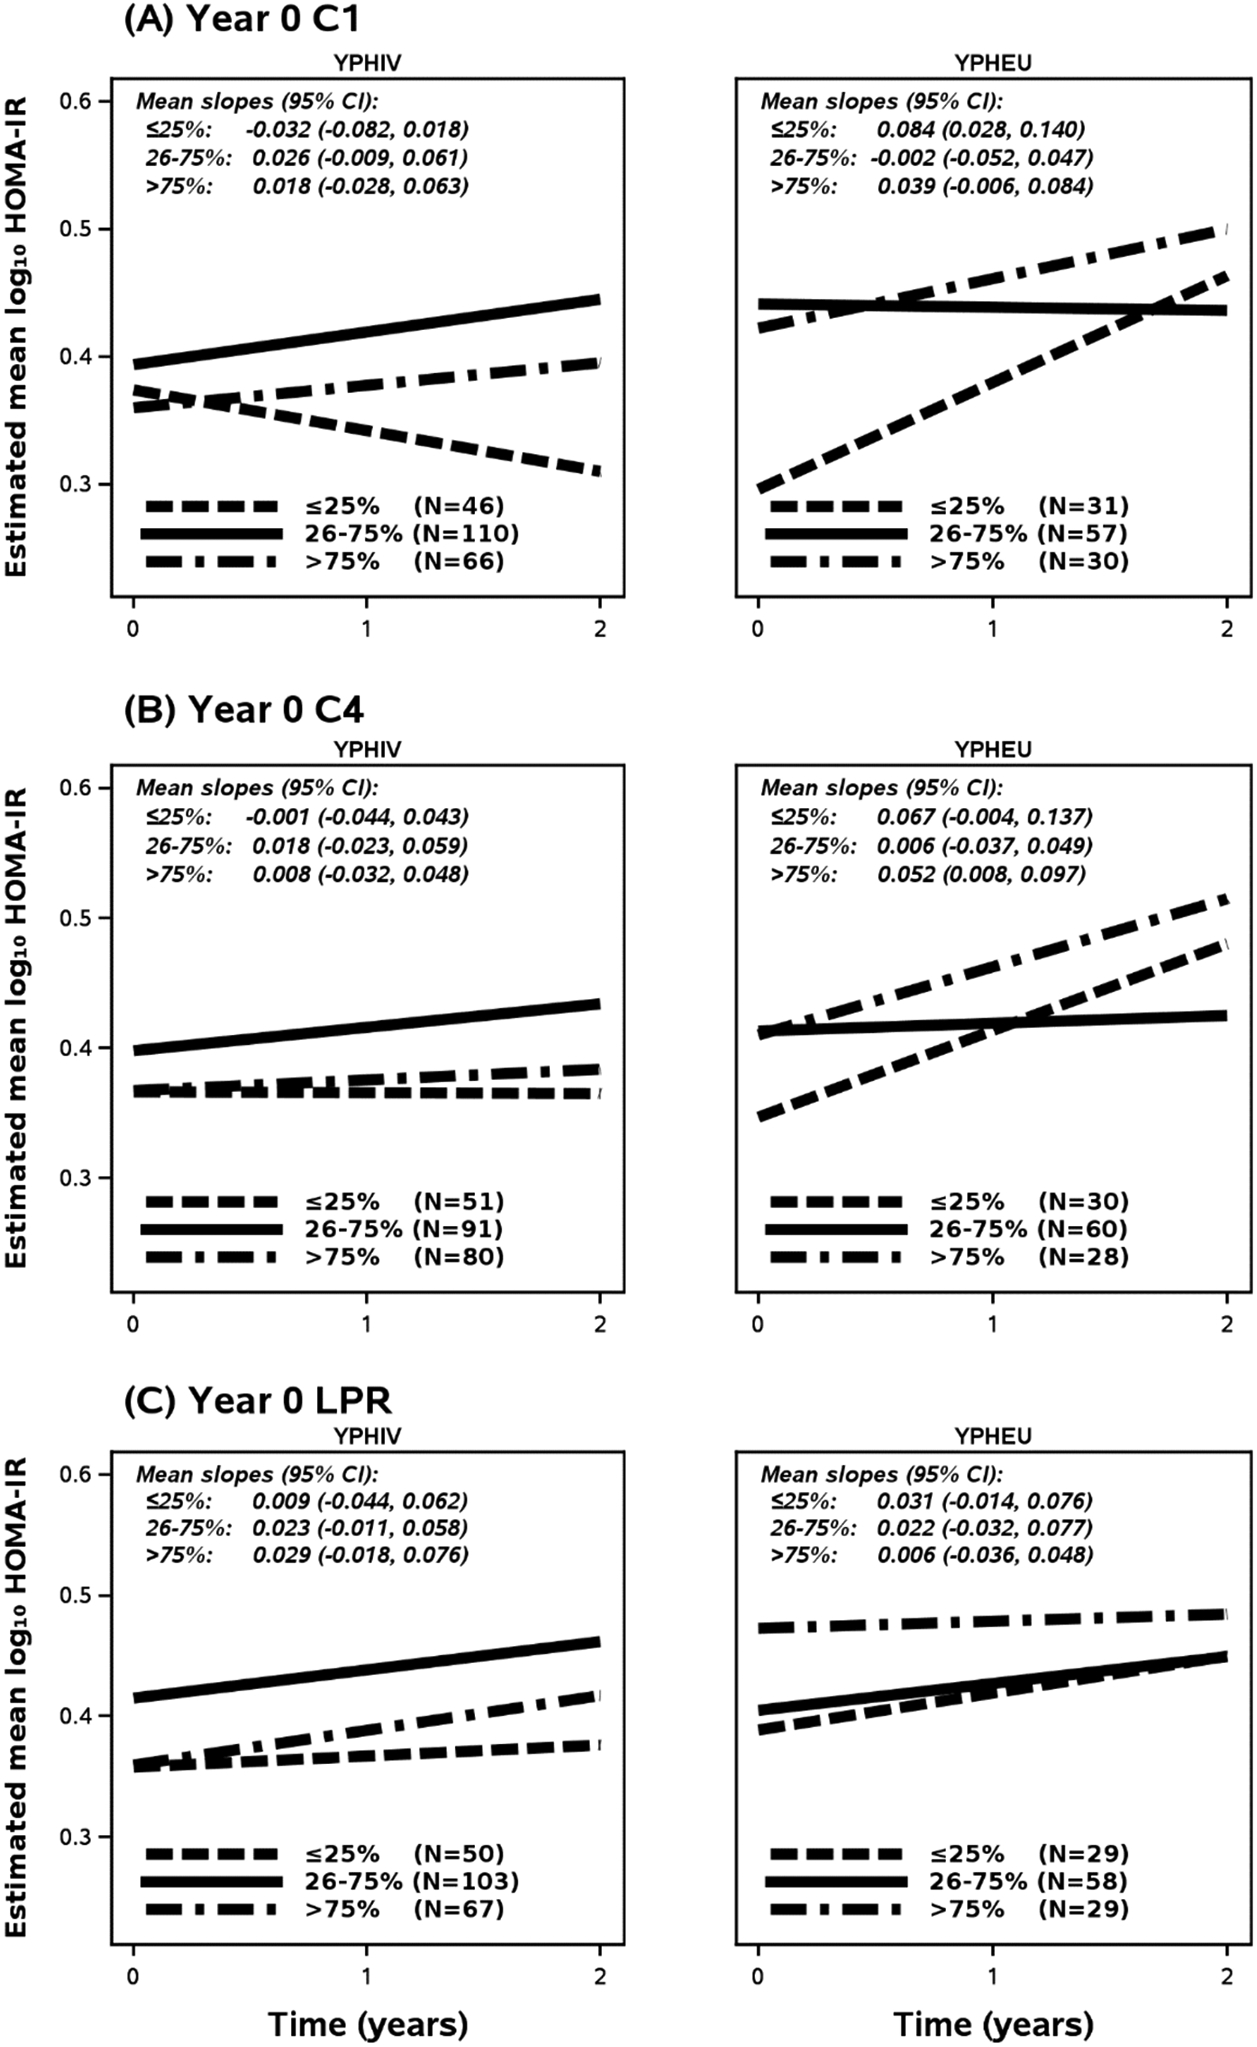
Categorical quartiles for each MM at Year 0 were determined using data from YPHEU group and the 26th-75th percentile category was set as the reference. The mean log10-transformed HOMA-IR at each time point was estimated based on a participant who was assumed to have characteristics at median or majority: Male, age 14.77 years at Year 0, Tanner stage 3–5, income >$10,000, and have a MWCZ of 0.45 For YPHIV, we additionally assumed that the participant was using a PI-based cART regimen and had a log10 peak HIV RNA of 5.51. (A) For YPHIV, models indicate increases in log10-transformed HOMA-IR for the reference category and the upper quartile populations of C1 activity. However, YPHIV in the lowest quartile for C1 activity levels are more likely to present reduced HOMA-IR over time. Among YPHEU, increases in log10-transformed HOMA-IR are observed for those in the lowest and highest quartiles, but are stagnant over time for the reference category. (B) Models for the effects of Year 0 C4 upon HOMA-IR over time indicate similar trends across groups, but greater slopes for YPHEU in the highest and lowest categories resulting in higher HOMA-IR at Year 2 compared to YPHIV. C1 = Complex 1; C4 = Complex 4; CI = Confidence Interval; HOMA-IR = homeostatic model assessment for insulin resistance; LPR = lactate/pyruvate ratio; MM = mitochondrial-related measurements; YPHIV = youth living with perinatally-acquired HIV; YPHEU = youth perinatally HIV-exposed but uninfected.
In Fig. 4(B), Year 0 C4 categorization showed a similar trend to what was observed for C1 categories. Across YPHIV categories, rates of change were not different, but those in the lowest and highest Year 0 C4 quartiles resulted in having lower HOMA-IR over Year 0 through Year 2 as compared with the reference category. YPHEU in the lowest and highest Year 0 C4 activities displayed HOMA-IR rates of change above the reference category, again resulting in higher log10 HOMA-IR at Year 2. In Fig. 4(C), no differences in rate of change were observed across the YPHIV Year 0 LPR categories, but the lowest and highest categories again displayed lower log10-transformed HOMA-IR over Year 0 through Year 2. YPHEU in the highest Year 0 LPR category showed no change in log10-transformed HOMA-IR, and by Year 2 the other categories eventually matched the high log10-transformed HOMA-IR observed at Year 0 for this highest LPR category. These findings are similar when inverse probability censoring weights of MM of interest are restricted to those at Tanner stage 3–5 (See Supplementary Fig. 2).
3.4.3. Relationships between changes in MM and changes in HOMA-IR over time
Generally, we did not observe associations between change in MM over time and HOMA-IR in either group after adjusting for sex, Tanner stage, MWCZ, income, and YPHIV-specific metrics at Year 0 (Table 10). Yet, modest effects were observed for change from Year 0 to 1 log10-transformed C4 activity on Year 1 log10-transformed HOMA-IR [estimate: 0.24, 95 % CI (−0.04, 0.53)], and for change in Year 0 to 1 log10-transformed HOMA-IR [0.22, 95 %CI (−0.26, 0.69)], but only in the YPHEU group.
Table 10. Adjusted GEE linear regression models to assess the relationship of change in MM with log10-transformed HOMA-IR at Year 1, Year 2, and change from Year 1 to Year 2, stratified by HIV status.
For calculating change in log10-transformed MM, log10-transformed MM at Year 1 visit was measured between 8 and 16 months from Year 0 MM, while log10 MM at Year 2 visit was measured between 20 and 28 months from Year 0 visit. Log10-transformed HOMA-IR at Year 1 visit was a HOMA-IR measured within 3 months of Year 1 MM, while log10-transformed HOMA-IR at Year 2 was a HOMA-IR measured either within 3 months of Year 2 MM or within 1 year (+/3 months) of Year 1 MM. Models for YPHEU were adjusted for age (years) at Year 0, sex (male vs female), mid-waist circumference Z-score, Tanner stage (3–5 vs 1–2), and household income level (≤$10,000 vs >$10,000) at Year 0. Models for YPHIV were additionally adjusted for ARV use (≥3 classes, PI-based, not on ARV vs non-PI-based) and log10-transformed peak VL at Year 0.
| YPHIV | YPHEU | ||||||
|---|---|---|---|---|---|---|---|
| Outcome | Exposure | N | Estimate (95 % CI) |
p
value |
N | Estimate (95 % CI) |
p
value |
| Year 1 log10-transformed HOMA-IR | Change in log10 C1 from Year 0 to Year 1 | 159 | 0.055 (−0.148, 0.259) | 0.59 | 87 | 0.065 (−0.146, 0.276) | 0.55 |
| Change in log10 C4 from Year 0 to Year 1 | 159 | −0.019 (−0.255, 0.217) | 0.88 | 87 | 0.24 (−0.04, 0.53) | 0.10 | |
| Change in log10 LPR from Year 0 to Year 1 | 148 | −0.051 (−0.185, 0.083) | 0.45 | 85 | −0.052 (−0.170, 0.065) | 0.38 | |
| Year 2 log10-transformed HOMA-IR | Change in log10 C1 from Year 0 to Year 2 | 92 | −0.050 (−0.232, 0.132) | 0.59 | 74 | 0.012 (−0.191, 0.215) | 0.91 |
| Change in log10 C4 from Year 0 to Year 2 | 93 | −0.070 (−0.450, 0.310) | 0.72 | 74 | −0.026 (−0.403, 0.350) | 0.89 | |
| Change in log10 LPR from Year 0 to Year 2 | 81 | 0.036 (−0.096, 0.168) | 0.59 | 66 | 0.10 (−0.04, 0.25) | 0.16 | |
| Change in log10-transformed HOMA-IR from year 0 to year 1 | Change in log10 C1 from Year 0 to Year 1 | 159 | −0.016 (−0.244, 0.212) | 0.89 | 87 | 0.038 (−0.190, 0.266) | 0.74 |
| Change in log10 C4 from Year 0 to Year 1 | 159 | −0.024 (−0.295, 0.247) | 0.86 | 87 | 0.024 (−0.418, 0.466) | 0.91 | |
| Change in log10 LPR from Year 0 to Year 1 | 148 | 0.054 (−0.052, 0.160) | 0.32 | 85 | −0.016 (−0.199, 0.168) | 0.87 | |
| Change in log10-transformed HOMA-IR from year 1 to year 2 | Change in log10 C1 from Year 0 to Year 1 | 100 | −0.004 (−0.239, 0.231) | 0.97 | 73 | −0.041 (−0.287, 0.205) | 0.74 |
| Change in log10 C4 from Year 0 to Year 1 | 100 | −0.13 (−0.52, 0.26) | 0.51 | 73 | 0.22 (−0.26, 0.69) | 0.38 | |
| Change in log10 LPR from Year 0 to Year 1 | 93 | −0.028 (−0.311, 0.256) | 0.85 | 67 | −0.000 (−0.258, 0.256) | 0.99 | |
C1 = Complex I; C4 = Complex IV; CI = Confidence Interval; LPR = Lactate/pyruvate ratio; MM = mitochondrial-related measurements; YPHEU = Youth perinatally HIV-exposed but uninfected; YPHIV = Youth living with perinatally-acquired HIV.
4. CONCLUSIONS
To our knowledge, this is the first study to assess relationships between changes in MM with changes in HOMA-IR over time in YPHIV and YPHEU. In our US cohort, we observed differences in mitochondrial function and IR over time when we compared YPHIV vs YPHEU. However, during short-term follow-up, trajectories of MM were not predictive of subsequent changes in insulin sensitivity.
Our past cross-sectional work with this cohort of YPHIV and YPHEU led us to hypothesize that YPHIV would be more likely to display greater changes in C1 and C4 activity, and LPR, over time (Miller et al., 2012; Geffner et al., 2018; Gojanovich et al., 2020; Jao et al., 2021). Our results herein corroborate our hypothesis that PHIV status alters the rate of change in mitochondrial activity and LPR over time, but the directionality was somewhat surprising, in that C1 activity was reduced over time in YPHIV, as was LPR (Fig. 3). Furthermore, by Year 2, the YPHEU group matched the YPHIV group’s estimated means of C4 activity and LPR.
We next attempted to dissect the effects of mitochondrial perturbations on HOMA-IR over time within each cohort. Our models highlight that YPHIV in the lowest Year 0 C1 quartile was the only group assessed that showed a lower HOMA-IR at the end of the study. Changes in C1 activity from Year 0 to Year 1 were not associated with changes in HOMA-IR at Year 1 or 2 in adjusted models, for either group. However, our adjusted GEE linear regression model (Table 10) indicates very modest effects of change from Year 0 to 1 log10-transformed C4 activity on Year 1 log10-transformed HOMA-IR, and on change in Year 0 to 1 log10-transformed HOMA-IR, but only in the YPHEU group. Thus, our hypothesis of perturbed mitochondrial function impacting future IR was corroborated only in the YPHEU, wherein YPHEU in the lowest and highest Year 0 quartiles for C1 and C4 activities displayed the highest estimated mean log10-transformed HOMA-IR at Year 2 (Fig. 4). Together, these data indicate to us that MM outside of the “normal” ranges (26th-75th percentiles based on YPHEU values) at the study start impacted future HOMA-IR differently based on PHIV status, and that changes in MM over the study duration impacted later HOMA-IR changes differently based on PHIV status.
Broadly, these observations suggest that longer durations of followup are needed to assess the consistency of these trends into adulthood, and the impact that they may ultimately have upon metabolic derangements, such as reduced insulin sensitivity, and its attendant health consequences. Our study would have been strengthened by including participants who were age– and sex-matched HIV-unexposed and –uninfected to assess trends across the broader peri-pubertal population in the US. As in past studies, the standard confounders of morphometries, such as MWCZ, Tanner stage, age, and HIV disease severity, such as CD4 counts and HIV RNA loads, were observed to impact our models and should be closely monitored in future work. Additionally, the inflammatory status of the individuals should be evaluated in future studies since this can impact mitochondrial function. Our study was strengthened by using a central laboratory for clinical analyte measures and a single laboratory for the assessment of MM. Studies have suggested that blood-cell OXPHOS activity and ATP levels may correlate with those in adipose tissue (Shikuma et al., 2008; Gojanovich et al., 2019) (the proposed site of underlying metabolic disruption linked to IR) and correlate with HIV disease severity and inflammation (Gangcuangco et al., 2020); however, inaccessibility of important insulin-sensitive tissues, such as muscle and liver, is another limitation. Furthermore, using more sensitive methodologies, such as Seahorse real-time cellular metabolic assays, to assess blood-cell oxidative function may allow for a more accurate reflection of mitochondrial efficiency, and elucidation of its relationship with metabolic derangement (Avram et al., 2022). Lastly, as with any longitudinal study, participant retention was a limiting factor, which we attempted to address by using inverse probability censoring weights, but which highlights the need for larger cohorts to be enrolled in these types of studies.
In summary, there are no clear systematic differences in any of the MM or HOMA-IR between the two groups. Changes over time in these measures are very limited, but this is to be expected with only a 2 year follow-up interval. CIV activity increased over time in both groups. Relationships between mitochondrial function and insulin sensitivity remain complex and may be influenced by both perinatal HIV infection as well as perinatal HIV exposure without infection, as well as ART regimens used to prevent HIV transmission. Long-term follow-up of metabolic outcomes in youth living with perinatal HIV infection or exposure is necessary to further elucidate pathways of potential metabolic perturbations, including mitochondrial derangements.
Supplementary Material
Acknowledgements
We would like to thank Dr. Tracie L. Miller (deceased) for her contribution to NR012885 as Multi-Principal Investigator with Dr. Gerschenson. We thank the participants and families for their participation in PHACS, and the individuals and institutions involved in the conduct of PHACS. The Pediatric HIV/AIDS Cohort Study (PHACS) network was supported by the Eunice Kennedy Shriver National Institute of Child Health & Human Development (NICHD), Office of The Director, National Institutes of Health (OD), National Institute of Dental & Craniofacial Research (NIDCR), National Institute of Allergy and Infectious Diseases (NIAID), National Institute of Neurological Disorders and Stroke (NINDS), National Institute on Deafness and Other Communication Disorders (NIDCD), National Institute of Mental Health (NIMH), National Institute on Drug Abuse (NIDA), National Cancer Institute (NCI), National Institute on Alcohol Abuse and Alcoholism (NIAAA), and the National Heart, Lung, and Blood Institute (NHLBI) through grants to the Harvard T.H. Chan School of Public Health (P01HD103133, Principal Investigators: Ellen Chadwick, Sonia Hernandez-Diaz, Jennifer Jao, Paige Williams; Program Director: Liz Salomon and HD052102: Principal Investigator: George R Seage III; Program Director: Liz Salomon) and with Tulane University School of Medicine (HD052104) (Principal Investigator: Russell Van Dyke; Co-Principal Investigator: Ellen Chadwick; Project Director: Patrick Davis). Data management services were provided by Frontier Science (Data Management Center Director: Suzanne Siminski), and regulatory services and logistical support were provided by Westat, Inc (Project Director: Tracy Wolbach).
The following institutions, clinical site investigators and staff participated in conducting PHACS AMP and AMP Up in 2022, in alphabetical order: Ann & Robert H. Lurie Children’s Hospital of Chicago: Ellen Chadwick, Emanuela (Lela) Lartey, Rohit Kalra, Kathleen Malee; Baylor College of Medicine: Mary Paul, Shelley Buschur, Chivon McMullen-Jackson, Lynnette Harris; BronxCare Health System: Murli Purswani, Martha Cavallo, Mahboobullah Mirza Baig, Alma Villegas; Children’s Diagnostic & Treatment Center: Lisa-Gaye Robinson, Alan Bernegger, Patricia Garvie; Boston Children’s Hospital: Sandra K. Burchett, Michelle E. Anderson, Christine M. Salois; Jacobi Medical Center: Andrew Wiznia, Marlene Burey, Ray Shaw; Rutgers - New Jersey Medical School: Arry Dieudonne, Juliette Johnson, Karen Surowiec; St. Christopher’s Hospital for Children: Janet S. Chen, Taesha White, Mitzie Grant; St. Jude Children’s Research Hospital: Katherine Knapp, Erick Odero, Megan Wilkins; San Juan Hospital Research Unit/Department of Pediatrics, San Juan Puerto Rico: Nicolas Rosario, Heida Rios, Vivian Olivera; Tulane University School of Medicine: Margarita Silio, Medea Gabriel, Patricia Sirois; University of California, San Diego: Stephen A. Spector, Megan Loughran, Veronica Figueroa, Sharon Nichols; University of Colorado Denver Health Sciences Center: Elizabeth McFarland, Carrie Chambers, Christine Kwon, Robin McEnvoy; University of Miami: Gwendolyn Scott, Grace Alvarez, Juan Caffroni, Anai Cuadra.
Data will be made available upon request to the PHACS Network at https://phacsstudy.org/Our-Research/Data-Request-Form for data requests
Funding statement
This work was supported by the University of Hawaii and the US Department of Health and Human Services, National Institutes of Health grants: NIH R01NR012885 (MG), P20GM113134 (MG), and U54MD007584 [Hedges, J and Mokuau, N (PI)]. The funders had no role in study design, data collection and analysis, decision to publish, or preparation of the manuscript.
The Pediatric HIV/AIDS Cohort Study (PHACS) network was supported by the Eunice Kennedy Shriver National Institute of Child Health & Human Development (NICHD), Office of The Director, National Institutes of Health (OD), National Institute of Dental & Craniofacial Research (NIDCR), National Institute of Allergy and Infectious Diseases (NIAID), National Institute of Neurological Disorders and Stroke (NINDS), National Institute on Deafness and Other Communication Disorders (NIDCD), National Institute of Mental Health (NIMH), National Institute on Drug Abuse (NIDA), National Cancer Institute (NCI), National Institute on Alcohol Abuse and Alcoholism (NIAAA), and the National Heart, Lung, and Blood Institute (NHLBI) through grants to the Harvard T.H. Chan School of Public Health (P01HD103133 and HD052102) and with Tulane University School of Medicine (HD052104).
Note: The conclusions and opinions expressed in this article are those of the authors and do not necessarily reflect those of the National Institutes of Health or US Department of Health and Human Services.
Footnotes
Conflict of interest statements:
Dr. Gojanovich is now an employee of Asklepios BioPharmaceuticals, Inc. Dr. Geffner has a research contract and is the site principal investigator for a clinical trial with Novo Nordisk; is a sub-investigator for clinical trials with Adrenas, Diurnal, Neurocrine Biosciences, and Spruce Biosciences; is a member of advisory boards for Adrenas, Eton Pharmaceuticals, Neurocrine Biosciences, Novo Nordisk, and Pfizer; is a consultant to Spruce Biosciences; is a clinical trial adjudicator for Aeterna Zentaris; and receives royalties from McGraw-Hill and UpTo-Date. Dr. Jao reports grants from National Institutes of Health, during the conduct of the study. Dr. Gerschenson reports grants or subawards from NIH, US DHHS, NICHD, NINDS, NIAID, NIAAA, NCI, NHLBI, Harvard TH Chan School of Public Health, Tulane University School of Medicine, during the conduct of the study.
Credit authorship contribution statement
Greg S. Gojanovich: Investigation, Writing – original draft, Writing – review & editing. Wendy Yu: Data curation, Formal analysis, Visualization, Writing – review & editing. Zhongli J. Zhang: Data curation, Formal analysis, Visualization, Writing – review & editing. Denise L. Jacobson: Data curation, Formal analysis, Visualization, Writing – review & editing. Tzy-Jyun Yao: Data curation, Formal analysis, Visualization, Writing – review & editing. Jennifer Jao: Resources, Writing – review & editing. Daniel E. Libutti: Investigation, Supervision. Mitchell E. Geffner: Resources, Writing – review & editing. Mariana Gerschenson: Conceptualization, Funding acquisition, Project administration, Writing – review & editing.
Declaration of competing interest
The authors declare that they have no known competing financial interests or personal relationships that could have appeared to influence the work reported in this paper.
Appendix A. Supplementary data
Supplementary data to this article can be found online at https://doi.org/10.1016/j.mito.2024.101936.
References
- ACTG/IMPAACT Laboratory Resources [Internet]. HANC. [cited 2023 Jan 14]. Available from: https://www.hanc.info//resources/sops-guidelines-resources/laboratory/actg-impaact-laboratory-resources.html. [Google Scholar]
- Avram VF, Merce AP, Hâncu IM, et al. , 2022. Impairment of mitochondrial respiration in metabolic diseases: an overview. Int. J. Mol. Sci 23 (16), 8852. [DOI] [PMC free article] [PubMed] [Google Scholar]
- Ben-Hamouda N, Haesler L, Liaudet L, 2013. Hyperlactatemia and lactic acidosis in the critically ill patient. Rev. Med. Suisse 9 (410), 2335–2340. [PubMed] [Google Scholar]
- Cheney L, Hou JC, Morrison S, Pessin J, Steigbigel RT, 2011. Nef inhibits glucose uptake in adipocytes and contributes to insulin resistance in human immunodeficiency virus type I infection. J Infect Dis 203 (12), 1824–1831. [DOI] [PMC free article] [PubMed] [Google Scholar]
- Crain MJ, Chernoff MC, Oleske JM, et al. , 2010. Possible mitochondrial dysfunction and its association with antiretroviral therapy use in children perinatally infected with HIV. J Infect Dis 202 (2), 291–301. [DOI] [PMC free article] [PubMed] [Google Scholar]
- Dagan T, Sable C, Bray J, Gerschenson M, 2002. Mitochondrial dysfunction and antiretroviral nucleoside analog toxicities: what is the evidence? Mitochondrion 1 (5), 397–412. [DOI] [PubMed] [Google Scholar]
- Fex M, Nicholas LM, Vishnu N, et al. , 2018. The pathogenetic role of β-cell mitochondria in type 2 diabetes. J. Endocrinol 236 (3), R145–R159. [DOI] [PubMed] [Google Scholar]
- Long-Term Follow-Up of Infants Exposed to Antiretroviral Drugs ∣ NIH [Internet], [cited 2022 Jul 24]. Available from: https://clinicalinfo.hiv.gov/en/guidelines/perinatal/long-term-follow-infants-exposed-antiretroviral-drugs.
- Gangcuangco LMA, Mitchell BI, Siriwardhana C, et al. , 2020. Mitochondrial oxidative phosphorylation in peripheral blood mononudear cells is decreased in chronic HIV and correlates with immune dysregulation. PLOS ONE. Public Libr. Sci 15 (4), e0231761. [DOI] [PMC free article] [PubMed] [Google Scholar]
- Geffner ME, Patel K, Jacobson DL, et al. , 2018. Changes in insulin sensitivity over time and associated factors in HIV-infected adolescents. AIDS Lond Engl. 32 (5), 613–622. [DOI] [PMC free article] [PubMed] [Google Scholar]
- Gojanovich GS, Shikuma C, Milne C, LiButti DE, Chow D, Gerschenson M, 2019. Subcutaneous adipocyte adenosine triphosphate levels in HIV infected patients. AIDS Res Hum Retroviruses [Internet]. Available from: https://www.liebertpub.com/doi/10.1089/AID.2019.0121. [DOI] [PMC free article] [PubMed] [Google Scholar]
- Gojanovich GS, Jacobson DL, Jao J, et al. , 2020. Mitochondrial dysfunction and insulin resistance in pubertal youth living with perinatally acquired HIV. AIDS Res. Hum. Retroviruses 36 (9), 703–711. [DOI] [PMC free article] [PubMed] [Google Scholar]
- Jacobson DL, Patel K, Siberry GK, et al. , 2011. Body fat distribution in perinatally HIV-infected and HIV-exposed but uninfected children in the era of highly active antiretroviral therapy: outcomes from the Pediatric HIV/AIDS Cohort Study. Am. J. Clin. Nutr 94 (6), 1485–1495. [DOI] [PMC free article] [PubMed] [Google Scholar]
- Jao J, Jacobson DL, Russell JS, et al. , 2021. Perinatally acquired HIV infection is associated with abnormal blood mitochondrial function during childhood/adolescence. AIDS Lond Engl. 35 (9), 1385–1394. [DOI] [PMC free article] [PubMed] [Google Scholar]
- Kuczmarski RJ, Ogden CL, Grummer-Strawn LM, et al. , 2000. CDC growth charts: United States. Adv. Data 314, 1–27. [PubMed] [Google Scholar]
- Kurtoğlu S, Hatipoğlu N, Mazıcıoğlu M, Kendirici M, Keskin M, Kondolot M, 2010. Insulin resistance in obese children and adolescents: HOMA–IR cut–off levels in the prepubertal and pubertal periods. J. Clin. Res. Pediatr. Endocrinol 2 (3), 100–106. [DOI] [PMC free article] [PubMed] [Google Scholar]
- Lecoeur H, Borgne-Sanchez A, Chaloin O, et al. , 2012. HIV-1 Tat protein directly induces mitochondrial membrane permeabilization and inactivates cytochrome c oxidase. Cell Death Dis. 3 (3), e282. [DOI] [PMC free article] [PubMed] [Google Scholar]
- Martínez-Reyes I, Chandel NS, 2020. Mitochondrial TCA cycle metabolites control physiology and disease. Nat Commun. Nature Publishing Group; 11 (1), 102. [DOI] [PMC free article] [PubMed] [Google Scholar]
- Matthews DR, Hosker JP, Rudenski AS, Naylor BA, Treacher DF, Turner RC, 1985. Homeostasis model assessment: insulin resistance and beta-cell function from fasting plasma glucose and insulin concentrations in man. Diabetologia 28 (7), 412–419. [DOI] [PubMed] [Google Scholar]
- McComsey GA, Libutti DE, O’Riordan M, et al. , 2008. Mitochondrial RNA and DNA alterations in HIV lipoatrophy are linked to antiretroviral therapy and not to HIV infection. Antivir. Ther 13 (5), 715–722. [PMC free article] [PubMed] [Google Scholar]
- Miller TI, Borkowsky W, DiMeglio LA, et al. , 2012. Metabolic abnormalities and viral replication are associated with biomarkers of vascular dysfunction in HIV-infected children. HIV Med. 13 (5), 264–275. [DOI] [PMC free article] [PubMed] [Google Scholar]
- Mookerjee SA, Gerencser AA, Nicholls DG, Brand MD, 2017. Quantifying intracellular rates of glycolytic and oxidative ATP production and consumption using extracellular flux measurements. J. Biol. Chem 292 (17), 7189–7207. [DOI] [PMC free article] [PubMed] [Google Scholar]
- Mother-to-child transmission of HIV [Internet], [cited 2022 Nov 23]. Available from: https://www.who.int/teams/global-hiv-hepatitis-and-stis-programmes/hiv/prevention/mother-to-child-transmission-of-hiv.
- Noubissi EC, Katte J-C, Sobngwi E, 2018. Diabetes and HIV. Curr. Diab. Rep 18 (11), 125. [DOI] [PubMed] [Google Scholar]
- Ogawa M, Takemoto Y, Sumi S, et al. , 2015. ATP generation in a host cell in early-phase infection is increased by upregulation of cytochrome c oxidase activity via the p2 peptide from human immunodeficiency virus type 1 Gag. Retrovirology 12 (1), 97. [DOI] [PMC free article] [PubMed] [Google Scholar]
- Poirier MC, Divi RL, Al-Harthi L, et al. , 2003. Long-term mitochondrial toxicity in HIV-uninfected infants born to HIV-infected mothers. J. Acquir Immune Defic Syndr 1999 33 (2), 175–183. [DOI] [PubMed] [Google Scholar]
- Active Protocols ∣ PHACS [Internet], [cited 2022. Jul 24]. Available from: https://phacsstudy.org/About-Us/Active-Protocols. [Google Scholar]
- Redant S, Hussein H, Mugisha A, et al. , 2019. Differentiating hyperlactatemia type A from type B: how does the lactate/pyruvate ratio help? J Transl Intern Med. 7 (2), 43–45. [DOI] [PMC free article] [PubMed] [Google Scholar]
- Rodríguez-Mora S, Mateos E, Moran M, et al. , 2015. Intracellular expression of Tat alters mitochondrial functions in T cells: a potential mechanism to understand mitochondrial damage during HIV-1 replication. Retrovirology 12 (1), 78. [DOI] [PMC free article] [PubMed] [Google Scholar]
- Rötig Agnès, Munnich A, 2003. Genetic features of mitochondrial respiratory chain disorders. J Am Soc Nephrol 14 (12), 2995. [DOI] [PubMed] [Google Scholar]
- Shikuma CM, Gerschenson M, Chow D, et al. , 2008. Mitochondrial oxidative phosphorylation protein levels in peripheral blood mononuclear cells correlate with levels in subcutaneous adipose tissue within samples differing by HIV and lipoatrophy status. AIDS Res. Hum. Retroviruses 24 (10), 1255–1262. [DOI] [PMC free article] [PubMed] [Google Scholar]
- Sims EK, Park G, Mather KJ, Mirmira RG, Liu Z, Gupta SK, 2018. Immune reconstitution in ART treated, but not untreated HIV infection, is associated with abnormal beta cell function. Landay A, Editor. PLOS ONE. 13 (5), e0197080. [DOI] [PMC free article] [PubMed] [Google Scholar]
- Sun J, Longchamps RJ, Piggott DA, et al. , 2018. The association between HIV infection and mitochondrial DNA copy number in peripheral blood: a population-based, prospective cohort study. J Infect Dis [Internet]. Available from: http://academic.oup.com/jid/advance-article/doi/10.1093/infdis/jiy658/5204254. [DOI] [PMC free article] [PubMed] [Google Scholar]
- Vercellino I, Sazanov LA, 2022. The assembly, regulation and function of the mitochondrial respiratory chain. Nat Rev Mol Cell Biol. Nature Publishing Group; 23 (2), 141–161. [DOI] [PubMed] [Google Scholar]
- Villeneuve LM, Purnell PR, Stauch KL, Callen SE, Buch SJ, Fox HS, 2016. HIV-1 transgenic rats display mitochondrial abnormalities consistent with abnormal energy generation and distribution. J. Neurovirol 22 (5), 564–574. [DOI] [PMC free article] [PubMed] [Google Scholar]
Associated Data
This section collects any data citations, data availability statements, or supplementary materials included in this article.