Abstract
Accompanying the commercial exploitation of shale oil and gas in North America, shale oil has gradually become an important resource, sparking great interest among countries around the world in recent years. In this study, focusing on the Paleogene Shahejie Formation in Bohai Bay (Eastern China), techniques such as CT, nitrogen adsorption, mercury injection capillary pressure (MICP), and nuclear magnetic resonance (NMR) were used to characterize the pore structure and mobility of the shale reservoir. Based on the X-ray CT data, the pore radius of the shale reservoir is in the range 0.5–65 μm, and the pore coordination number is concentrated in the range of 1–4. The shale reservoir is poorly connected. The minimum size of the unit body for establishing the digital core model is 380 μm. Based on the experimental data of nitrogen adsorption and MICP, the pores of shale in the study area are mainly classified as ink-bottle-shaped pores, transition-shaped pores, and flat plate slit-shaped pores. The specific surface area and volume of pores are mainly attributed to meso- and macropores. The movable fluid saturation of shale is distributed from 23.59 to 44.42%, the pore throat radius is distributed from 0.001 to 6 μm, and the lower limit of the movable pore throat radius of shale is distributed between 9.0 and 20.1 nm. The movable fluid porosity is mainly distributed between 0.84 and 4.08%, with an average movable fluid porosity of 2.37%. The findings provide a theoretical basis for the efficient development of shale oil resources.
1. Introduction
With the rising global demand for oil and gas resources, unconventional shale oil has great potential in oil and gas resources.1−4 Pore space is the main storage space for shale oil, and the pore structure directly affects the storage mode and flow capacity of shale oil.5,6
The microscopic pore characteristics of shale reservoirs are the basis for studying reservoir properties and fluid flow capacity. At present, the techniques that are used to characterize the pore structure of shale reservoirs include gas adsorption, mercury injection capillary pressure (MICP), nuclear magnetic resonance (NMR), small-angle X-ray scattering, scanning electron microscopy (SEM), CT, etc. They can obtain structural parameters such as the pore size, porosity, specific surface area, etc., within the reservoir.7−9 The construction of digital cores using the CT scanning method enables the visualization of reservoir porosity data on multiple scales.10−13 N2 adsorption mainly characterizes micropores and mesopores, and the specific surface area distribution and pore radius distribution curves are obtained by solving the adsorption–desorption data.14 The MICP method mainly describes mesopore and macropore characteristics, and the combined application of MICP method and gas adsorption method can characterize the pore distribution in the micropore to macropore range.15 Lei et al.16 quantitatively classified shale porosity into seven classes and conducted multiple experiments (CT, gas adsorption, SEM, NMR, and MICP) to characterize the samples on multiple scales. Liu et al.17 characterized the pore structure of Bakken shale samples using N2 adsorption and MICP methods. Zheng et al.18 characterized the full-size pore size distribution of shale by a combination of N2 adsorption, MIP, and nano-CT. Jingjing et al.19 constructed a three-dimensional digital core model of a low-permeability sandstone reservoir based on micro-CT scanning technology.20
Shale reservoirs are characterized by complex pore structure and nonhomogeneity, and the characterization of mobile oil is very important.21 Nuclear magnetic resonance (NMR) techniques offer a rapid and nondestructive means to acquire reservoir pore characteristics and fluid distribution information.22 Yan et al.23 used NMR logging for pore characterization of tight reservoirs. Bai Songtao et al.24 verified that the NMR technique can characterize the pore structure reliably using mathematical models and graphical methods. Li Jun et al.25 used gas adsorption, MICP, and NMR techniques to characterize the T2 mapping studies of rock samples in saturated water and saturated oil states. Wang Weimin26 demonstrated that NMR techniques can accurately and quantitatively characterize mobile fluid saturation.27 There is a scarcity of studies on mobile fluid saturation and the lower limit of mobile pore throat radius in shale reservoirs. Mobile fluid saturation is a key parameter for evaluating the mobility of shale reservoirs.28,29
This study focuses on the Paleogene Shahejie Formation of the Jiyang Depression. We characterized the real shale structure at multiple scales through CT scanning, nitrogen adsorption, and MICP, analyzed the pore and throat dimensions of the shale reservoir, and analyzed the connectivity of the samples through the coordination number. The characteristics of the mobile fluid distribution in shale reservoirs and the lower limit of mobile pore throat radius were investigated by NMR experiments. The results of the study provide a theoretical basis for the efficient development of shale oil in the Jiyang Depression within the Bohai Bay Basin.
2. Experiments and Methods
2.1. Experimental Samples
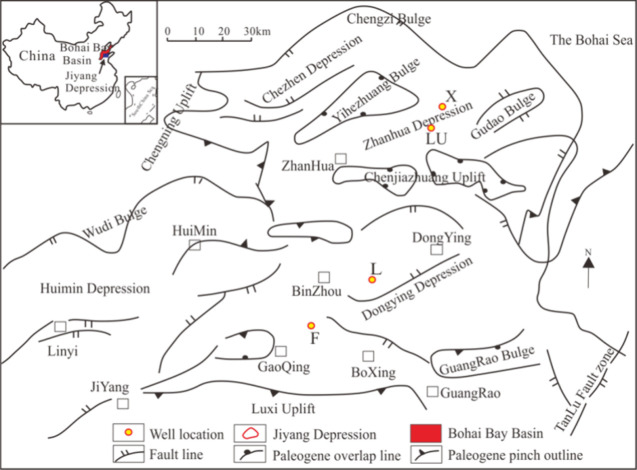
The 10 shale samples studied were selected from key coring wells in the Shahejie Formation of the Jiyang Depression (Figure 1). The depression is located in the southeastern part of the Bohai Bay Basin. The Paleogene Shahejie Formation is the most important biogenic storage assemblage in the Jiyang Depression. The oil source comparison shows that the crude oil in this area mainly originates from the hydrocarbon source rocks of the Sha Iv upper subsegment and the Sha III lower subsegment.30 The thickness of the dark mudstone in the Sha IV upper subsection is generally around 250–300 m, and lake-phase shale was formed in a saline-brackish environment during the depositional period. The thickness of the dark mudstone in the Sha III lower subsection is usually around 250 m, and lake-phase shale was formed in slightly brackish-freshwater environment during the depositional period, as shown in Figure 2.31 The selected samples were taken by pressurized coring, and their basic geological and geochemical characteristics are shown in Table 1.
Figure 1.
Geographical location of Jiyang Depression and samples.
Figure 2.
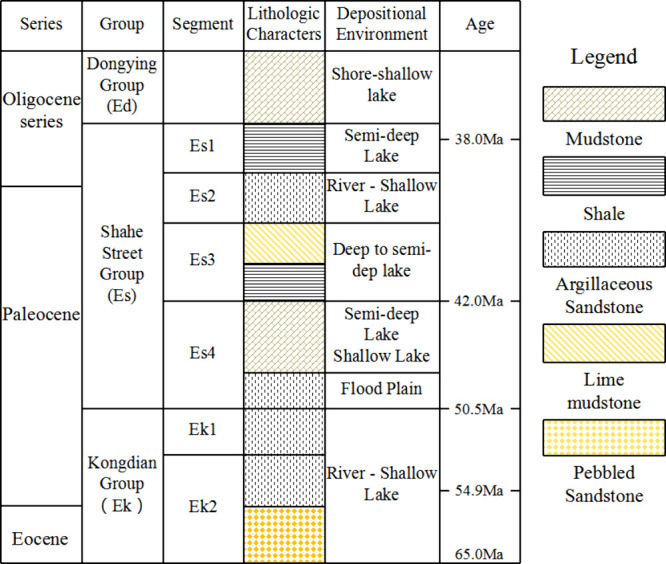
Stratigraphic histogram of Jiyang Depression.
Table 1. Basic Geological and Geochemical Characteristics of Samples.
| sample | depth | formation | Ro (%) | TOC (%) | clay (%) | quartz (%) | carbonate (%) |
|---|---|---|---|---|---|---|---|
| X-1 | 3381.2 | Es3 | 0.44 | 2.81 | 29.03 | 17.82 | 41.04 |
| X-2 | 3383.0 | Es3 | 0.50 | 3.64 | 24.9 | 22.70 | 36.6 |
| X-3 | 3415.0 | Es3 | 0.42 | 2.73 | 20.75 | 15.37 | 51.52 |
| X-4 | 3417.0 | Es3 | 0.44 | 3.29 | 22.47 | 19.86 | 59.64 |
| F-1 | 3200.6 | Es3 | 0.54 | 1.98 | 24.30 | 23.29 | 38.04 |
| F-2 | 3082.7 | Es3 | 0.58 | 7.22 | 16.55 | 22.10 | 34.70 |
| L-1 | 3644.0 | Es4 | 0.62 | 4.77 | 23.45 | 26.95 | 33.93 |
| L-2 | 3639.0 | Es4 | 0.53 | 4.82 | 29.11 | 26.01 | 30.51 |
| LU-1 | 3300.6 | Es3 | 0.45 | 1.89 | 19.0 | 18.1 | 51.88 |
| LU-2 | 3307.0 | Es4 | 0.49 | 2.67 | 10.42 | 16.78 | 54.21 |
2.2. Experimental Methods
The CT experiment utilized the Phoenix Nanotom S instrument, which is capable of capturing images with a maximum resolution of 200 nm. The shale samples were shaped into cylinders with a diameter of 1.6 mm and affixed to the needle tip. During the test, the needle tip was secured in the sample turntable. The scanning temperature was maintained at 20 °C with an exposure rate of 120 images per second. Following the scan, a total of 1000 two-dimensional slice images were acquired, each with a resolution of 0.95 μm. For the N2 adsorption experiment, the Quanta Chrome Autosorb-1 instrument was utilized. After oil washing, the shale samples were dried, ground to a fineness below 80 mesh using a grinding bowl, and vacuum degassed at 378 K for 12 h to eliminate adsorbed water and residual volatiles. Approximately 5 g of the samples were selected for testing, with N2 used as the adsorption gas. Curves depicting isothermal adsorption and desorption at 77 K were generated, and the pore parameters of the samples were determined by using the BET method and BJH theory. The MICP experiment employed the PoreMaster@60/33 instrument, which was capable of reaching a maximum mercury injection pressure of 272 MPa. The samples underwent vacuum degassing and dehydration at 333 K for 48 h to eliminate adsorbed water. Mercury injection volumes, capillary pressure curves, and pore throat distributions at various pressures were acquired through continuous mercury injection. NMR testing was executed using the MicroMR12-040 V instrument, while centrifugation was carried out with a CSC-12 Super Core High-Speed Freezer Centrifuge. The shale samples were initially dried in a vacuum oven at 110 °C for 24 h to eliminate pore fluids. After being cooled to room temperature in a desiccator, shale cores were pressurized with paraffin at 10 MPa following the vacuum treatment for 24 h. The mass of shale was monitored at 8 h intervals, with negligible mass changes observed after 72 h of shale saturation. The NMR scanning test was then performed, and the data were processed through inversion to obtain the initial T2 map. Subsequently, a high-speed centrifuge was used for centrifugation at 2.07 MPa (300 psi) centrifugal force for 120 min. The postcentrifugation T2 map was generated by subjecting the centrifuged core samples to further NMR testing and inversion.
2.3. Mathematical Principles
The NMR T2 map represents a superposition of the volume relaxation and surface relaxation. The expression for the transverse relaxation time T2 in a uniform magnetic field is given below:
| 1 |
where T2 is the
transverse relaxation time in ms, T2B is
the volumetric relaxation time in ms, ρ2 is the transverse
surface relaxation rate in μm/ms, and  is the specific surface area of pores in
μm2/μm3.
Typically the value
of T2B is greater than 3000 ms, which
is much greater than the value of T2.
Therefore,  can be ignored. The simplified eq 1 is given below:
| 2 |
The time attenuation curve of the total NMR signal intensity in the relaxation process was obtained in the following NMR experiment:
| 3 |
where S(t) is the total NMR signal intensity (TNSI), and Ai is the pore fraction.
3. Results and Discussion
3.1. Pore Structure of Shale
CT
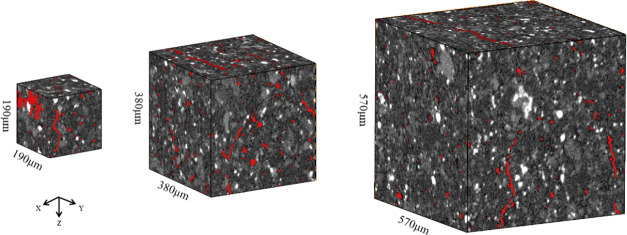
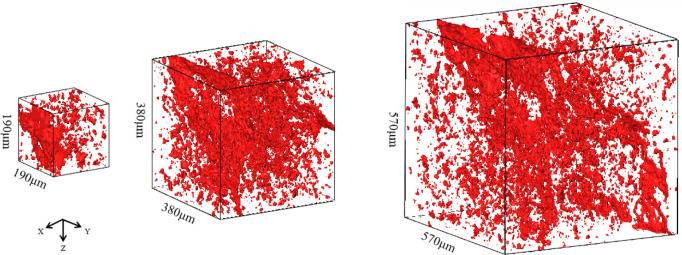
According to the micrometer CT scan shale slice images, the three-dimensional micropore structure was constructed. Models of size 200, 400, and 600 were randomly constructed in the same spatial position. The whole CT scan area was divided into equal size grids or volume units, and a random position was selected as the starting point of REV. To ensure that the selected position does not exceed the boundary of the scan area, the starting position of REV was determined, and the data block of the position and the surrounding cube shape were extracted as REV to analyze the REV size that can accurately characterize the pore throat. The specific parameters of the models are shown in Table 2. The 3D reconstruction of the shale microstructure of different sizes is shown in Figure 3, where red represents pores, black represents rock skeletons, gray represents low-density minerals, and white represents high-density minerals. The pore network model of each model was extracted according to the maximum sphere method, as shown in Figure 4.
Table 2. Multiscale 3D Digital Rock Model Parameters.
| model number | measure | means | resolution (nm) | mesh size (piece) | actual size (μm) | simulated porosity (%) | experimental porosity (%) | relative porosity error (%) | mean relative error (%) |
|---|---|---|---|---|---|---|---|---|---|
| 1 | micron | X-ray CT | 950 | 200 | 190 | 6.8 | 5.9 | 15.2 | 12.9 |
| 2 | 400 | 380 | 6.7 | 13.5 | |||||
| 3 | 600 | 570 | 6.5 | 10.1 |
Figure 3.
Different size CT scan core model construction (red: pore; black: skeleton; white: minerals).
Figure 4.
Different sizes of shale pore structure (red: pore).
The maximum sphere method, employed to construct the pore network model, involves approximating the pores and throats within the core as spheres. This method defines the pore center as the origin, and the pore boundary as the limiting condition. By maximizing the spheres, a graph is generated, depicting these spheres or curves (as shown in Figure 5), illustrating the three-dimensional pore network model of the digital core skeleton and pore throats. Structural characteristic parameters such as pore volume, pore radius, throat length, and coordination number can be derived based on these spheres.
Figure 5.
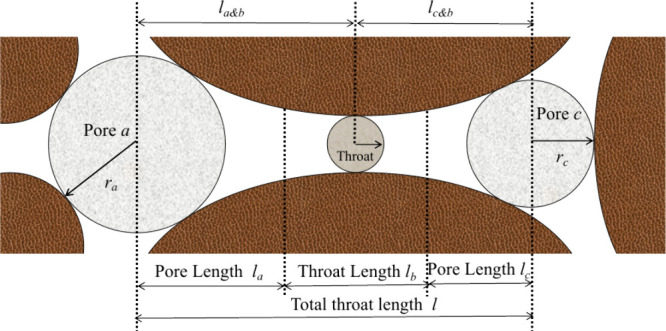
Schematic diagram of maximum sphere method.
The pore radius distribution and volume distribution of different volume models are shown in Figure 6. It can be seen from the figure that the pore radius distribution mainly ranges from 0.5 to 65 μm, and the average pore radius of the three models is 1.87 μm, 1.80 μm, and 1.82 μm. The number of small pores with a radius less than 4 μm accounts for more than 90% of all pores, but their volume accounts for only 20% of the total volume. The number of large pores greater than or equal to 65 μm accounts for 2% of the total pores, and their volume accounts for more than 50% of the total pore volume, contributing the most to the total porosity of shale. The number of pores greater than or equal to 4 μm accounts for 35%, and their volume accounts for 96% of the total pores, providing the main storage space and circulation channels.
Figure 6.
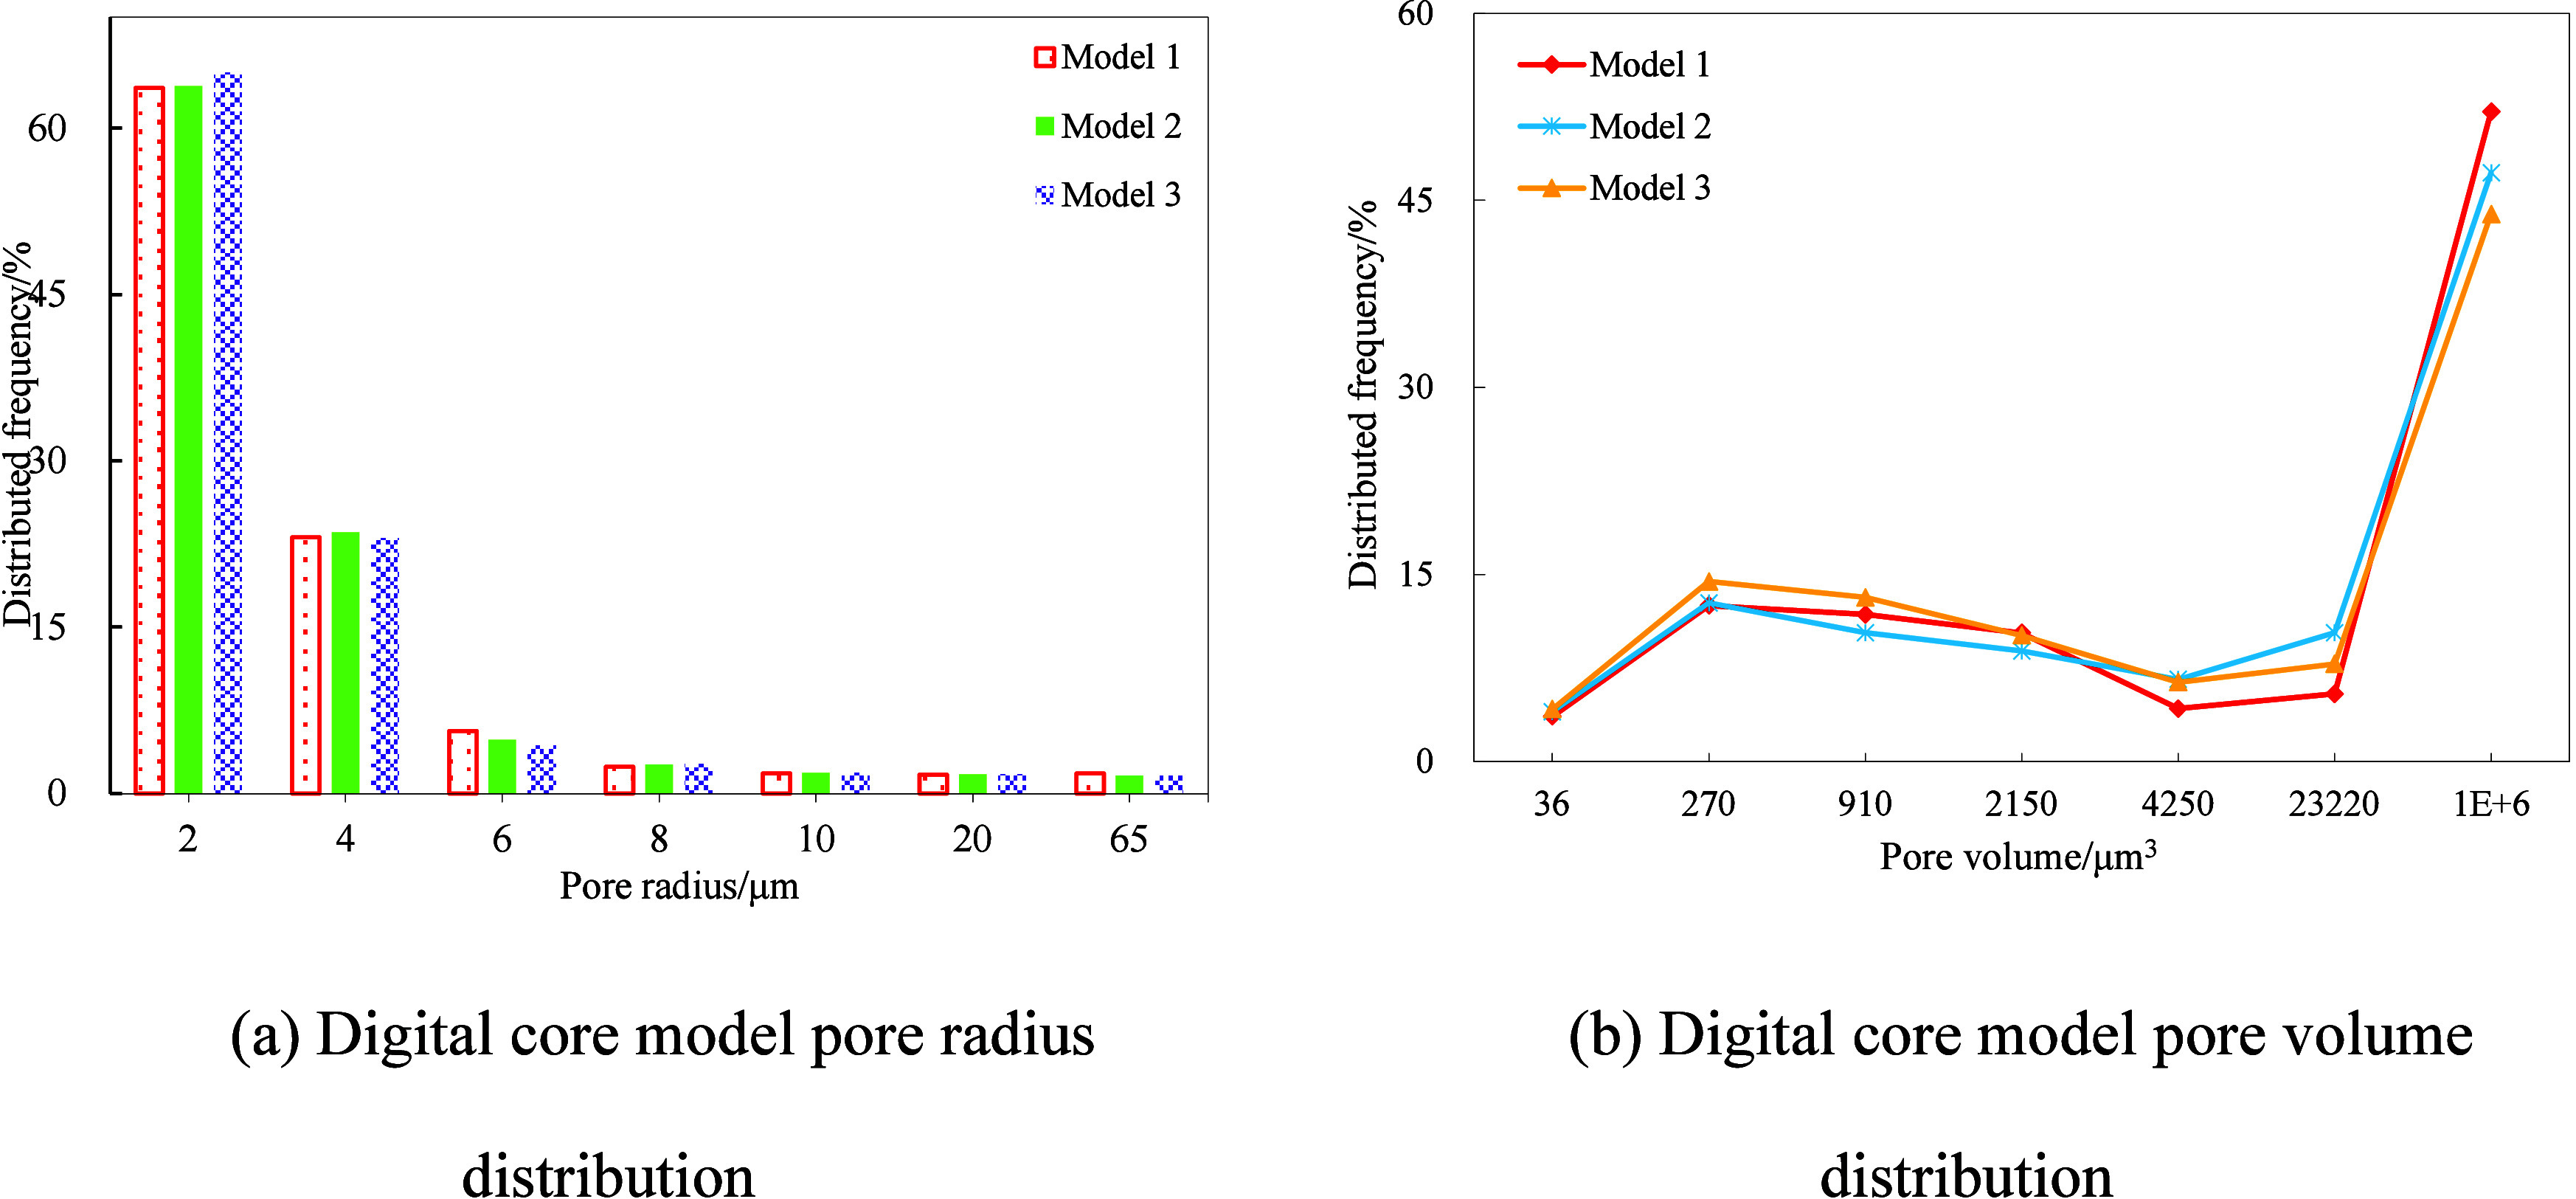
Relationship between pore radius and pore volume distribution.
3.2. Analysis of Throat Characteristics
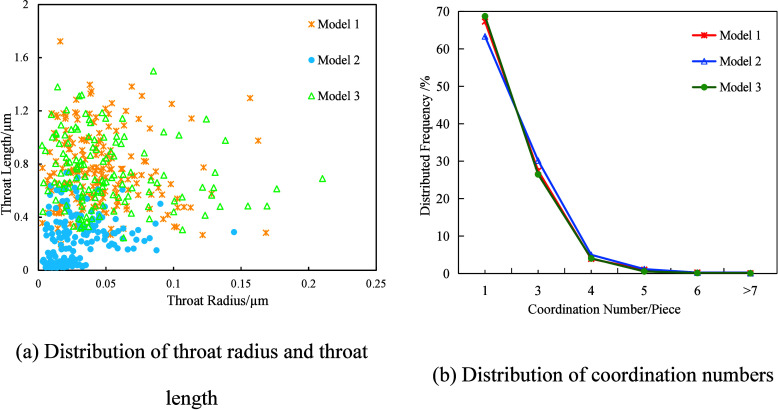
The connectivity evaluation of pore networks poses a primary challenge in the pore characterization of shale reservoirs. Figure 7a depicts the distribution of throat radius and throat length for each model. It shows that the range of throat size distribution varies widely. The radius of the throats was distributed between 0.05 and 40 μm, and the length of the throats was between 8 and 340 μm. As the size of the digital core model rises, the proportion of long throats gradually increases and the proportion of short throats gradually decreases. This trend gradually stabilized between Models 2 and 3, and the ranges of distribution of throat radii and lengths are approximately the same for both. This shows that the REV size is at least 380 μm, which is able to fully characterize the long throats. The pore coordination number of the digital core model is shown in Figure 7b, which indicates that the pore coordination number does not change significantly with the increase of the model size and the trend is similar, with the coordination number mainly concentrated in the range of 1 to 4 and then gradually decreasing.
Figure 7.
Throat parameters and coordination number distribution of different size models of the micronscale digital core.
N2 Adsorption
The N2 adsorption experimental data mainly characterize pores from 4 to 120 nm. The adsorption of N2 by the pores increases gradually with an increase in relative pressure. At the same pressure, more N2 adsorption indicates a larger pore throat radius and better connectivity. The large difference in the morphology of the adsorption–desorption curves indicates a large pore size distribution. The nitrogen adsorption–desorption curves and pore diameter distributions are shown in Figure 8. Based on the morphology of the adsorption curves, they are divided into three stages. When the relative pressure is less than 0.25, the adsorption curves show a slightly upward convex pattern with a slow rise, indicating that the N2 molecules are adsorbed in a monolayer on the pore surface or fill the micropores. At relative pressures between 0.25 and 0.8, the adsorption curves are smooth and slowly rising curves, which are approximately linear, indicating that multilayer adsorption of N2 molecules occurs in meso- and macropores. When the relative pressure is greater than 0.8, the adsorption curves rise sharply and take a downward concave shape. This pattern signifies that the equilibrium pressure is gradually approaching the saturated vapor pressure, and the N2 molecules fill the macropores and undergo multilayer adsorption, indicating the development of macropores.
Figure 8.
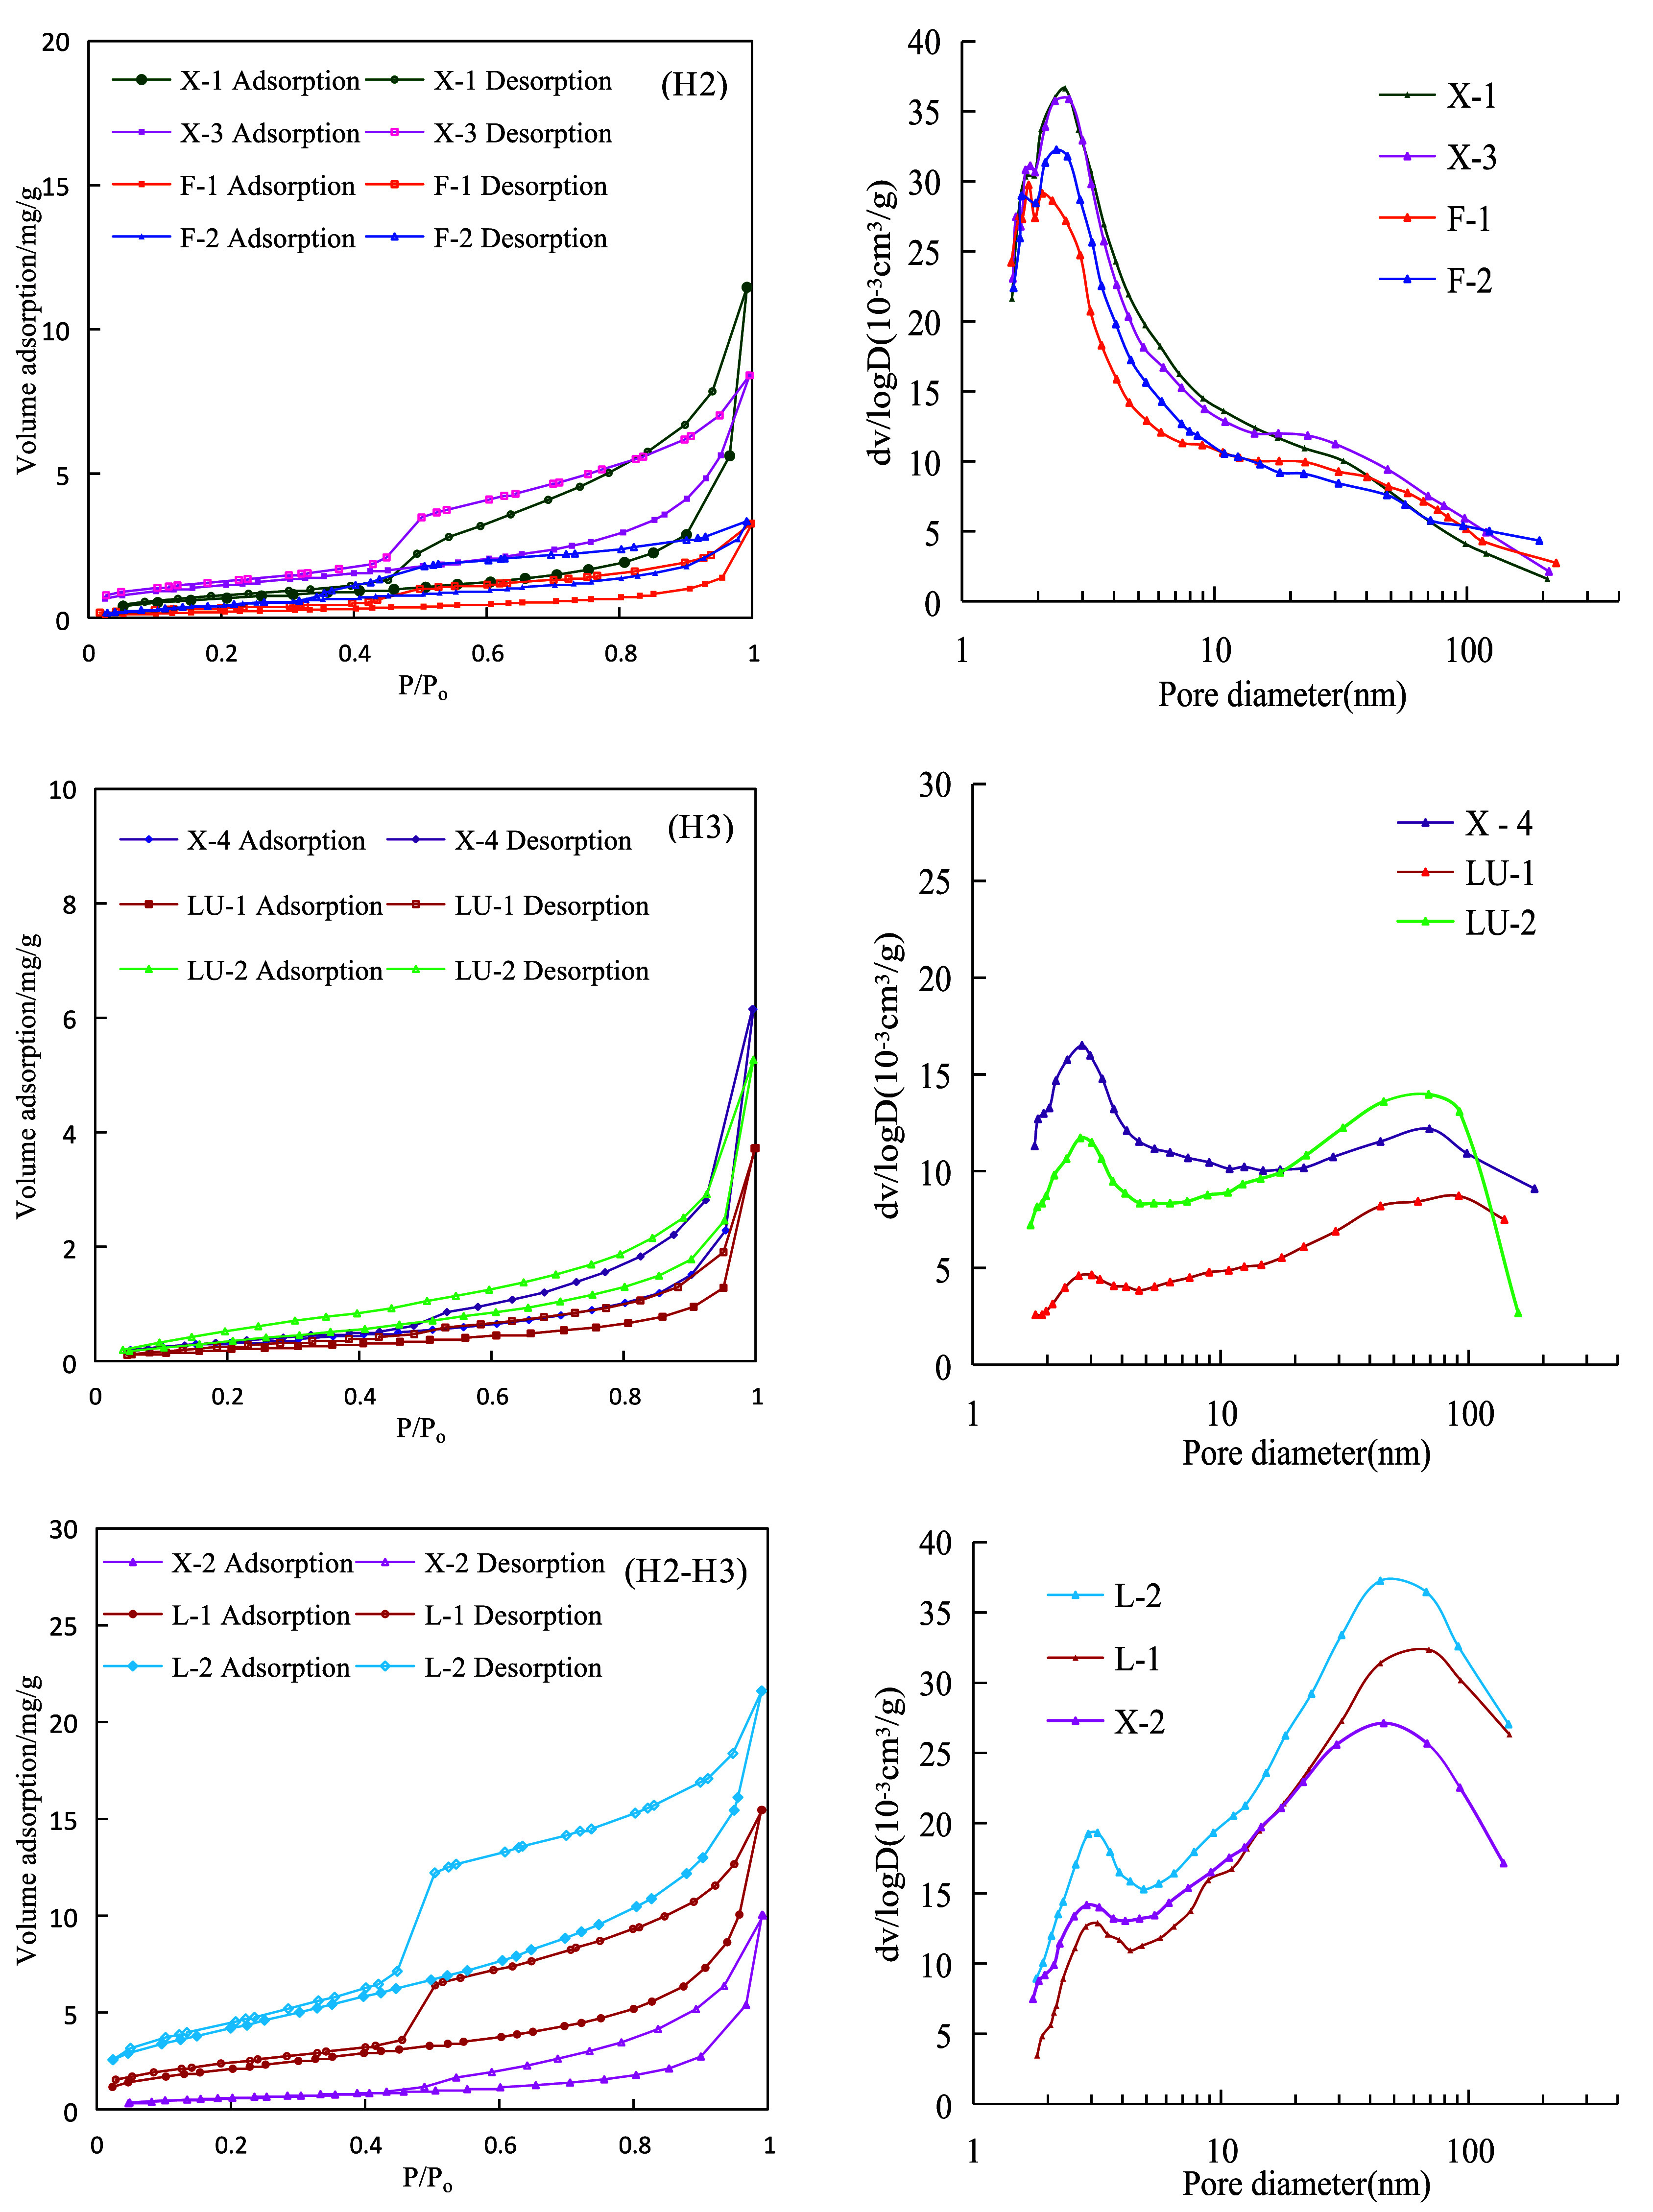
Nitrogen adsorption–desorption curves and pore diameter distributions.
Brunaner et al. proposed four isothermal adsorption lines ranging from type I to type IV.32 The N2 adsorption curves of the samples generally exhibited distinct hysteresis loops. The primary types were H2 (ink-bottle shaped), H3 (flat plate slit shaped), and H2–H3 (transition shaped), indicating the presence of three types of pores in the samples: microporous, mesoporous, and macroporous. H2 pores are characterized by an ink-bottle shape, tapering, and constricting at certain points. H3 pores are gaps between flaky particles or flakes, contrasting with closed pore structures. H2–H3 pores encompass ink-bottle-shaped pores and are classified as nonclosed structures, resulting in greater radii for H2–H3 pores.
Based on the N2 adsorption test results, the pore diameter and pore volume distribution were calculated according to the BJH theory.33 The H2-type samples had relatively high contents of small pores and mesopores, with two peaks around 4 and 50 nm, and the average pore size was 8.37 nm. The pore size of H3-type samples showed a bimodal distribution, with two peaks around 4 and 80 nm, which was dominated by micropores, but the content of small pore and mesopores was relatively high, and the average pore size was 10.89 nm. The peaks of H2–H3 type samples are distributed around 3 and 70 nm, and the amplitude of the right peak is significantly higher than that of the left peak, indicating that this type of shale has relatively high mesoporous content and low microporous content, with an average pore size of 14.57 nm.
Mercury Injection Capillary Pressure (MICP)
MICP mainly characterizes macropores with pore sizes larger than 50 nm. The Hg imbibition curve reflects the distribution of pore throats, and the Hg drainage curve reflects connectivity. The distribution of mercury imbibition and drainage curves, pore radius and contribution to permeability of the shale samples are shown in Figure 9. The X-1 sample shows a faster growth rate of mercury saturation with a gradual increase of capillary pressure, indicating the presence of more macropores and mesopores in the rock sample. The permeability mainly originates from macropores above 9.870 μm. X-2 and X-4 have distribution characteristics similar to those of X-1. X-3 has two intervals of rapidly increasing mercury saturation, corresponding to a bimodal distribution in the permeability contribution distribution curve because of the larger throat radius and higher mercury imbibition saturation at lower pressures. The permeability contribution of sample F-1 shows a bimodal distribution, and the minimum radius contributing to the permeability is 0.062 μm, indicating that the pore throats are better developed, consistent with the results of the nitrogen experiments. The maximum mercury imbibition saturation for samples L-2 and L-1 were 71.7% and 86.2%, respectively, indicating that the mesopore development of sample L-2 was better than that of sample L-1. The maximum mercury imbibition saturation of LU-1 and LU-2 were 57.0% and 54.1%, respectively, and the mercury drainage efficiency was very low, 5.2% and 14.1%, respectively, indicating that the pore and throat sizes in the rock samples were small, which was consistent with the results of the nitrogen adsorption experiments.
Figure 9.
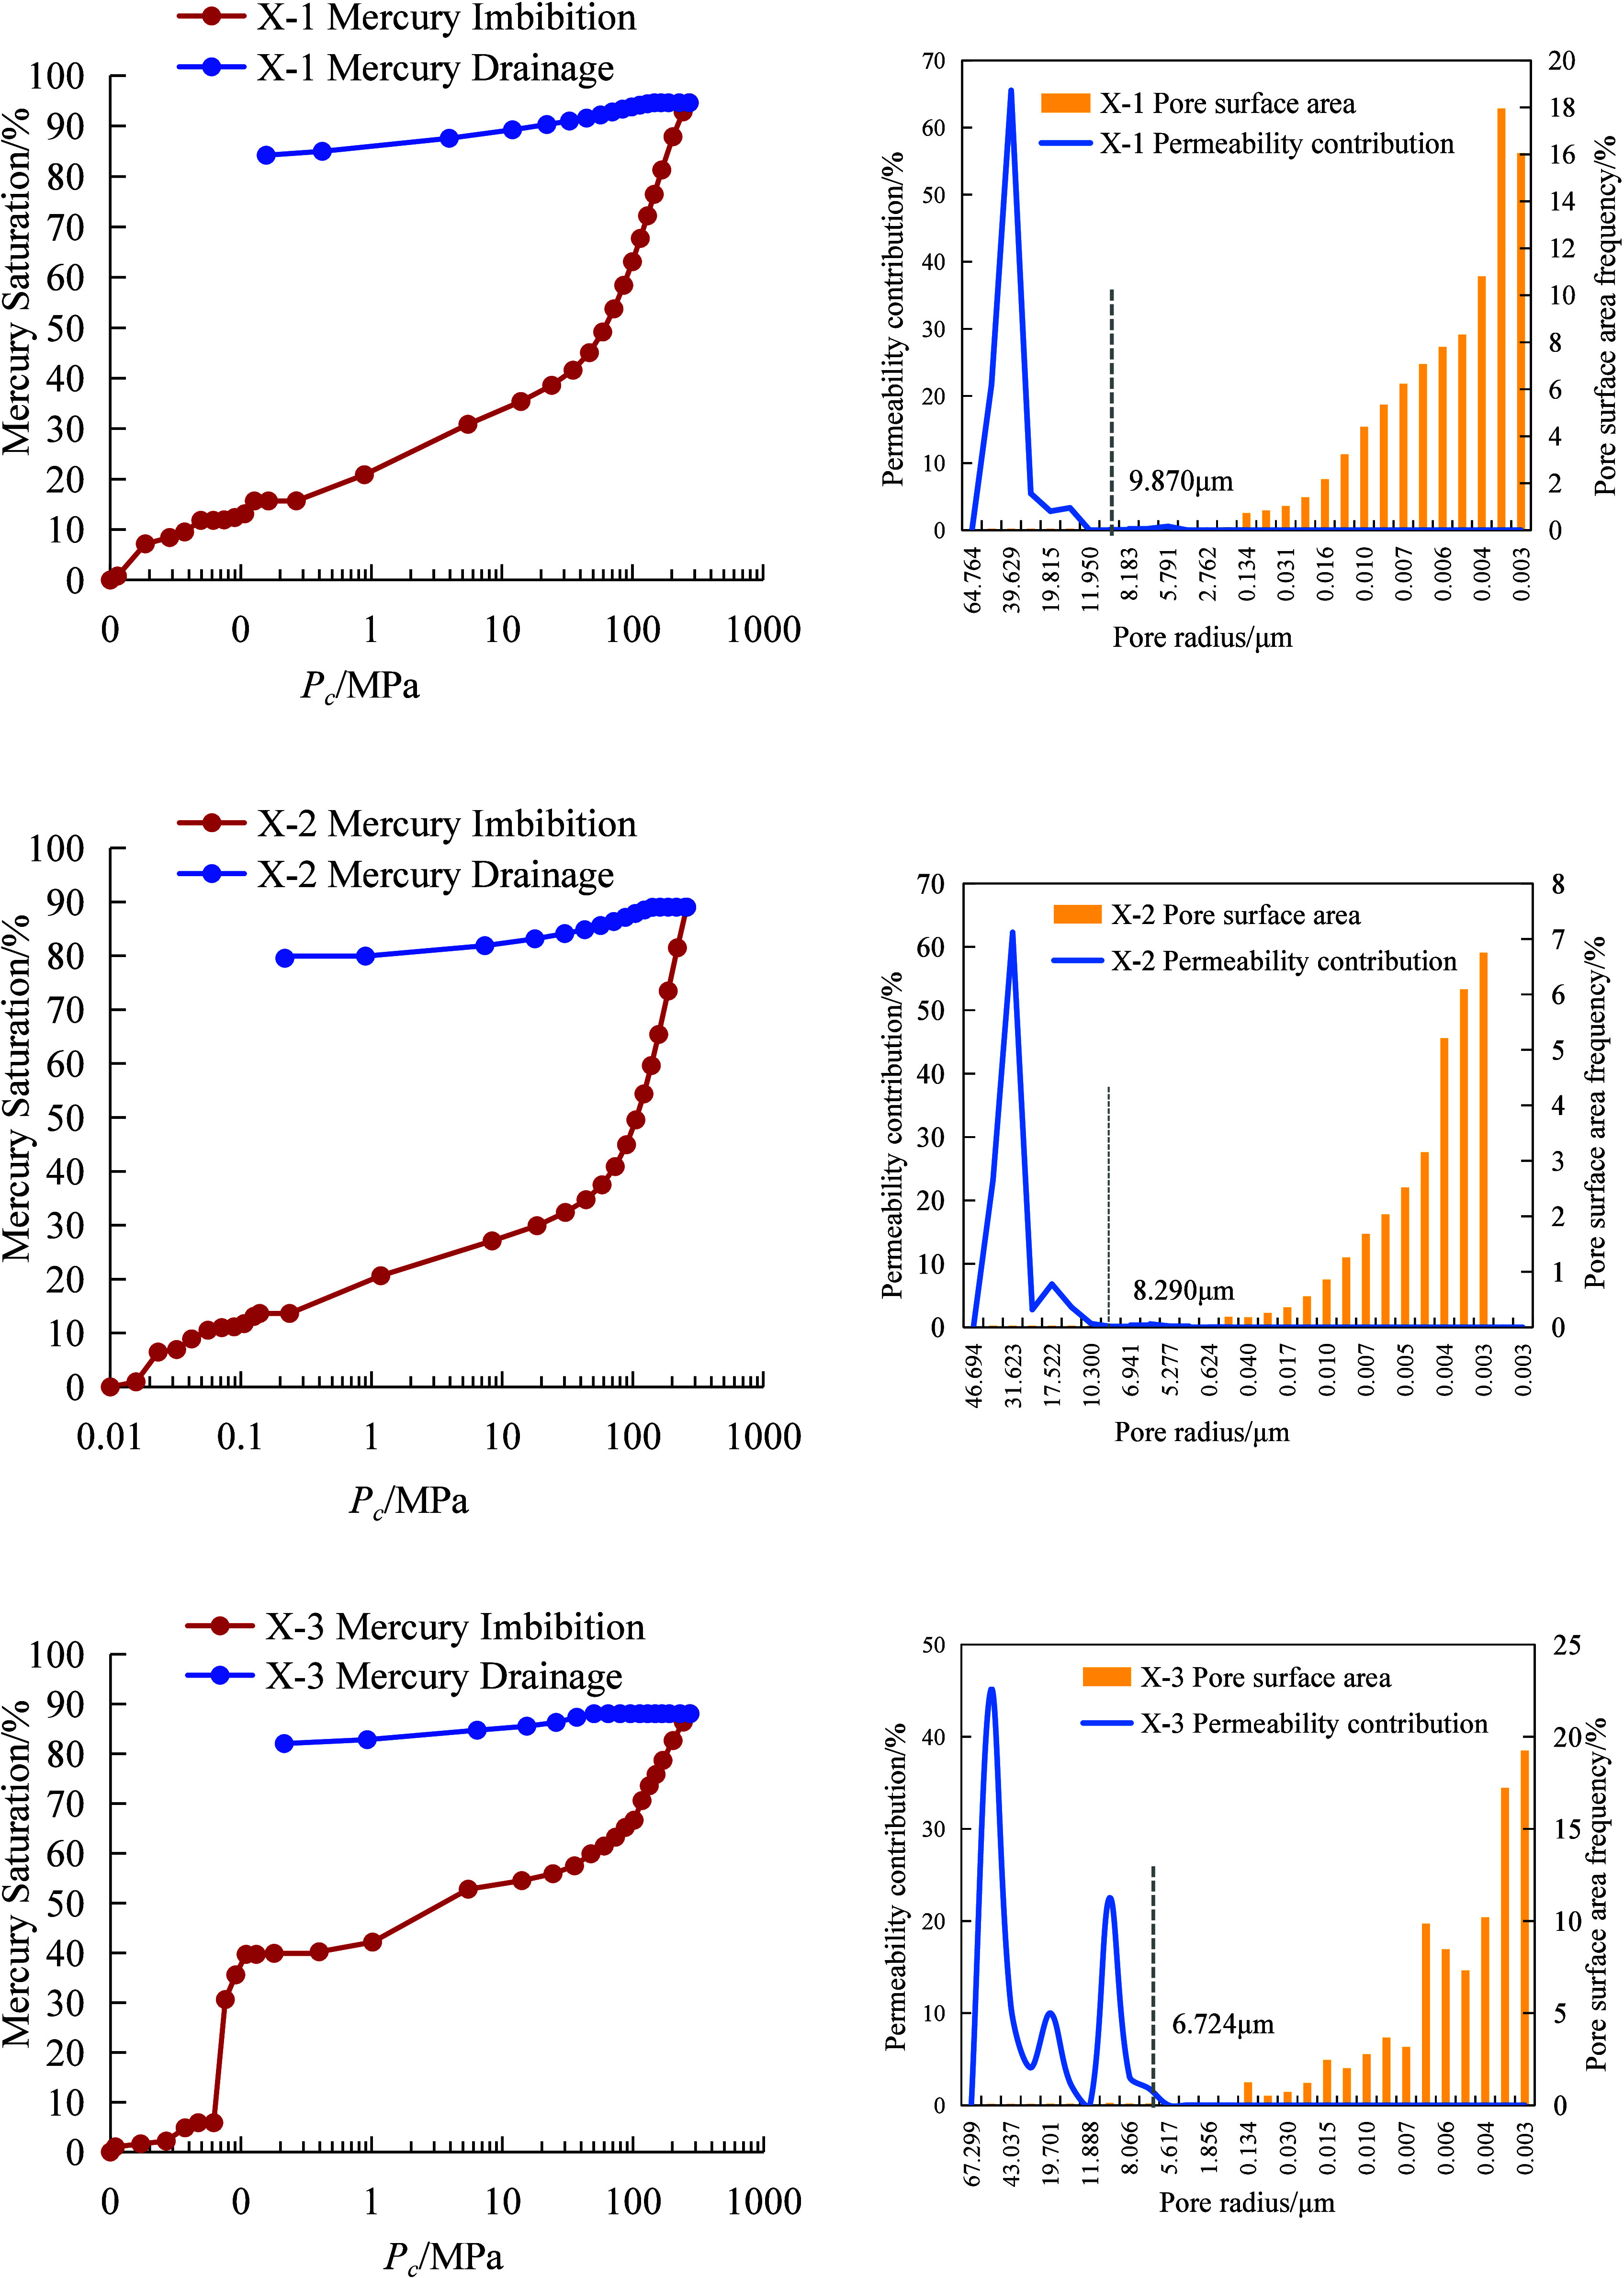
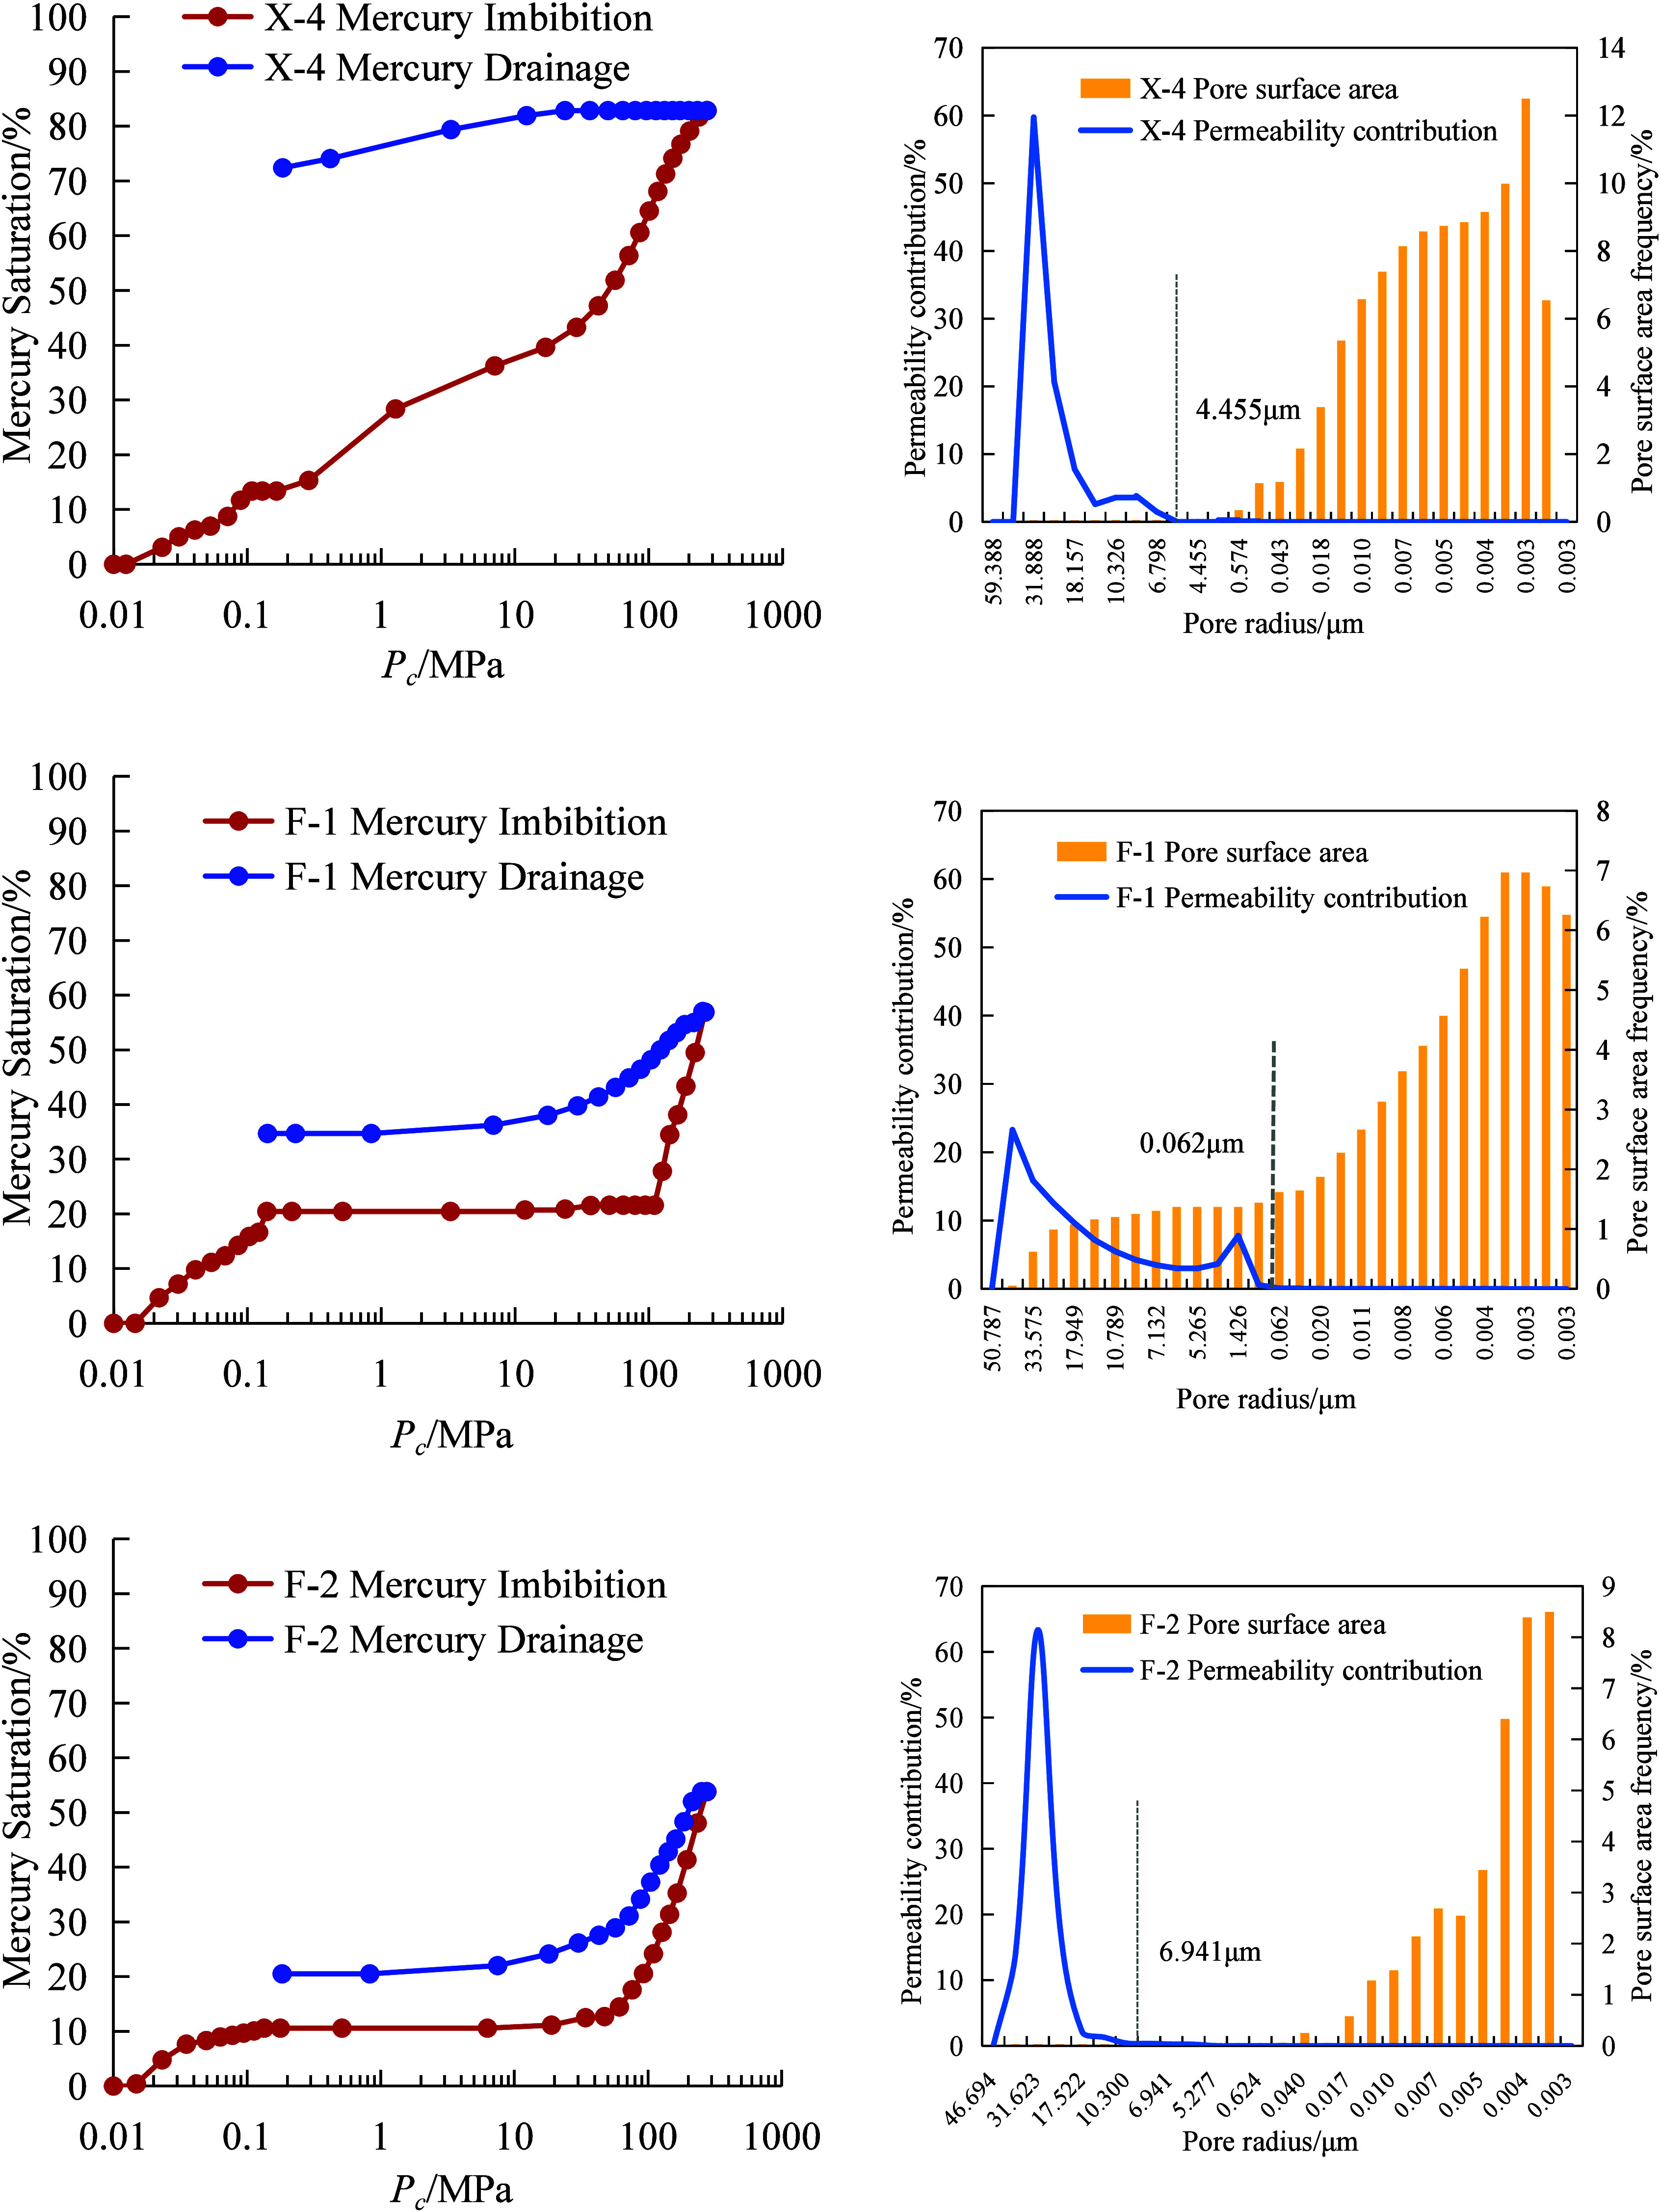
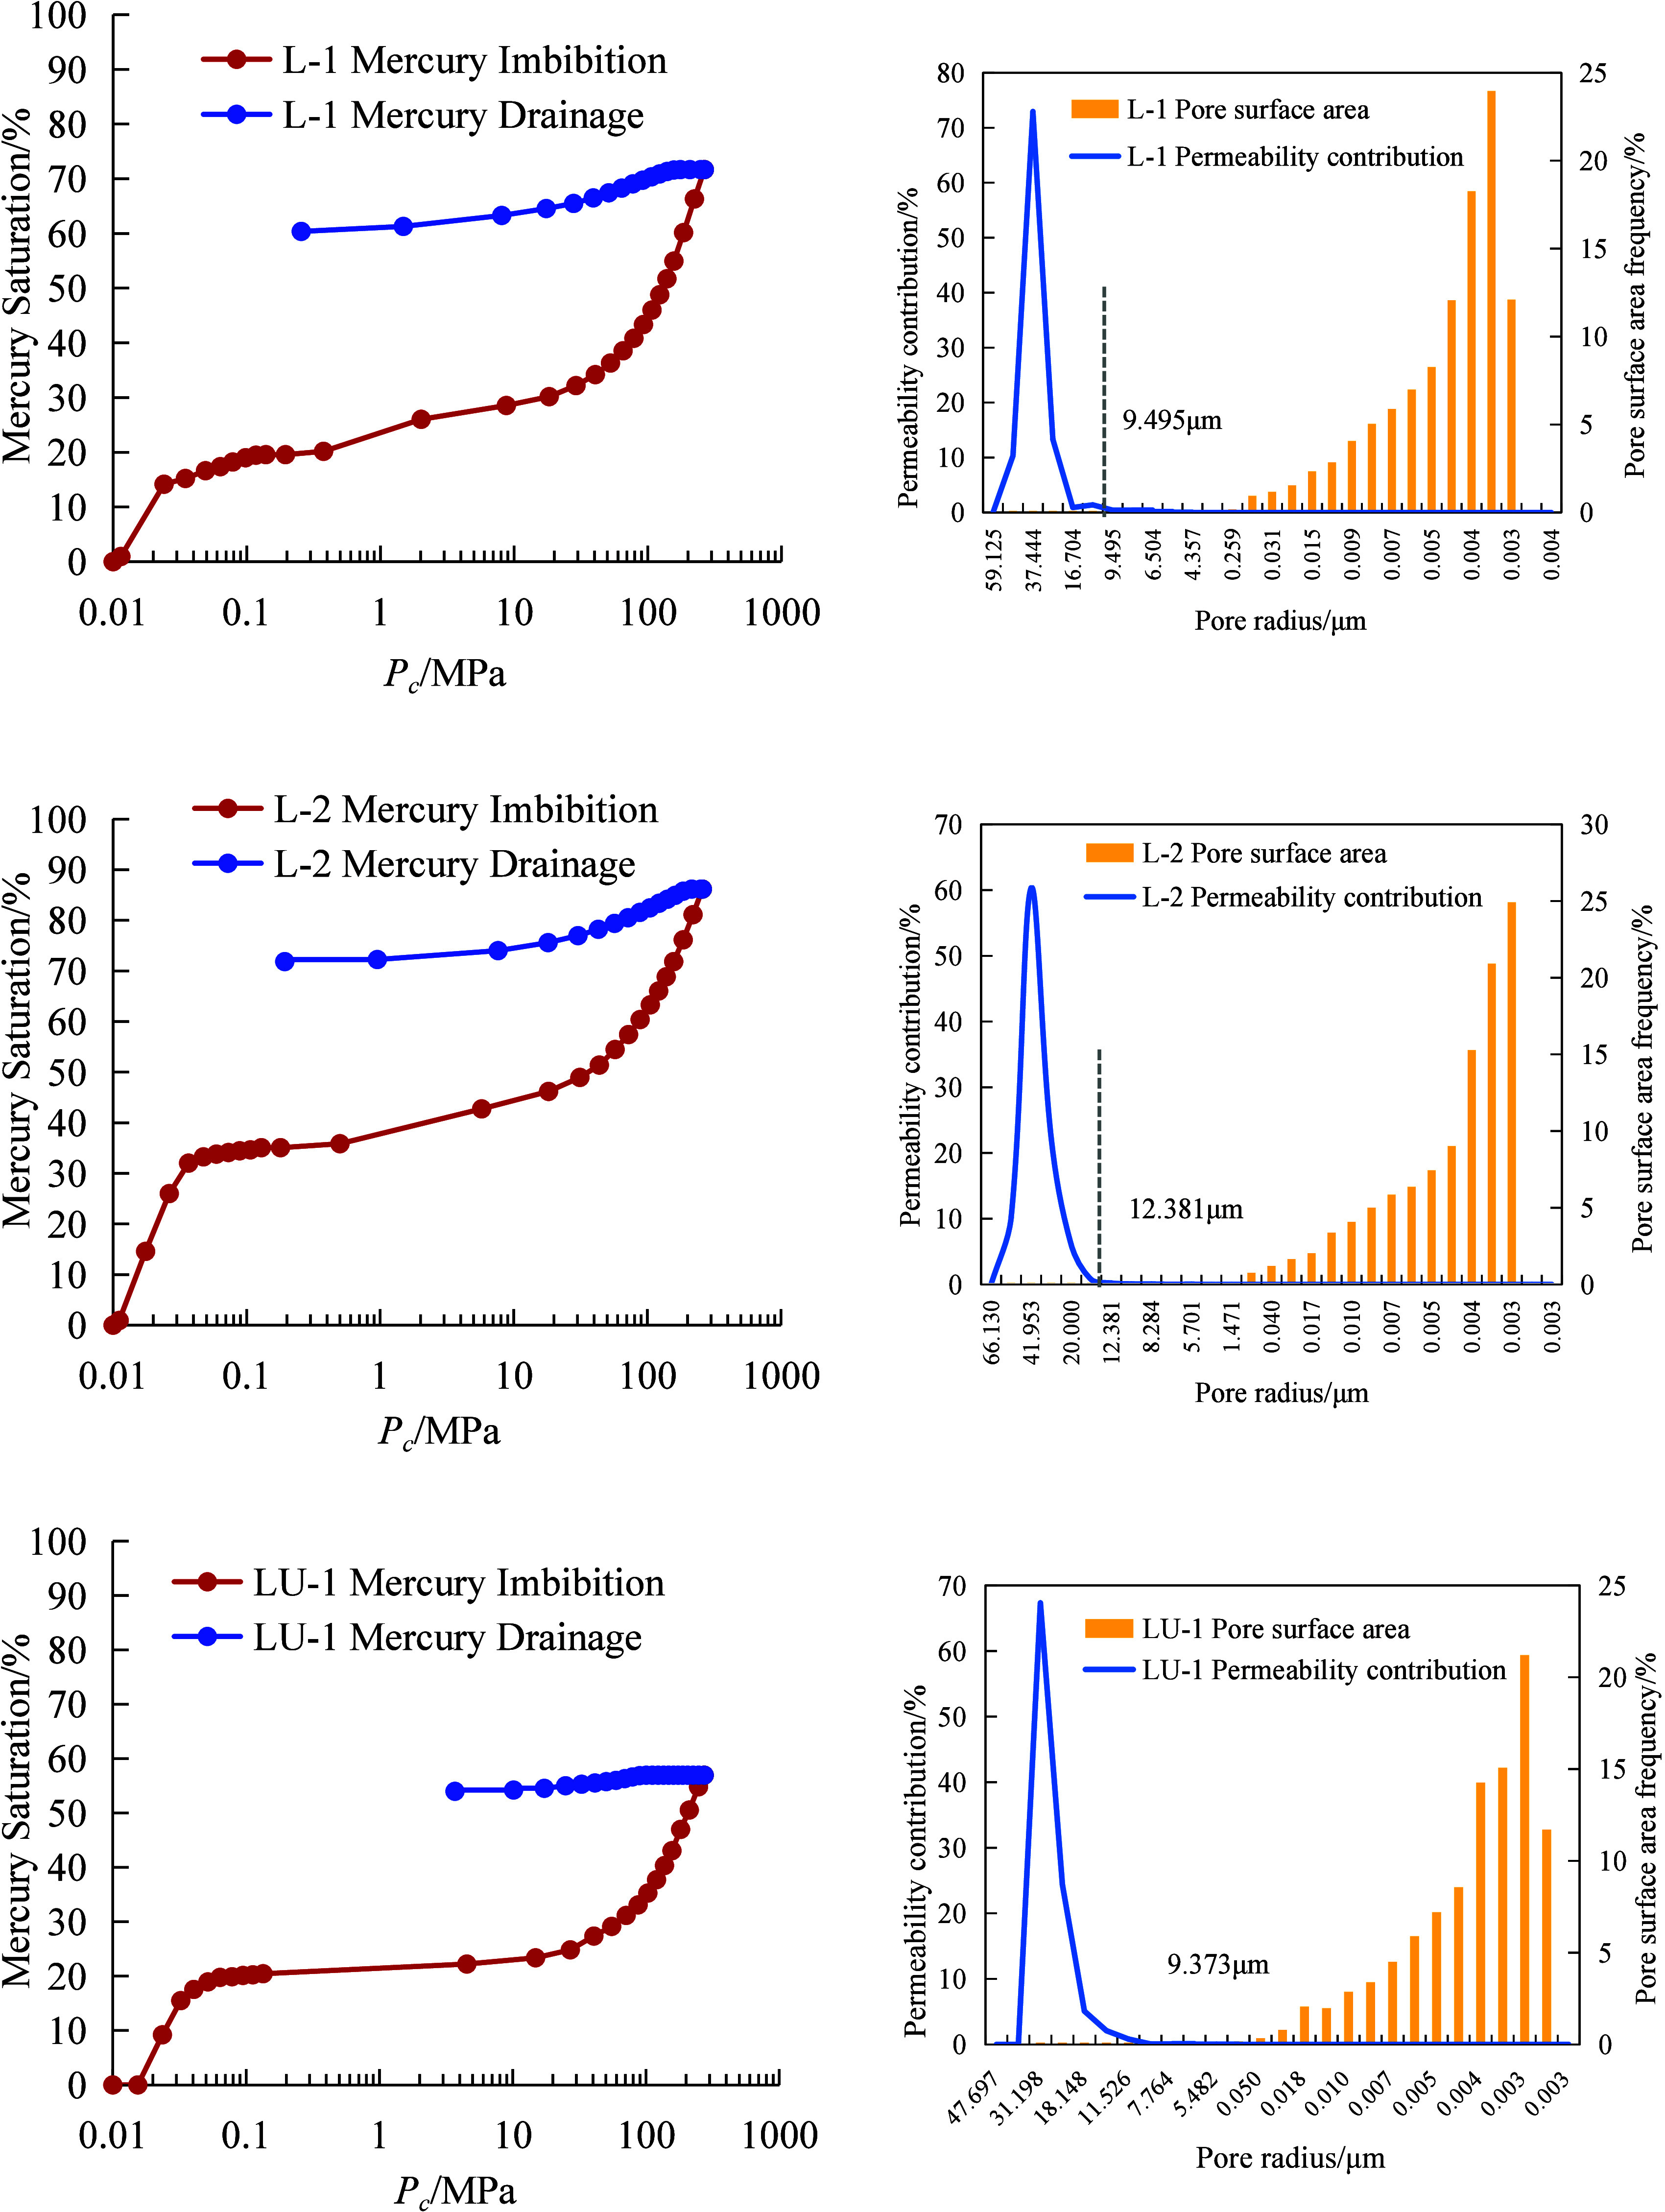
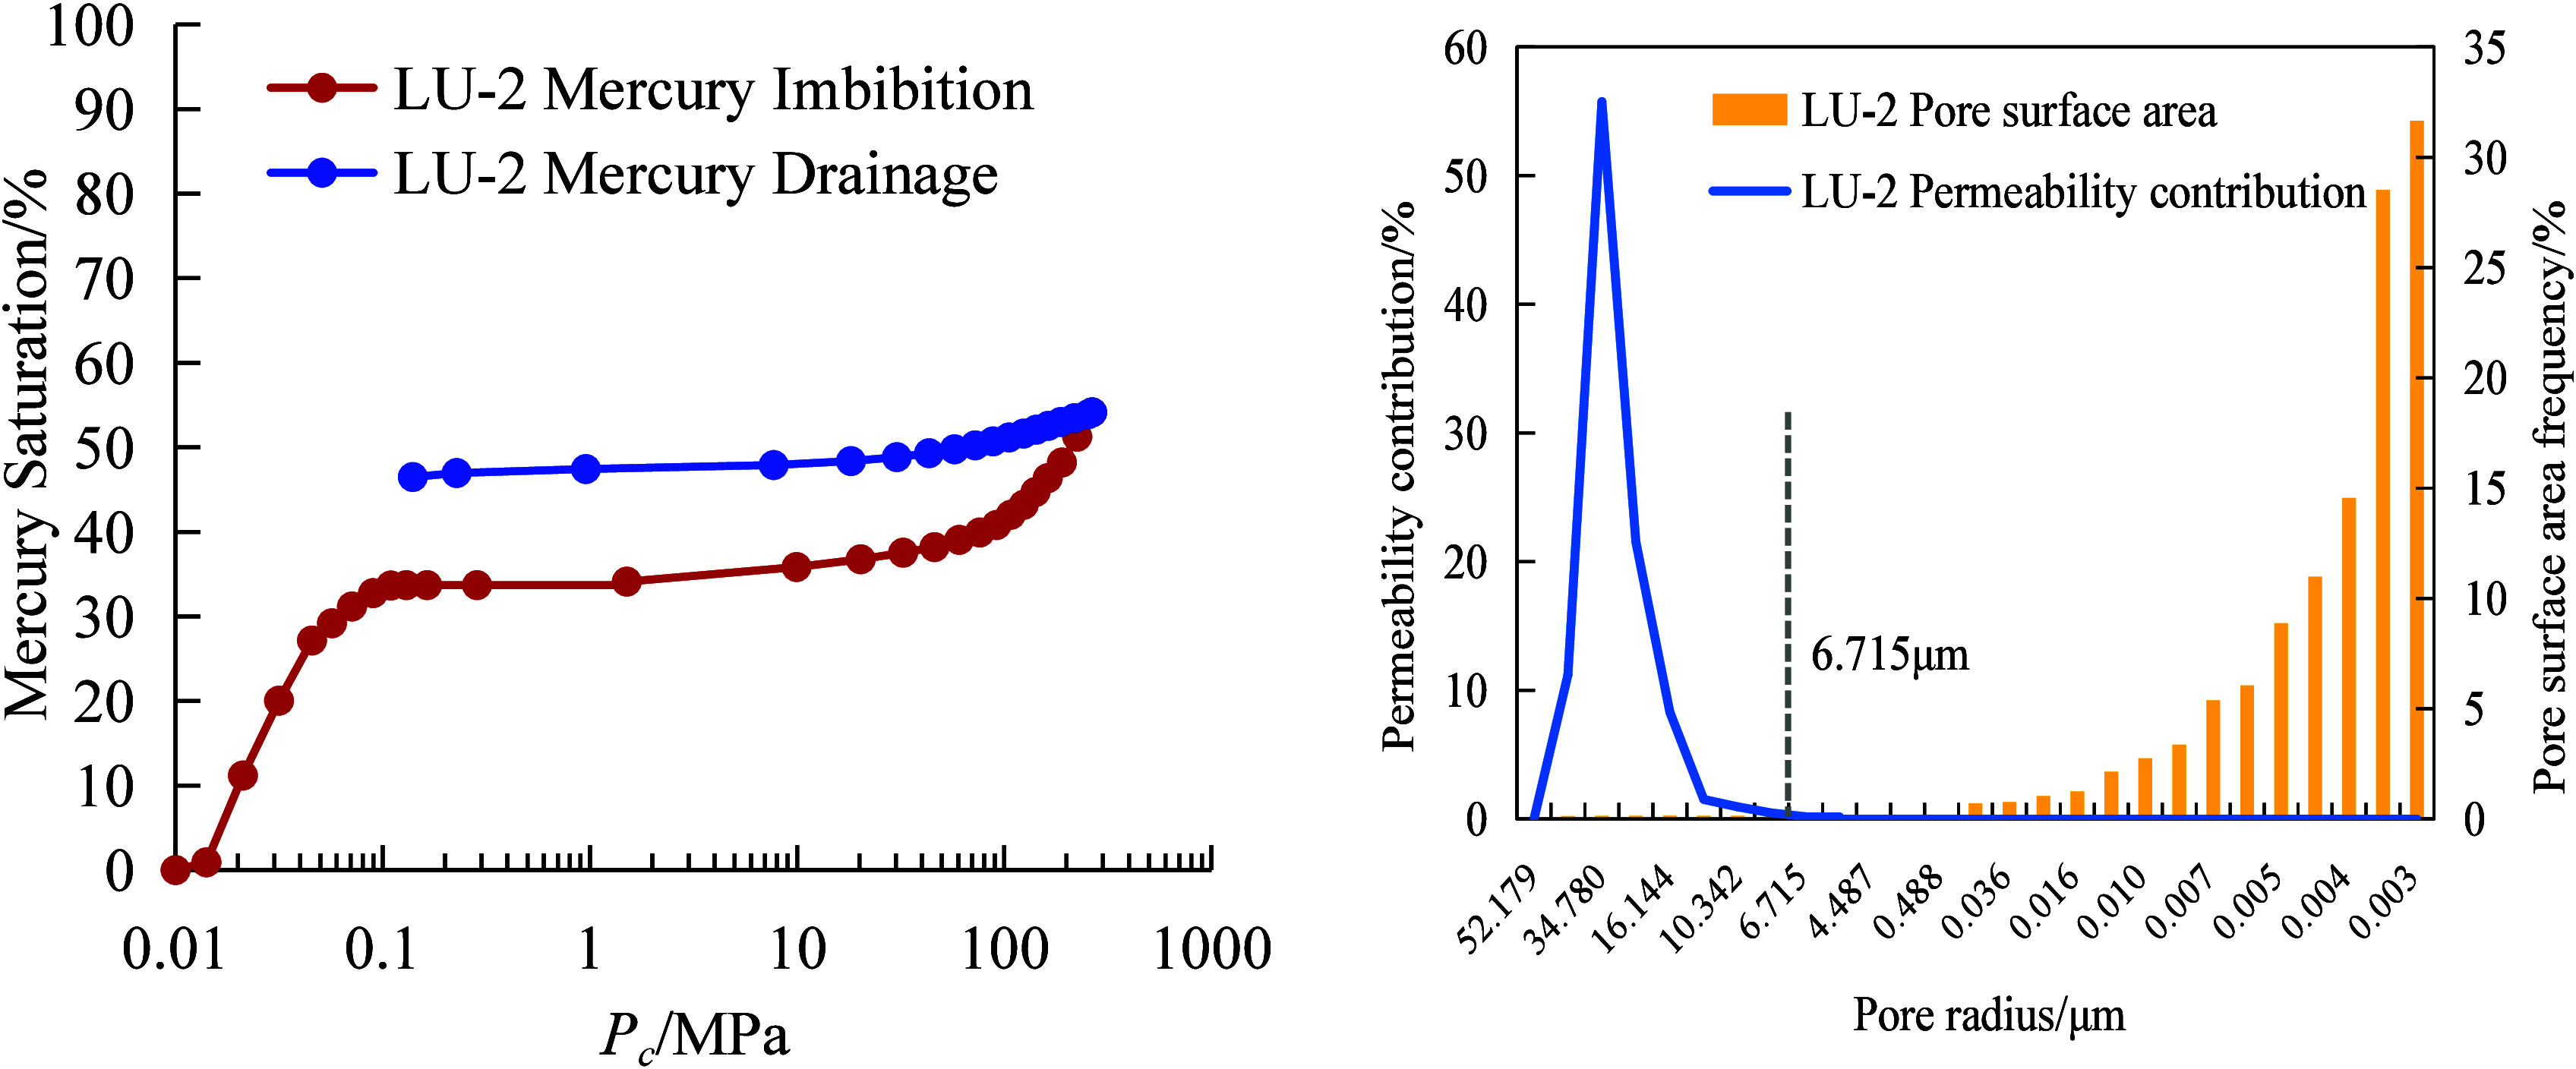
MICP capillary force curves, pore radius distribution, and permeability contribution distribution of shale samples.
Figure 10 shows the pore throat radius distribution of the sample MICP experiments. The pore throat distribution of shale is mostly bimodal, with the left peak indicating that the throat radius distribution is in the range of 0.05–2 μm and the right peak indicating that the pore radius distribution is in the range of 20–60 μm. The average pore throat radius of the samples ranges from 3.50 to 14.64 μm, with an average value of 7.19 μm. The permeability contribution mainly depends on the right peak, in which the pore throat radius in 30–35 μm has the largest contribution value.
Figure 10.
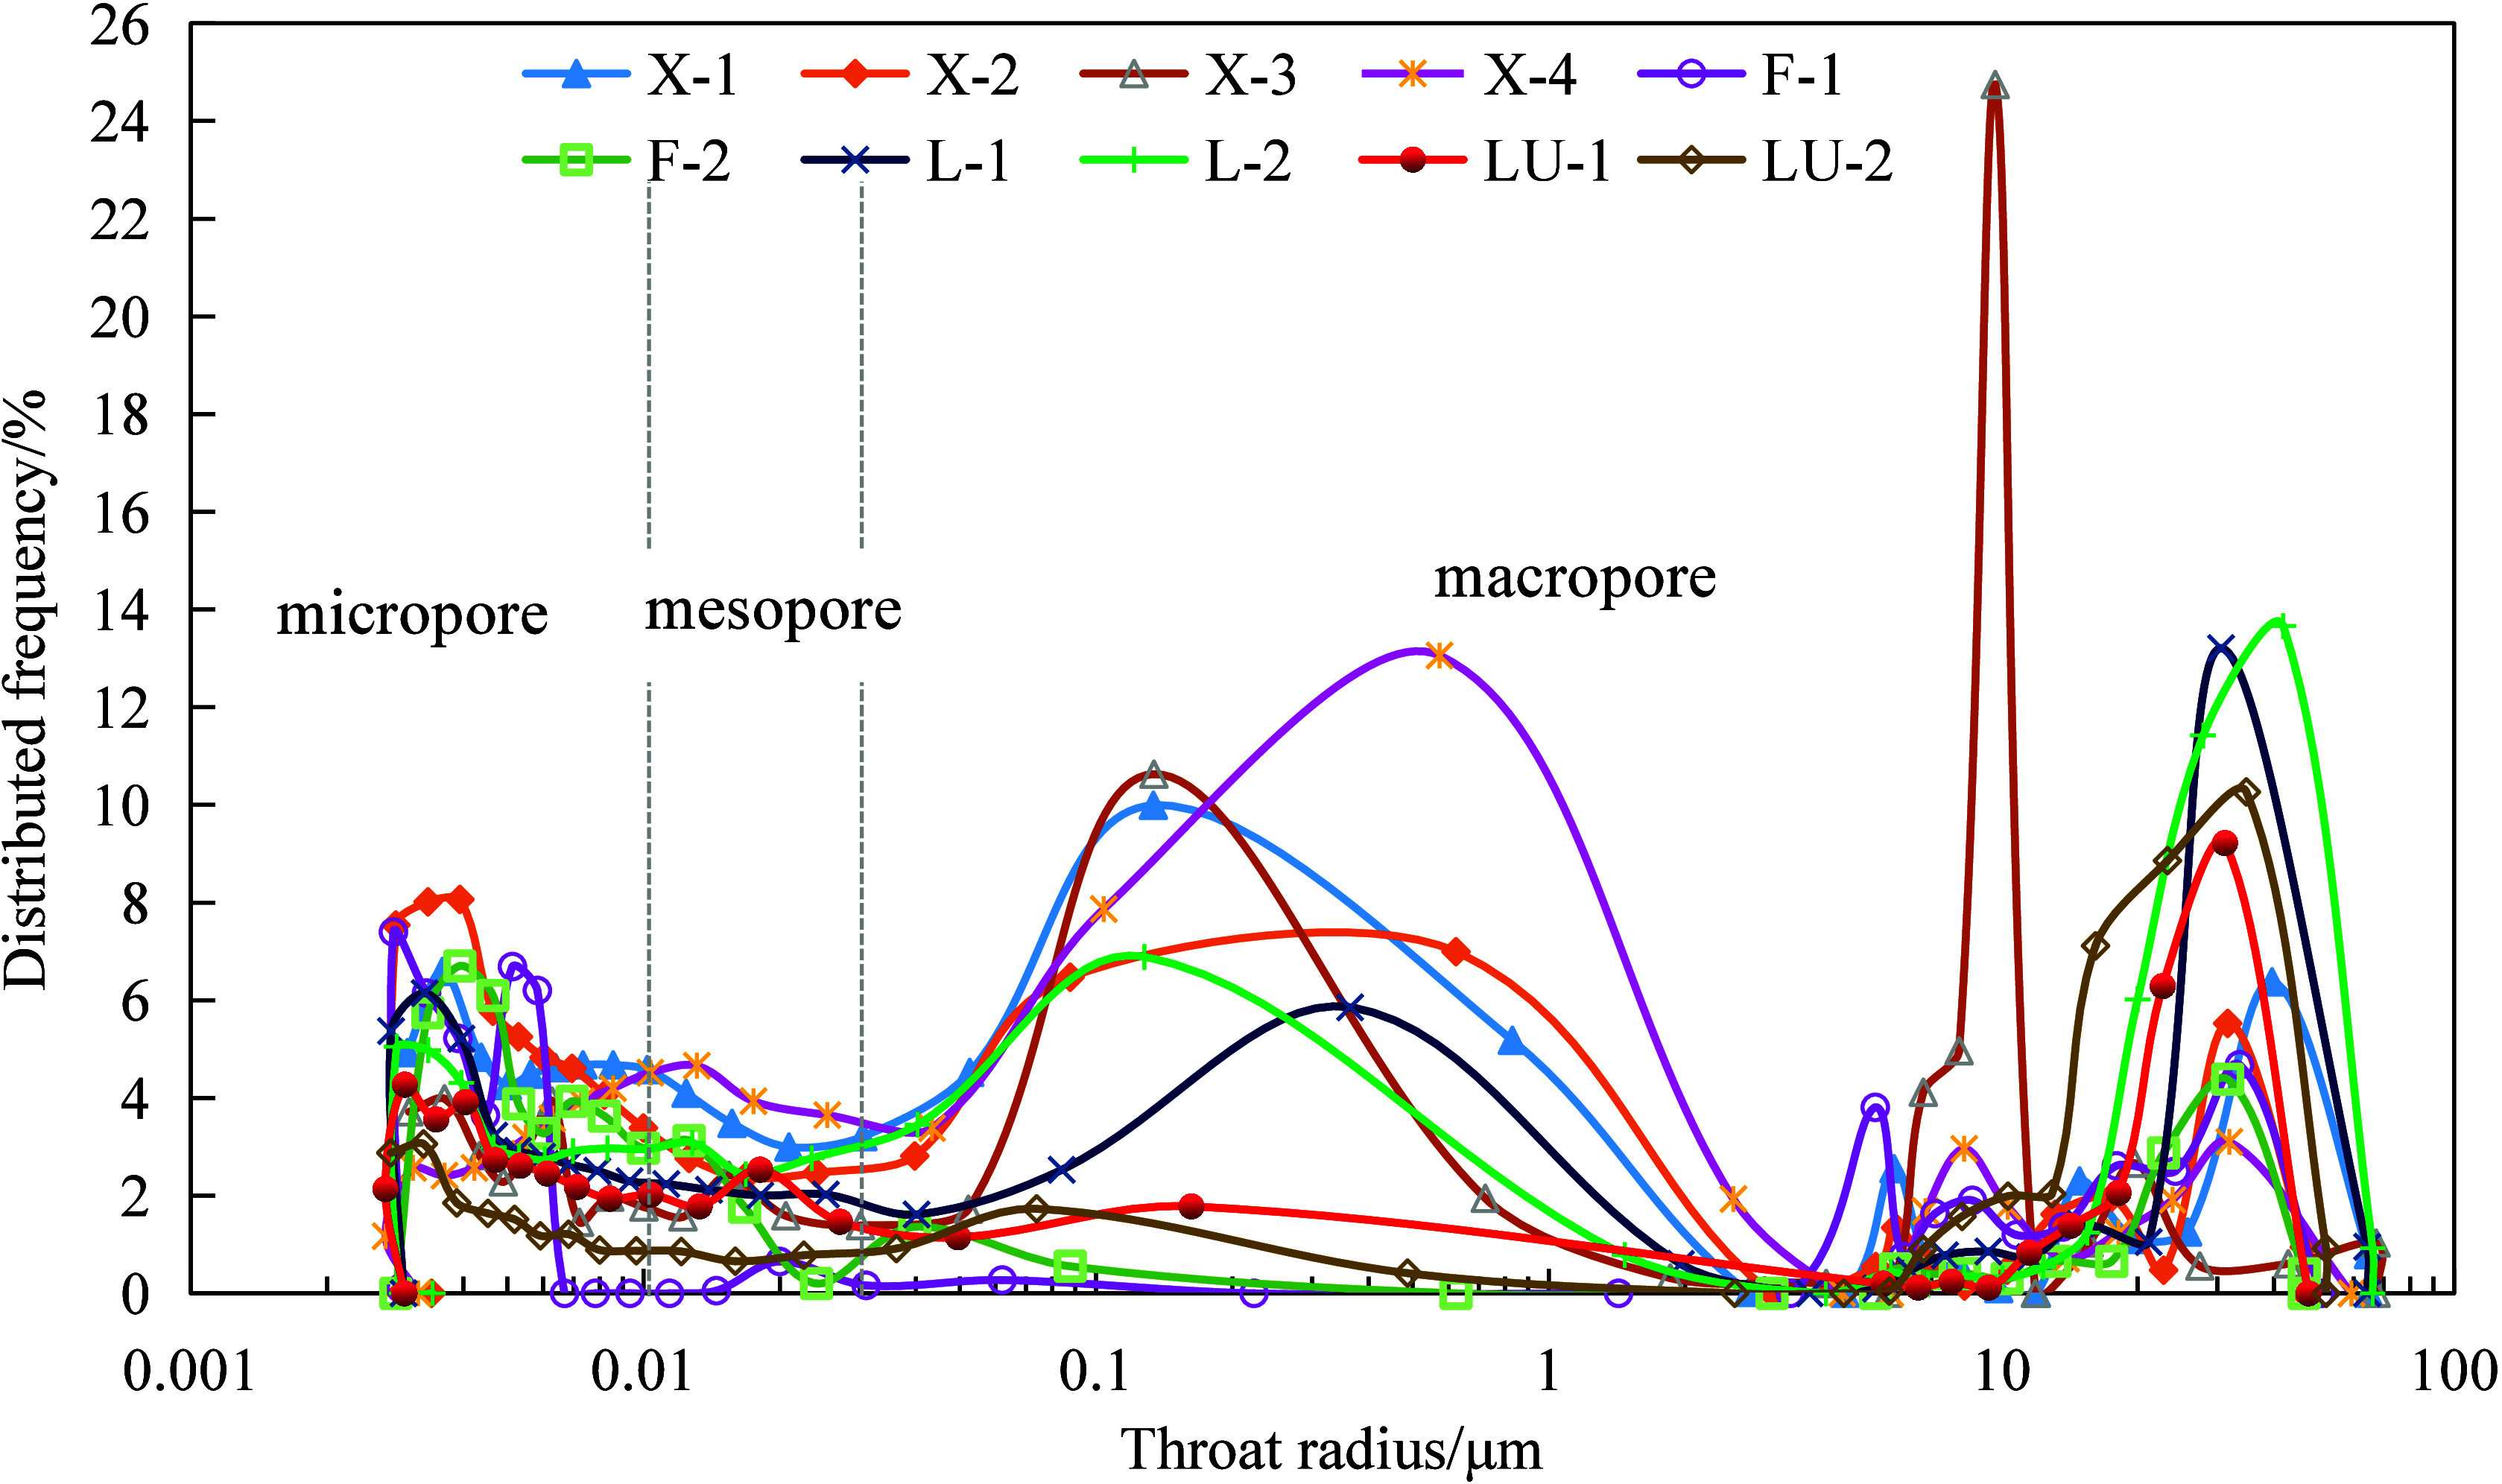
Pore throat radius distribution by MICP of shale samples.
3.3. Characteristics of Mobile Fluid Distribution
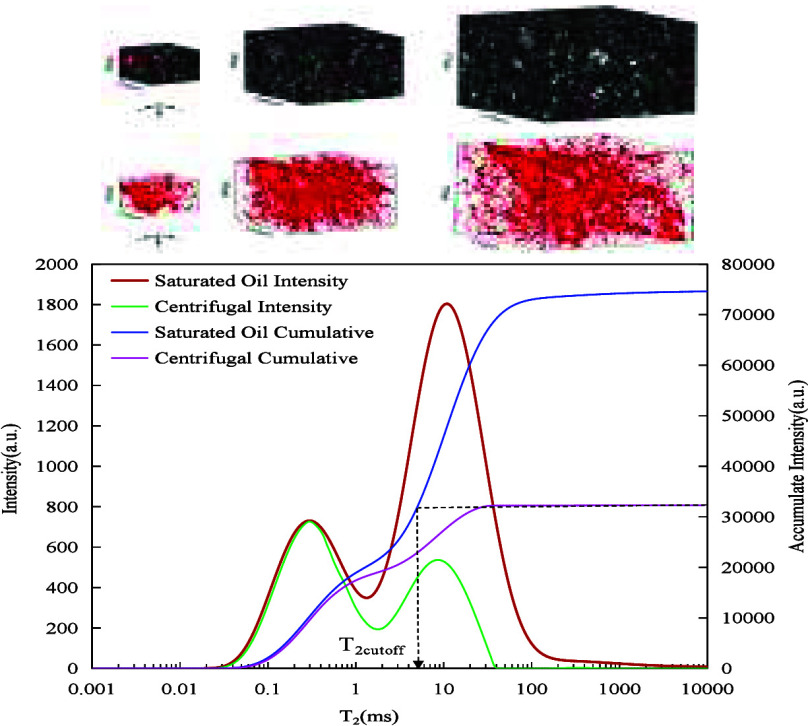
The NMR T2 spectral curves in the saturated oil state can indicate the pore throat size and volume distribution. Centrifugal technology can be employed to determine the mobile fluid saturation of shale reservoirs by facilitating the outward flow of more fluid from the pores under external force conditions. The shale sample movable oil distribution is shown in Figure 11.
Figure 11.
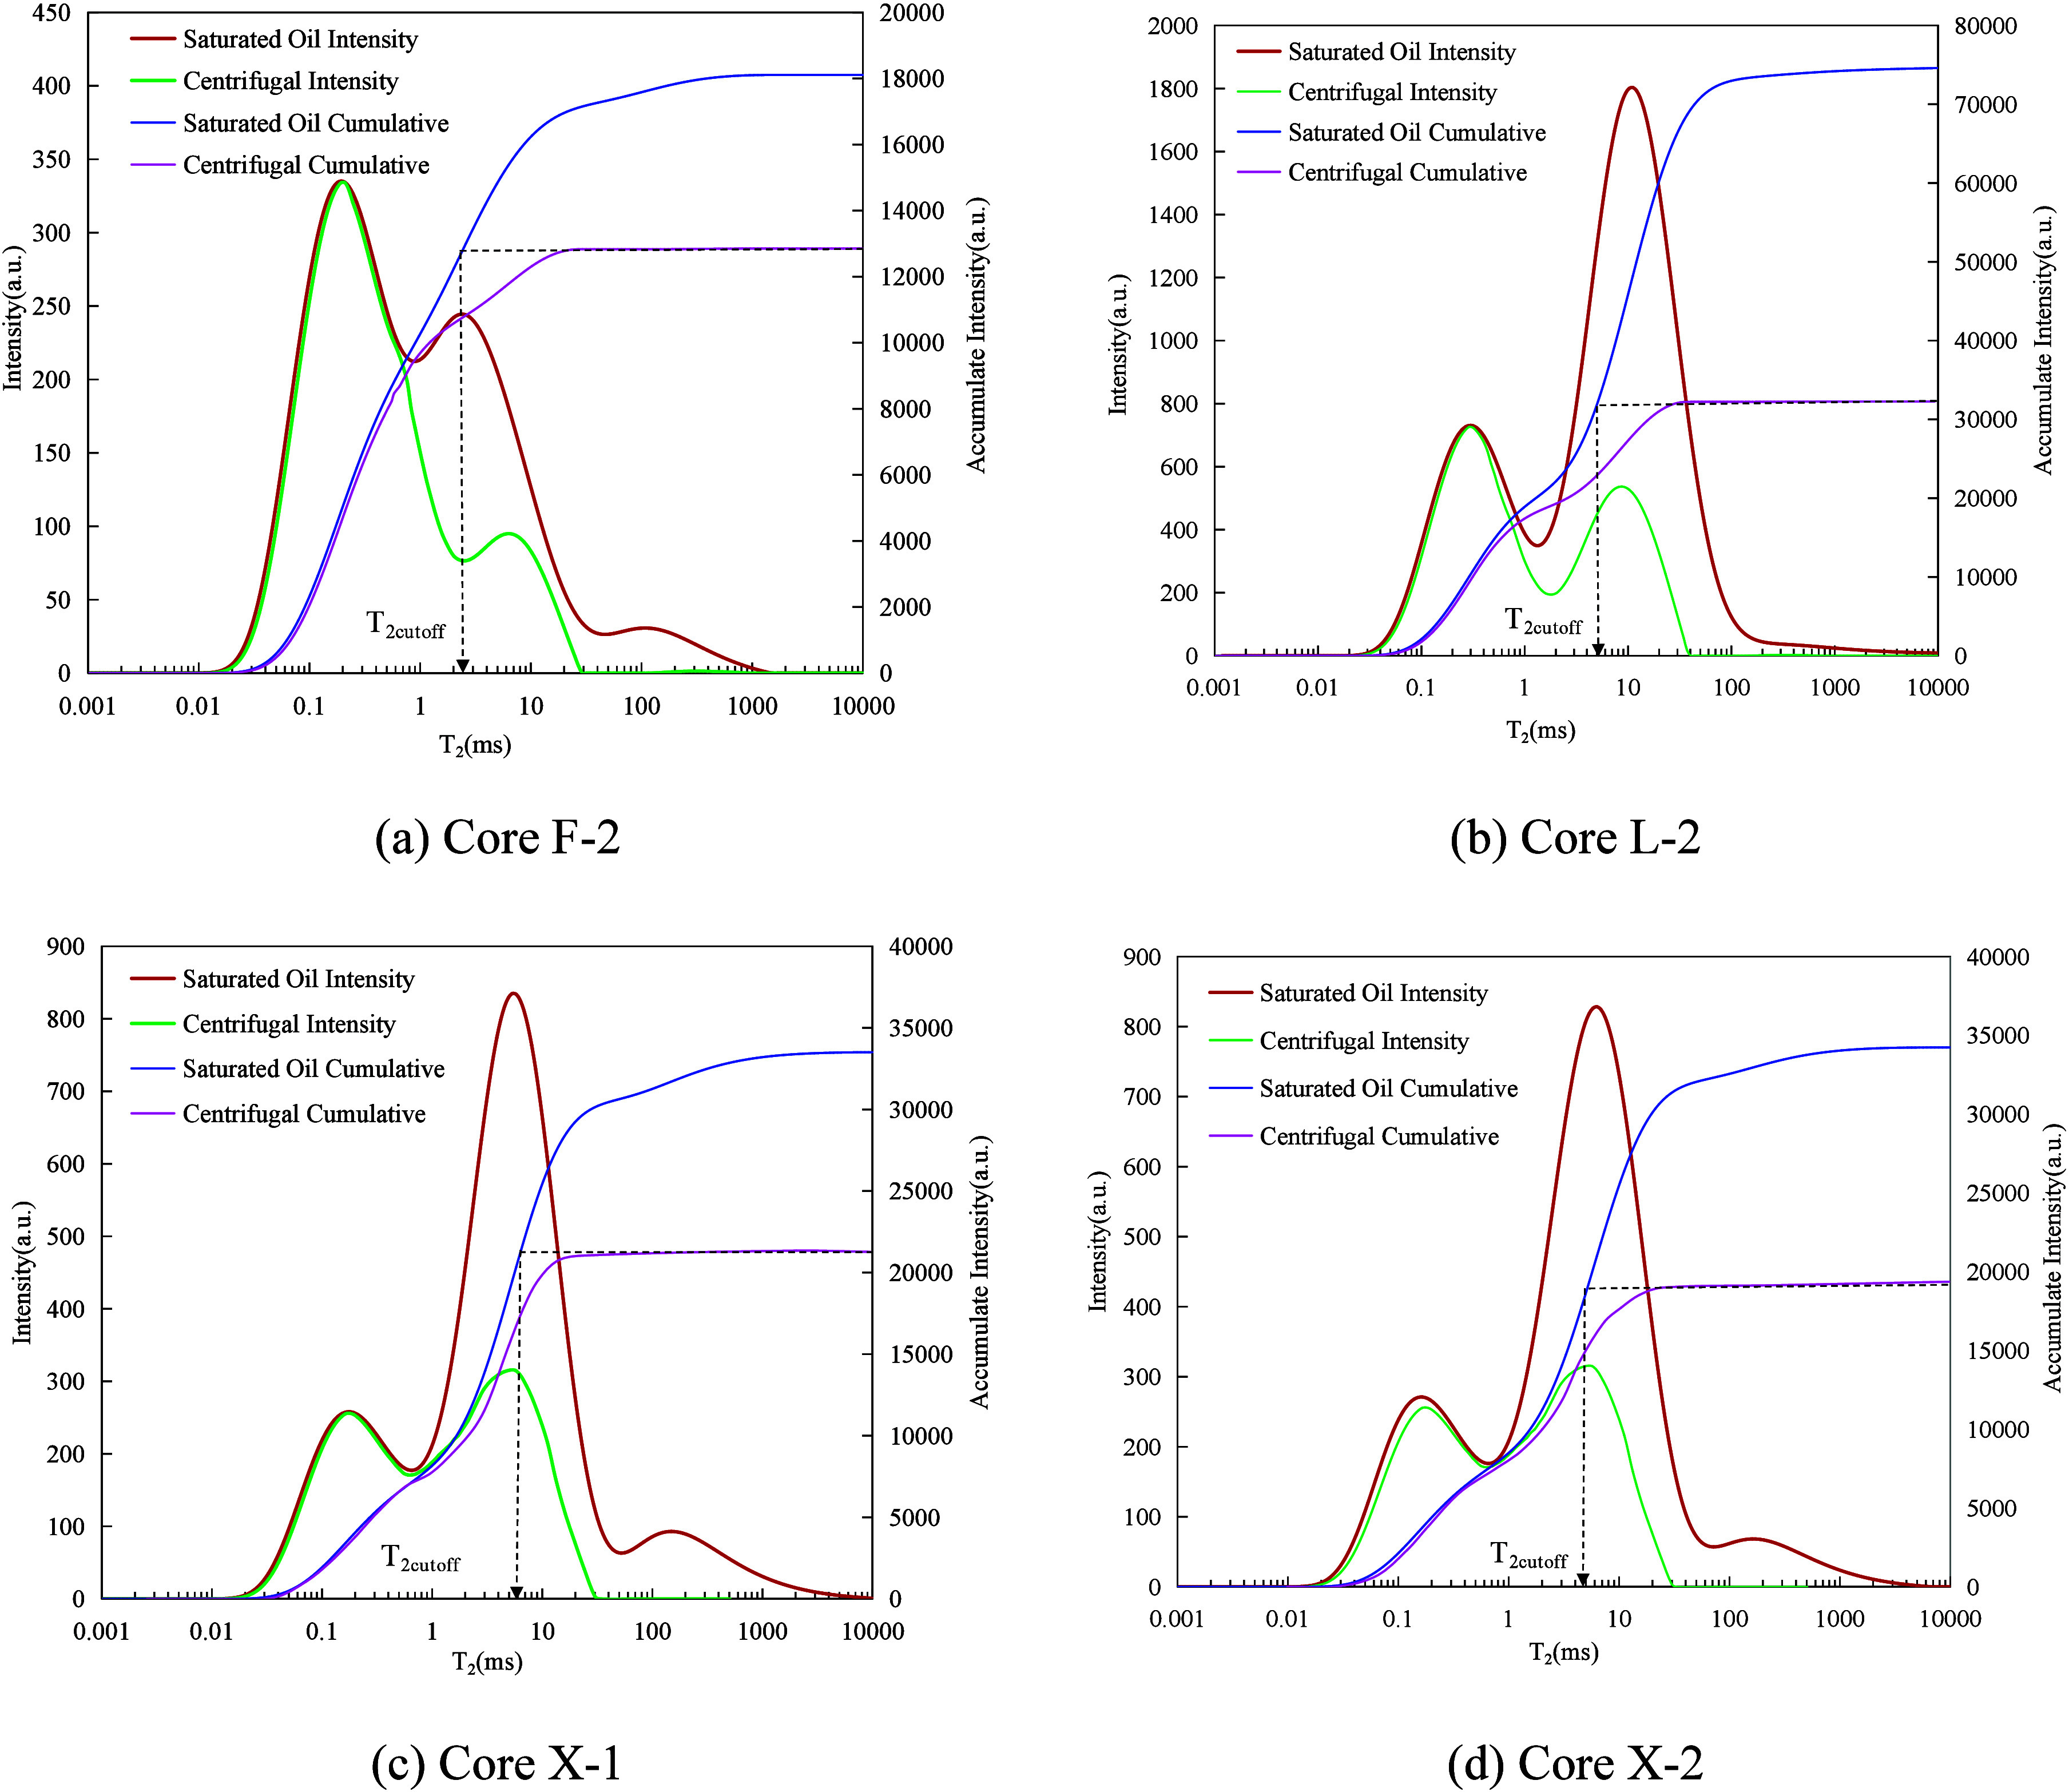
Movable oil distribution of shale samples.
Sample F-2 has 28.61% mobile fluid and a T2 cutoff value of 2.38 ms. In the saturated oil state, the T2 spectral curve shows a bimodal pattern with the left high and the right low, the T2 spectral relaxation time distribution is 48.24% in the range of less than 1 ms, 48.32% in the range of 1–100 ms, and 0.34% in the range of more than 100 ms, and the relaxation time of the main peak T2 spectral curve is 0.34 ms, which is less than the T2 cutoff value. The main peak of the T2 spectral curve remained unchanged before and after centrifugation. The right peak shows a large difference in the signal values before and after centrifugation, indicating that the proportion of large pores is small, but the throat radius is relatively large, and the fluid is mostly mobile. The influence on the fluid seepage.
The mobile fluid of sample L-2 is 44.42%, and the T2 cutoff value is 5.14 ms. In the saturated oil state, the T2 spectral curve shows a bimodal pattern with the left low and the right high, the T2 spectral curve relaxation time accounts for 25.15% in the range of less than 1 ms, 73.79% in the range of 1–100 ms, and 1.06% in the range of more than 100 ms, and the main peak T2 spectral curve relaxation time is 11.10 ms, which is larger than the T2 cutoff value. The main peak of the T2 spectral curve moves to the left before and after centrifugation, and the majority is concentrated on the left side of the cutoff value, indicating that the size of the throats connecting the large pores in core sample L-2 is large and the saturation of mobile fluids in the large pores is high.
The mobile fluid of sample X-1 is 23.59%, and the T2 cutoff value is 7.0 ms. In the saturated oil state, the T2 spectral curve shows a bimodal pattern with the left low and the right high, and the distribution of the T2 spectral relaxation time is 24.57% in the range of less than 1 ms, 69.77% in the range of 1–100 ms, and 5.65% in the range of more than 100 ms, and the relaxation time of the main peak T2 spectral curve is 5.35 ms, which is smaller than the T2 cutoff value. The change of the main peak of the T2 spectral curve before and after centrifugation is small, which indicates that there is a large amount of irreducible fluid in some large pores of the X-1 core, because the local small throats restrict the flow of fluid in large pores.
The mobile fluid of sample X-2 is 32.77%, and the T2 cutoff value is 5.35 ms. Similar to X-1, the T2 spectral curve in the saturated oil state shows a bimodal pattern with the left low and the right high, and the T2 spectral curve in the saturated oil state has a relaxation time distribution of 24.69% in the range of less than 1 ms, 71.03% in the range of 1–100 ms, and 4.28% in the range of more than 100 ms, and the relaxation time of the main peak of the T2 spectral curve is 6.29 ms, which is larger than the T2 cutoff value.
The experimental results based on NMR characterization regarding fluid mobility within the pores align with the results obtained from nitrogen adsorption and MICP experiments. The pores within shale samples L-2 and X-2 are classified as types H2–H3, with pore sizes primarily distributed within mesopores and macropores. The T2 cutoff value is relatively large, indicating a substantial portion of mobile fluid. The pores within shale samples F-2 and X-1 are classified as H2 and H3, respectively, with pore sizes predominantly concentrated in micropores and mesopores. The T2 cutoff value is relatively small, indicating a minor portion of the mobile fluid. Relevant parameters regarding mobile fluid and T2 value information on the samples in the study area are given in Table 3. The mobile fluid saturation of shale core samples is low and the T2 cutoff value is not high. The irreducible fluid primarily accumulates in small pores due to the constriction imposed by local throat radius and mineral adsorption. The T2 spectral curves before and after centrifugation exhibit significant variation within the medium and large pore range on the right side of the T2 cutoff value. This indicates that the mobile fluid predominantly occurs in medium and large pores. To sum up, the T2 spectral analysis before and after centrifugation can reveal the development potential of shale oil reservoirs and the characteristics of the remaining oil occurrences.
Table 3. Statistical Table of the T2 Value Distribution of Shahejie Formation Reservoir Samples in the Study Area before and after Centrifugation.
| sample | F-2 | L-2 | X-1 | X-2 |
|---|---|---|---|---|
| T2-cutoff (ms) | 2.38 | 5.14 | 7.01 | 5.35 |
| mobile fluid saturation (%) | 28.61 | 44.42 | 23.59 | 32.77 |
4. Conclusions
In this study, focusing on the Paleogene Shahejie Formation in Bohai Bay, digital core models of different sizes were created to analyze the pore structure and mobility characteristics of shale reservoirs by techniques such as CT, nitrogen adsorption, MICP, and NMR. The conclusions are as follows:
-
1.
The analysis of digital core models of different sizes based on X-ray CT shows that the minimum REV edge length is 380 μm, the pore radius of the shale reservoirs is in the range of 0.5–65 μm, and the pore coordination number is concentrated in the range of 1–4.
-
2.
Based on the experimental data of MICP and nitrogen adsorption, the shale pores mainly manifest as ink-bottle-shaped pores, transition-shaped pores, and flat plate slit-shaped pores, with ink-bottle-shaped pores being predominant, and the specific surface area and pore volume are mainly attributed to mesopores and macropores. Among the macropores, those with a radius of 30–35 μm make the most significant contribution to the permeability.
-
3.
Based on the NMR experimental data, the mobile fluid saturation of the shale reservoirs is distributed between 23.59 and 44.42%, with an average mobile fluid saturation of 32.35%, the pore throat size ranges between 0.001 and 6 μm, and the mobile fluid porosity primarily ranges between 0.84% and 4.08%, with an average mobile fluid porosity of 2.37%.
Acknowledgments
This work is supported by the China National Science and Technology Projects (2016ZX05012-002-002) and Northeast Petroleum University “National Fund” Foundation Project (2018GPYB-02).
The authors declare no competing financial interest.
References
- Liu H.; Bao Y.; Zhang S.; et al. Structural characteristics of continental carbonate-rich shale and shale oil movability: A case study of the Paleogene Shahejie Formation shale in Jiyang Depression, Bohai Bay Basin, China. Petroleum Exploration and Development 2023, 50 (6), 1–12. [Google Scholar]
- Sun H.; Li T.; Li Z.; et al. Shale oil redistribution-induced flow regime transition in nanopores. Energy 2023, 282, 128553. 10.1016/j.energy.2023.128553. [DOI] [Google Scholar]
- Zhang S.; Song S.; Zhang W.; et al. Research on the inherent mechanism of rock mass deformation of oil shale in-situ mining under the condition of thermal-fluid-solid coupling. Energy 2023, 280, 128149. 10.1016/j.energy.2023.128149. [DOI] [Google Scholar]
- Wei J.; Zhang A.; Li J.; et al. Study on microscale pore structure and bedding fracture characteristics of shale oil reservoir. Energy 2023, 278, 127829. 10.1016/j.energy.2023.127829. [DOI] [Google Scholar]
- Wu Y.; Liu C.; Jiang F.; et al. Geological characteristics and shale oil potential of alkaline lacustrine source rock in Fengcheng Formation of the Mahu Sag, Junggar Basin, Western China. J. Pet. Sci. Eng. 2022, 216, 110823. 10.1016/j.petrol.2022.110823. [DOI] [Google Scholar]
- Chalmers G. R.; Bustin R. M.; Power I. M. Characterization of gas shale pore systems by porosimetry, pycnometry, surface area, and field emission scanning electron microscopy/transmission electron microscopy image analyses: Examples from the Barnett, Woodford, Haynesville, Marcellus, and Doig unit. AAPG Bulletin 2012, 96 (6), 1099–1119. 10.1306/10171111052. [DOI] [Google Scholar]
- Slatt E. M.; O Neal N. R. Pore types in the Barnett and Woodford gas shales: Contribution to understanding gas storage and migration pathways in fine-grained rocks. AAPG Bulletin 2011, 95 (12), 2017–2030. [Google Scholar]
- Schmitt M.; Fernandes C. P.; da Cunha Neto J A B.; et al. Characterization of pore systems in seal rocks using nitrogen Gas Adsorption combined with Mercury Injection Capillary Pressure techniques. Marine and Petroleum Geology 2013, 39 (1), 138–149. 10.1016/j.marpetgeo.2012.09.001. [DOI] [Google Scholar]
- Zhao H. Q.; Macdonald I. F.; Kwiecien M. J. Multi-orientation scanning: a necessity in the identification of pore necks in porous media by 3D computer reconstruction from serial section data. J. Colloid Interface Sci. 1994, 162 (2), 390–401. 10.1006/jcis.1994.1053. [DOI] [Google Scholar]
- Delerue J. F.; Perrier E. DXSoil, a library for 3D image analysis in soil science. Computers & Geosciences 2002, 28 (9), 1041–1050. 10.1016/S0098-3004(02)00020-1. [DOI] [Google Scholar]
- Sheppard A P.; Sok R. M.; Averdunk H.. Improved Pore Network Extraction Methods; International Symposium of the Society of Core Analysts, 2005; p 2125. [Google Scholar]
- Al-Kharusi A. S.; Blunt M. J. Network extraction from sandstone and carbonate pore space images. J. Pet. Sci. Eng. 2007, 56 (4), 219–231. 10.1016/j.petrol.2006.09.003. [DOI] [Google Scholar]
- Dou L. R.; Cheng D. S.; Wang J. C.; et al. Petroleum systems of the Bongor Basin and the Great Baobab Oilfield, Southern Chad. Journal of Petroleum Geology 2020, 43 (3), 301–321. 10.1111/jpg.12767. [DOI] [Google Scholar]
- Wen J.; Hu Q. Shale Reservoir Characteristics and Shale Oil Mobility in Member 2 of Kongdian Formation of Cangdong Sag Bohai Bay Basin. Special oil & gas reservoirs 2023, 30 (04), 63–70. [Google Scholar]
- Huang X.; Zhao Y. P. Evolution of pore structure and adsorption-desorption in oil shale formation rocks after compression. Energy 2023, 278, 127913. 10.1016/j.energy.2023.127913. [DOI] [Google Scholar]
- Lei J. I.; Pan B.; Guo Y. H. A comprehensive analysis of the pyrolysis effects on oil shale pore structures at multiscale using different m easurement m ethods. J. Energy 2021, 227, na. 10.1016/j.energy.2021.120359. [DOI] [Google Scholar]
- Liu K.; Ostadhassan M.; Sun L.; Zou J.; Yuan Y.; Gentzis T.; et al. A comprehensive pore structure study of the Bakken Shale with SANS, N2 adsorption and mercury intrusion. Fuel 2019, 245, 274–85. 10.1016/j.fuel.2019.01.174. [DOI] [Google Scholar]
- Zheng H.; Yang F.; Guo Q.; et al. Multi-scale pore structure, pore network and pore connectivity of tight shale oil reservoir from Triassic Yanchang Formation, Ordos Basin. J. Pet. Sci. Eng. 2022, 212, 110283. 10.1016/j.petrol.2022.110283. [DOI] [Google Scholar]
- Jingjing G.; Dihe W.; Panrong W.; et al. Pore Structure of Low-permeability Reservoir and Distribution Characteristics of Remaining Oil after Water Flooding Based on Digital Core. Special oil & gas reservoirs 2023, 30 (02), 101–108. [Google Scholar]
- Wang B.; Liu B.; Yang J.; et al. Compatibility characteristics of fracturing fluid and shale oil reservoir: A case study of the first member of Qingshankou Formation, northern Songliao Basin, Northeast China. J. Pet. Sci. Eng. 2022, 211, 110161. 10.1016/j.petrol.2022.110161. [DOI] [Google Scholar]
- Gao H.; Sun W.; Tian Y. H.; et al. Application of NMR technique in evaluation of micro-pore structure in extra-low permeability sandstone. Progress in Geophys 2011, 26 (1), 294–299. [Google Scholar]
- Zhong-hao W.; Cheng-guang Z.; Cheng-wen X.; et al. Experimental Study of T2-cutoff values in low-permeability reservoirs. Progress in Geophys.(in Chinese) 2004, 03, 652–655. [Google Scholar]
- Yan J. P.; He X.; Zhang S. L. Sensitive parameters of NMR T2 spectrum and their application to pore structure characterization and evaluation in logging profile: A case study from Chang 7 in the Yanchang Formation Heshui area Ordos Basin NW China. Marine an Petroleum Geology 2020, 111, 230–239. [Google Scholar]
- BAI S. T.; CHENG D. J.; WAN J. B. Quantitative characterization of sandstone NMR T2 spectrum. Acta Petrolei Sinica 2016, 37 (3), 382–414. [Google Scholar]
- LI J.; JIN W. J.; WANG L. Quantitative evaluation of organic and inorganic pore size distribution by NMR:A case from the Silurian Longmaxi Formation gas shale in Fuling area Sichuan Basin. Acta Petrolei Sinica 2016, 37 (1), 129–134. [Google Scholar]
- WANG W. M.; GUO H. K.; YE Z. H. Evaluation of development potential of low permeability oilfield by using nuclear magnetic resonance movable fluid. Acta Petrolei Sinica 2001, (06), 40–44. [Google Scholar]
- Lei J. I.; Pan B z.; Guo Y. H. A comprehensive analysis of the pyrolysis effects on oil shale pore structures at multiscale using different m easurement m ethods. Energy 2021, 227, na. [Google Scholar]
- SUN Y. Review of the Application of Nuclear Magnetic Resonance in the Evaluation of Shale Reservoir Parameters. Progress in Geophysics 2023, 38 (01), 254–270. [Google Scholar]
- Zhang W.; Feng Q.; Wang S.; et al. Pore network modeling of oil and water transport in nanoporous shale with mixed wettability. J. Pet. Sci. Eng. 2022, 209, 109884. 10.1016/j.petrol.2021.109884. [DOI] [Google Scholar]
- Linjie Z.; LU J.; WANG B.; et al. Segmented prediction of TOC based on lithology: a case study of the lower sub-member of the third member of the Eocene Shahejie Formation,Dongying Sag,Bohai Bay Basin. Petroleum Geology & Experiment 2021, 43 (04), 721–727. [Google Scholar]
- Xianzheng Z.; Lihong Z.; Xiugang P. U. Geological characteristics and exploration breakthrough of shale oil in Member 3 of Shahejie Formation of Qibei subsag,Qikou sag. Acta Petrolei Sinica 2020, 41 (6), 643–657. [Google Scholar]
- Li Z.; Liu D.; Cai Y. Adsorption pore structure and its fractal characteristics of coals by N 2 adsorption/desorption and FESEM image analyses. Fuel 2019, 257, na. [Google Scholar]
- Loucks R. G.; Reed R. M.; Ruppel S. C.; et al. Spectrum of pore types and networks in mud rocks and a descriptive classification for matrix-related mud rock pores. AAPG bulletin 2012, 96 (6), 1071–1098. 10.1306/08171111061. [DOI] [Google Scholar]


