

Abstract
Traumatic experiences have the potential to give rise to post-traumatic stress disorder (PTSD), a debilitating psychiatric condition associated with impairments in both social and occupational functioning. There has been great interest in utilizing machine learning approaches to predict the development of PTSD in trauma patients from clinician assessment or survey-based psychological assessments. However, these assessments require a large number of questions, which is time consuming and not easy to administer. In this paper, we aim to predict PTSD development of patients 3 months post-trauma from multiple survey-based assessments taken within 2 weeks post-trauma. Our objective is to minimize the number of survey questions that patients need to answer while maintaining the prediction accuracy from the full surveys. We formulate this as a feature selection problem and consider 4 different feature selection approaches. We demonstrate that it is possible to achieve up to 72% accuracy for predicting the 3-month PTSD diagnosis from 10 survey questions using a mean decrease in impurity-based feature selector followed by a gradient boosting classifier.
Keywords: Survey optimization, PTSD prognosis, Feature selection, Mean decrease in impurity, Gradient boosting, Random forest
1. Introduction
Post-traumatic stress disorder (PTSD) is a complex somatic, cognitive, affective and behavioral disorder that emerges in response to traumatic life events. PTSD is characterized by intrusive thoughts, nightmares and flashbacks of past traumatic events, avoidance of reminders of trauma, hypervigilance, and sleep disturbance, all of which lead to considerable social, occupational, and interpersonal dysfunction [2].
Diagnosis of PTSD requires patients to undergo expensive and time consuming clinical tests with specialists. On the other hand, traditional survey-based psychological assessments are relative inexpensive and easy to administer. We consider the possibility of training a machine learning (ML) algorithm to predict the PTSD diagnosis from the clinician using the survey data rather than having patients frequently go through structured clinical interviews. However, these surveys can become very long and repetitive for patients and lead to fatigue.
In this study, we design a shortened survey that enables an ML algorithm to predict the PTSD diagnosis, ideally with a similar level of accuracy as using a full survey. We formulate this survey minimization task as a feature selection problem, where patients’ responses to different survey questions are treated as the features. We explore four different approaches for feature selection: stability selection using the LASSO, two variants of mean decrease in impurity (MDI)-based selection, and a maximum depth limitation approach.
We find that an MDI-based feature selector followed by a gradient boosting classifier is able to predict the PTSD diagnosis of patients 3 months post-trauma with up to 72% accuracy using 10 questions from surveys taken within 2 weeks post-trauma. Importantly, we find that this level of accuracy is comparable to or even higher than the accuracy we obtain when training ML algorithms on the full survey data, indicating that we can minimize the survey to 10 questions without losing prediction accuracy.
2. Background
2.1. Feature Selection for Machine Learning Algorithms
The objective of a supervised ML algorithm is to accurately predict a target y given a feature vector x representing an object. Given a set of training examples {x1, x2, …, xn} and associated targets {y1, y2, …, yn}, an ML algorithm learns a function f such that, for a new test example x*, f(x*) is a good predictor of its target y*. In the context of this paper, the object would be a patient, the target would be the patient’s PTSD diagnosis, and the feature vector denotes relevant information about the patient, such as the patient’s age, sex, and responses to survey questions. Each subject is diagnosed as either PTSD or non-PTSD; in this setting, the ML algorithm is a binary classifier, and the target is a label.
It is often the case that the entire feature vector x may not be necessary to learn a good predictor f(x). For example, some of the features may be irrelevant for predicting the label y. Feature selection algorithms aim to select a subset of features to use to train the ML model. They are used to discard irrelevant features from a classifier and result in a smaller model. They may also result in higher classification accuracy in some instances.
A variety of feature selection algorithms are often employed for training ML models. Some are generic “wrapper” algorithms that can be applied to any ML model, including greedy algorithms such as forward and backward subset selection [1]. Others have been designed specifically for a class of ML models. For example, the LASSO [24] is designed specifically for feature selection in linear predictors, such as linear and logistic regression. It is sometimes used to perform feature selection when using other non-linear machine learning algorithms. A related feature selection approach is stability selection, where a feature selector such as LASSO is repeatedly applied to randomly sampled subsets of data [18]. The features that are selected most frequently in the random subsets are then chosen as the features used to train the ML model.
2.2. Related Work
The related work most relevant to this paper focuses on survey optimization. In a survey optimization study, researchers employed a LASSO regression model to best approximate the five most effective questions to put in their survey about women’s agency. They trained 1,000 LASSO regressions, each on a random 50% of the data, and tracked which features were selected by each model. Then, they chose the 5 most frequently selected features (i.e., survey questions) to use in their optimized survey [13], which is a form of stability selection. Their study aimed to find exactly 5 features, but it is possible to extend their ideas to find the optimal balance between relevant features and survey accuracy, which is our focus. A similar approach was employed for household poverty classification in [14], resulting in a survey with 10 questions. Finally, another related approach for survey optimization formulates the problem as a Markov Decision Process where possible actions are questions we can ask, states are the known answers, and the reward function is how well the current state can predict the outcome [15].
3. Data Description
3.1. Participants
We consider data collected from a longitudinal neuroimaging study [12,25] on adult trauma survivors who seek medical treatment. Participants completed initial evaluation regarding behavioral and clinical symptoms using questionnaires within 2 weeks post-trauma and underwent a clinical interview for PTSD diagnosis (CAPS-5) at 3 months post-trauma. The study was approved by the University of Toledo Institutional Review Board protocol #201575. All participants provided written informed consent and received monetary compensation for their participation in the study. Summary statistics about the participants are shown in Table 1.
Table 1.
Demographic and trauma-related information on the 144 participants.
| Information | Mean (SD) or Number (%) |
|---|---|
| Age | 33.2 (10.8) |
| Sex (Female) | 98 (68.1%) |
| Trauma type | |
| Motor vehicle accident | 79 (54.9%) |
| Physical assault | 53 (36.8%) |
| Sexual assault | 8 (5.6%) |
| Other | 4 (2.8%) |
| PTSD at 3 months post-trauma | 54 (37.5%) |
3.2. Features
Based on the PTSD literature and previous findings using the data from the same cohort [7,8,22,23,26], we compile a total of 129 features. The features include participants’ demographic and trauma-related information (i.e., age, sex, and trauma type), and behavioral and clinical symptoms in the form of responses to individual questions from 6 validated survey instruments, listed in Table 2.
Table 2.
Survey assessments used as features in this paper. Participants responded to each survey question on a scale with the listed number of choices or scale points.
| Survey | Questions | Scale pts. |
|---|---|---|
| Acute stress disorder scale (ASDS) [5] | 19 | 5 |
| Quick Inventory of Depressive Symptomatology (QIDS) [21] | 16 | 4 |
| Pain Anxiety Symptoms Scale – Short Form (PASS) [17] | 20 | 6 |
| Difficulties in Emotion Regulation Scale (DERS) [11] | 36 | 5 |
| Childhood Trauma Questionnaire (CTQ) [3] | 28 | 5 |
| Pittsburgh Sleep Quality Index Addendum (PSQI-A) [10] | 7 | 5 |
3.3. Imputation of Missing Data
Roughly 2% of our data are missing, corresponding to survey questions that participants did not answer. The features with the highest rates of missing data are QIDS questions 6 and 8, which focus on decreased appetite and weight, respectively. They are followed by questions 7 and 9 on increased appetite and weight, which may have led participants to ignore questions 6 and 8. Question 6 had 6.25% missing data (3.47% from PTSD and 2.78% from non-PTSD participants), while question 6 had 5.56% missing data (3.47% PTSD, 2.08% non-PTSD).
In order to properly train and test our ML models, we perform data imputation for the missing data. We use the IterativeImputer from the scikit-learn Python package [20] to impute missing values on the entire data set. The imputation approach is a single regression-based multivariate imputation based on the Multivariate Imputation by Chained Equations (MICE) package in R [6].
4. Methodology
We first train a variety of classifiers on the full survey data to determine the attainable PTSD prediction accuracy using all 129 features. We then compare feature selection approaches to choose a smaller subset of features to use when training the classifiers and investigate the prediction accuracy using different feature selection methods and different numbers of features.
4.1. Classification on Full Survey Data
We assess these models using a 5 × 5 nested cross validation (CV), with 5 outer folds and 5 inner folds. The outer folds are used to evaluate the model’s prediction accuracy, while the inner folds are used to select the hyperparameters used to train the models via grid search. The hyperparameter values that maximize the mean inner CV are chosen. These hyperparameters are then used to evaluate prediction accuracy in the outer CV. Both the outer and inner CV are stratified by the labels: the PTSD status at 3 months post-trauma. Using a nested CV rather than a single CV prevents us from using the same CV to choose hyperparameters and evaluate accuracy, which may result in overly optimistic prediction accuracy values that may not be achievable in practice.
We consider three different classification algorithms: logistic regression with an elastic net penalty [27], random forest [4], and gradient boosting [9]. Logistic regression makes a prediction using a linear function of the features, while random forest and gradient boosting are non-linear ensemble predictors that use multiple decision trees to arrive at a prediction. Logistic regression is sensitive to feature scaling, while random forest and gradient boosting are not, so we standardize the features for logistic regression only. The values and ranges we consider for key hyperparameters are shown in Table 3. Random forest and gradient boosting were trained using the Gini impurity and the mean squared error improvement criterion (‘friedman_mse’ in scikit-learn) [9], respectively, to measure the quality of a split.
Table 3.
Hyperparameters and their ranges of values
| Model | Hyperparameter | Values |
|---|---|---|
| Logistic Regression |
l1-ratio Inverse regularization strength C |
{0.75, 0.85, 0.95} {10−3, 10−2, … , 102} |
| Random Forest |
# of trees Max. depth Max. features |
{5, 10, … , 100} {1, 2, … , 9} {None, ‘sqrt’, 0.2, 0.5, 0.7} |
| Gradient Boosting |
# of trees Max. depth |
{5, 10, … , 100} {1, 2, 3, 4} |
4.2. Minimizing Survey Questions using Feature Selection
We formulate the objective of minimizing the number of survey questions as a feature selection problem. Feature selection denotes selecting a subset of the available features to use when training a classifier. It is used to discard irrelevant features from a classifier and results in a smaller model. It may also result in higher classification accuracy, but we are more interested in the smaller model. Any feature that gets discarded from the classifier corresponds to a survey question that does not need to be asked. Thus, if a feature selection approach results in only 5 questions selected, then those 5 questions now form the minimized survey and are the only questions that the subject would be presented with.
We experiment with a variety of feature selection methods, described below, to observe the relationship between classification accuracy and the number of features used. We treat the participant’s age, sex, and trauma type as “always available” features since they are not survey questions. These 3 features are excluded from the feature selection process.
The LASSO stability selection and mean decrease in impurity (MDI) approaches are applied before training the classification model, while the maximum depth limitation approach modifies how the classifier is trained. For LASSO stability selection and MDI, we evaluate with the same 5 × 5 stratified, nested CV as we use for the models on the full survey data. In each inner fold, we train the given selector on the inner CV training set, rank the features, and then train the classifier (with a grid search for hyperparameter values) on the top k features for k ∈{3, 5, 10, 13, 15, 20}. The maximum depth limitation approach does not have any additional hyperparameters and thus uses only a single CV, which is the same as the outer CV for the models on the full survey data.
LASSO Stability Selection:
We train 1,000 logistic regression models with an ℓ1 (LASSO) penalty on a random 50% of the inner fold’s training data. We perform stability selection [18] by ranking each feature by the number of times it was selected by all 1,000 models. In order to rank the features, we tuned the logistic regression C hyperparameter such that the logistic regression model had non-zero coefficients for a large proportion of the total features (roughly over 30%).
Mean Decrease in Impurity (MDI):
Tree-based models offer a “built-in” approach for measuring feature importance, the mean decrease in impurity (MDI) [16]. When the impurity measure used is Gini impurity, it also goes by the name Gini importance [19]. We use the MDI purely for feature selection by training a tree-based ensemble model on the inner fold training data and then ranking features by their importance in terms of the MDI. We consider two tree-based ensemble models for MDI-based feature selection: random forest and gradient boosting. In scikit-learn, the MDI-based is given by the attribute feature_importances_.
Note that we are training a random forest or gradient boosting model on the full survey data just for the purpose of feature selection. Similar to LASSO stability selection, we tune the number of trees used for random forest and gradient boosting such that they produce a non-zero importance for a large proportion of the total features (roughly over 30%). We discard the random forest or gradient boosting model and then train the actual classifier on only the selected features to evaluate prediction accuracy on the reduced survey.
Maximum Depth Limitation:
This approach is designed for boosted decision trees, which typically use very shallow trees as the base classifier. If we constrain the maximum depth of the tree to be 1, turning it into a decision stump, then a boosting model with L trees can make at most L splits, and hence, use at most L features. To use this maximum depth limitation with gradient boosting, we constrain the model to use maximum depth of 1 and vary the number of trees L according to Table 3. For each value of L, we record the number of features used. Since this method does not require any hyperparameter tuning, we use a single 5-fold cross validation to determine the accuracy for all values of L. Unlike the other feature selection approaches, this approach does not require first training an additional classifier in order to perform feature selection. It is thus much more computationally efficient than the other two approaches.
5. Results
5.1. Prediction using Full Survey Data
The prediction accuracy for the three different classifiers is shown in Table 4. All of the classifiers perform similarly in their prediction accuracy values, which are within 1 standard error of each other. All classifiers had higher specificity than sensitivity, likely due to the higher number of non-PTSD patients in the data.
Table 4.
Comparison of different measures of prediction accuracy and number of features used across different classifiers trained using all of the survey questions. Reported results are over a 5 × 5 nested cross-validation with mean ± standard error over the outer folds. Bold entries denote highest accuracy, sensitivity, specificity, and lowest number of features used.
| Classifier | Accuracy | Sensitivity | Specificity | Features Used |
|---|---|---|---|---|
| Logistic Regression | 0.653 ± 0.034 | 0.407 ± 0.061 | 0.800 ± 0.067 | 37.4 ± 10.4 |
| Random Forest | 0.659 ± 0.025 | 0.513 ± 0.086 | 0.744 ± 0.038 | 70.6 ± 15.0 |
| Gradient Boosting | 0.666 ± 0.027 | 0.402 ± 0.092 | 0.822 ± 0.021 | 38.0 ± 18.3 |
While all of the models perform similarly in accuracy, we also consider how many features a model uses to inform its prediction. Since we are aiming to minimize the number of features by feature selection, choosing a classifier that already uses a smaller number of features makes for a good starting point. The model with the highest accuracy and lowest number of features is the best. Given these criteria, we choose gradient boosting as the classifier to use for survey minimization, as it has the highest accuracy and finishes a close second in the number of features used.
5.2. Prediction using Shortened Surveys
We plot the mean prediction accuracy for varying numbers of features used in Fig. 1 for each of the four feature selection techniques. The mean accuracy values for all feature selectors are actually higher for some number of features than the corresponding values for gradient boosting on the full survey. For the MDI-based feature selection using random forest, increased accuracy is achieved using as few as 3 features, while the other approaches require more features. All are able to achieve higher accuracy than gradient boosting on the full survey once the number of features is in the 10–20 range. The highest values of prediction accuracy are shown in Table 5 for models with less than 5, 10, and 20 features.
Fig. 1.
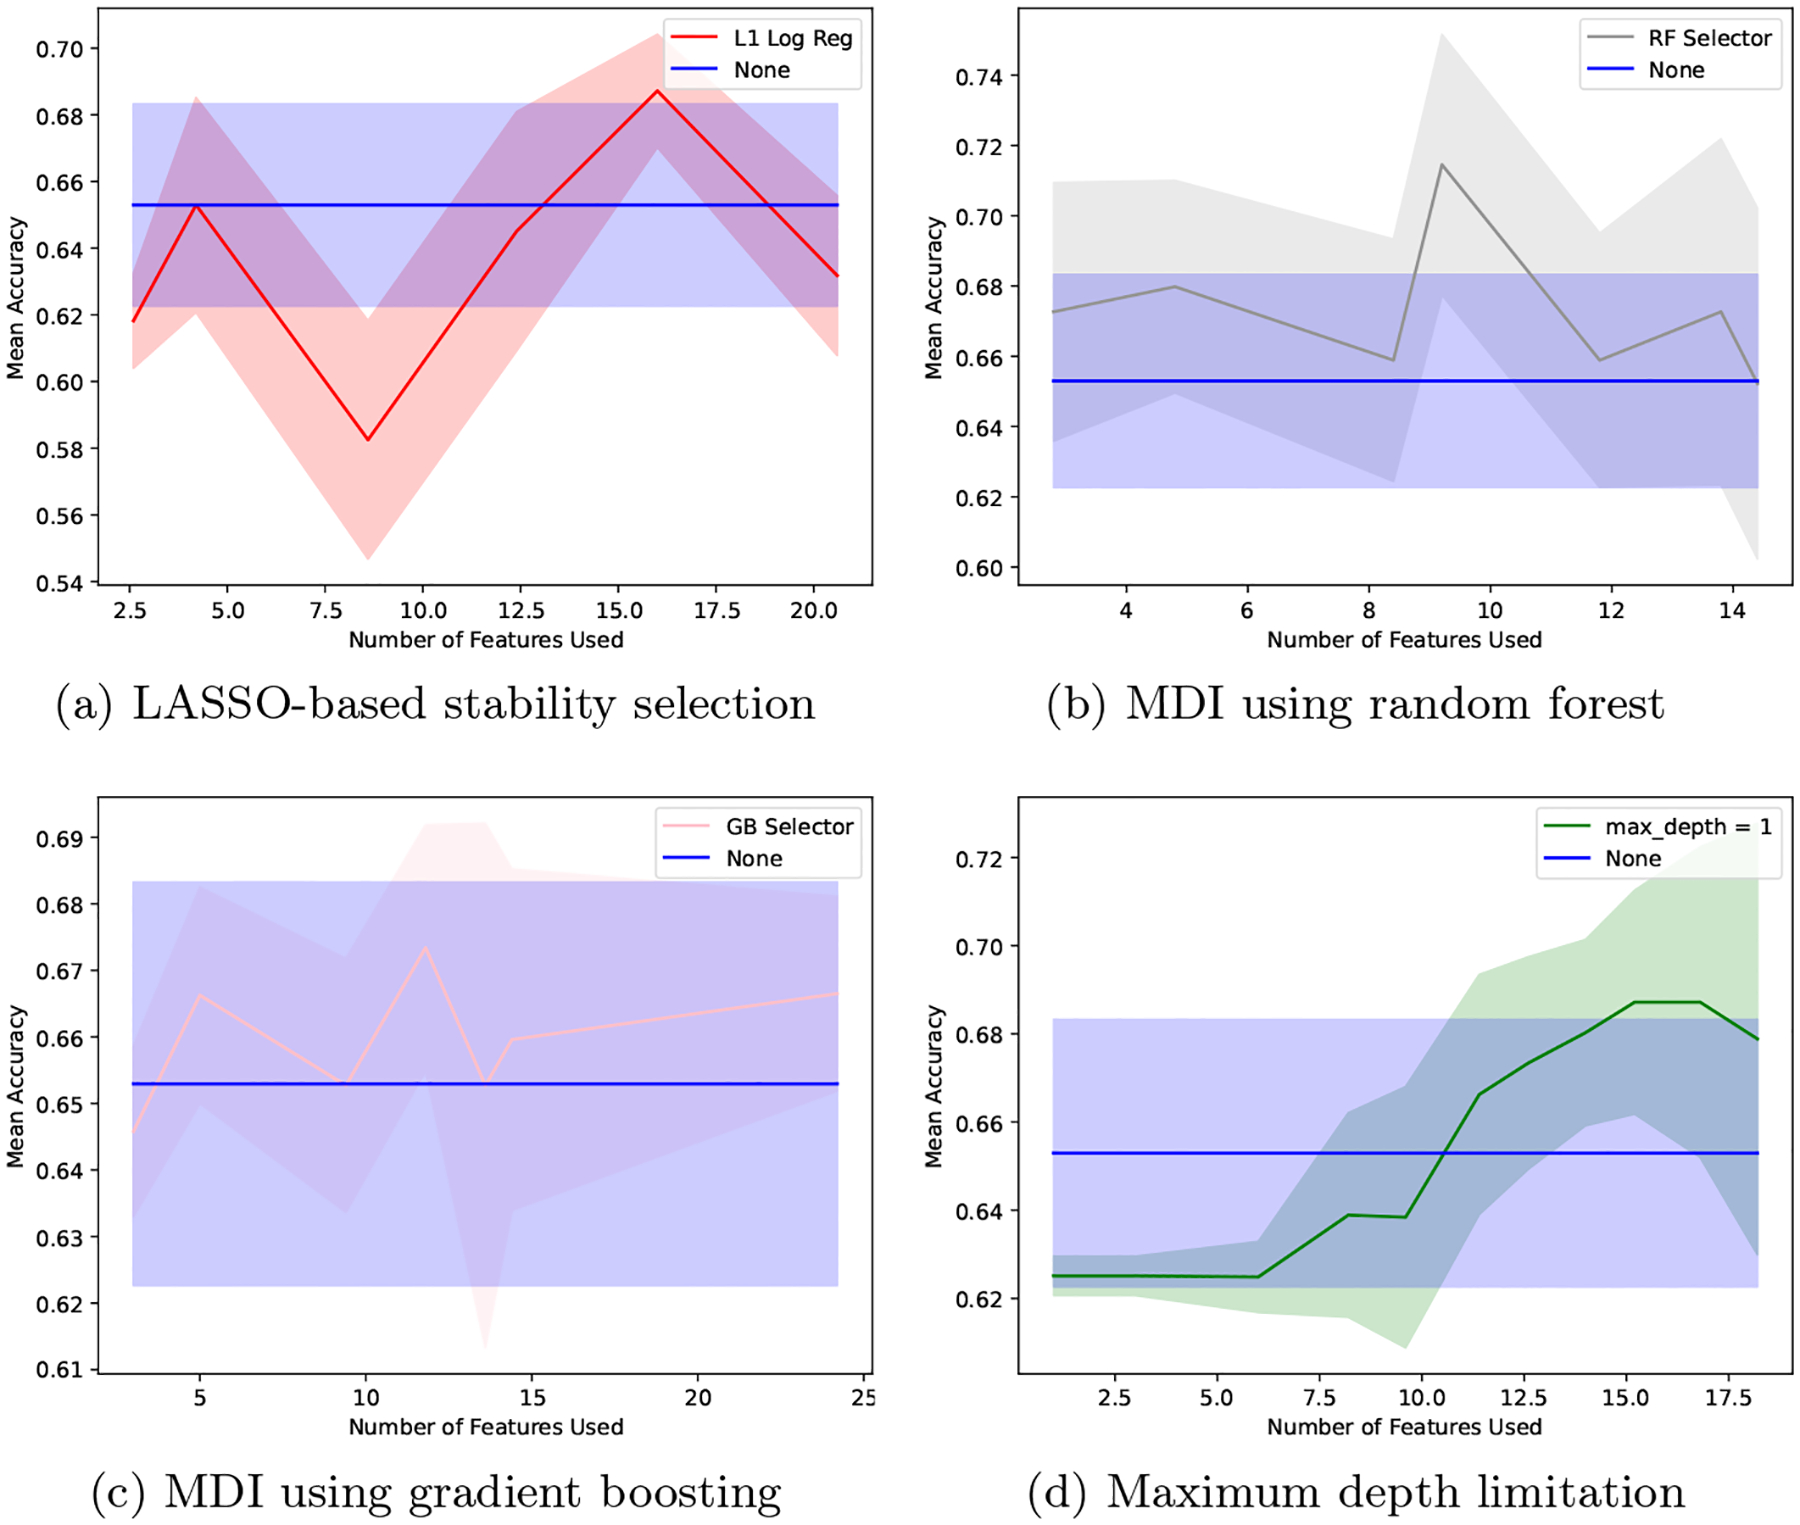
Comparison of gradient boosting accuracy with no feature selection (blue) and using four different feature selection methods (other colors). Confidence bands denote 1 standard error for the mean accuracy over a 5-fold cross validation.
Table 5.
Comparison of gradient boosting prediction accuracy using limited numbers of features for different feature selection methods. Bold entries denote highest accuracy for a fixed maximum number of features.
| Feature Selector | ≤ 5 Features | ≤ 10 Features | ≤ 20 Features |
|---|---|---|---|
| LASSO stability selection | 0.653 ± 0.0322 | 0.653 ± 0.0322 | 0.687 ± 0.017 |
| MDI using random forest | 0.680 ± 0.030 | 0.715 ± 0.037 | 0.715 ± 0.037 |
| MDI using gradient boosting | 0.666 ± 0.016 | 0.666 ± 0.016 | 0.673 ± 0.018 |
| Maximum depth limitation | 0.625 ± 0.004 | 0.639 ± 0.023 | 0.687 ± 0.025 |
These results suggest that it is indeed possible to significantly reduce the length of the survey while maintaining or even possibly improving the prediction accuracy. We note that, in most cases, the confidence band (±1 standard error) overlaps with the confidence band for gradient boosting without feature selection. This suggests that, while we cannot confirm that we are improving prediction accuracy, it is likely that the prediction accuracy using the shortened surveys is at least comparable to that using the full surveys. The feature selector with the highest mean accuracy is the MDI-based selector using random forest.
6. Conclusion
The objective of this paper was to devise an approach to minimize the number of survey questions needed to predict a patient’s PTSD diagnosis. We demonstrated that it was possible to predict PTSD with about 72% accuracy using ≤ 10 features or 68% accuracy using ≤ 5 features, both of which are comparable to and possibly exceed the prediction accuracy of a classifier trained using the full survey data. We found that an approach based on optimizing the mean decrease in impurity (MDI) from a random forest model resulted in the highest accuracy.
While this work provides a promising start to PTSD prediction using minimized surveys, the overall prediction accuracy remains somewhat weak. This may be partially due to using only survey data taken within 2 weeks post-trauma to predict the PTSD diagnosis at 3 months post-trauma. In future work, we intend to incorporate the longitudinal data collected in the study to improve the overall prediction accuracy using multiple adaptive surveys that may ask different questions to different participants based on their past responses.
Acknowledgements
Research reported in this publication was supported by the National Institute of Mental Health of the National Institutes of Health under Award Numbers R21MH125277 and R01MH110483. The content is solely the responsibility of the authors and does not necessarily represent the official views of the National Institutes of Health.
References
- 1.Aha DW, Bankert RL: A comparative evaluation of sequential feature selection algorithms. In: Pre-proc. 5th Int. Workshop Artif. Intell. Stat. pp. 1–7 (1995) [Google Scholar]
- 2.American Psychiatric Association: Diagnostic and statistical manual of mental disorders. 5th edn. (2013) [Google Scholar]
- 3.Bernstein DP, Stein JA, Newcomb MD, Walker E, Pogge D, Ahluvalia T, Stokes J, Handelsman L, Medrano M, Desmond D, Zule W: Development and validation of a brief screening version of the childhood trauma questionnaire. Child Abus. Negl 27(2), 169–190 (2003) [DOI] [PubMed] [Google Scholar]
- 4.Breiman L: Random forests. Machine Learning 45, 5–32 (2001) [Google Scholar]
- 5.Bryant RA, Moulds ML, Guthrie RM: Acute stress disorder scale: a self-report measure of acute stress disorder. Psychol. Assess 12(1), 61 (2000) [PubMed] [Google Scholar]
- 6.van Buuren S, Groothuis-Oudshoorn K: mice: Multivariate imputation by chained equations in R. J. Stat. Softw 45, 1–67 (2011) [Google Scholar]
- 7.Chen J, Christ NM, Shih CH, Xie H, Grider SR, Lewis C, Elhai JD, Wang X: Dispositional optimism mediates relations between childhood maltreatment and PTSD symptom severity among trauma-exposed adults. Child Abus. Negl 115, 105023 (2021) [DOI] [PMC free article] [PubMed] [Google Scholar]
- 8.Forbes CN, Tull MT, Xie H, Christ NM, Brickman K, Mattin M, Wang X: Emotional avoidance and social support interact to predict depression symptom severity one year after traumatic exposure. Psychiatry Res. 284, 112746 (2020) [DOI] [PMC free article] [PubMed] [Google Scholar]
- 9.Friedman JH: Greedy function approximation: a gradient boosting machine. Ann. Stat pp. 1189–1232 (2001) [Google Scholar]
- 10.Germain A, Hall M, Krakow B, Shear MK, Buysse DJ: A brief sleep scale for posttraumatic stress disorder: Pittsburgh sleep quality index addendum for PTSD. J. Anxiety Disord 19(2), 233–244 (2005) [DOI] [PubMed] [Google Scholar]
- 11.Gratz KL, Roemer L: Multidimensional assessment of emotion regulation and dysregulation: Development, factor structure, and initial validation of the difficulties in emotion regulation scale. J. Psychopathol. Behav. Assess 26, 41–54 (2004) [Google Scholar]
- 12.Huffman N, Shih CH, Cotton AS, Lewis TJ, Grider S, Wall JT, Wang X, Xie H: Association of age of adverse childhood experiences with thalamic volumes and post-traumatic stress disorder in adulthood. Front. Behav. Neurosci 17, 1147686 (2023) [DOI] [PMC free article] [PubMed] [Google Scholar]
- 13.Jayachandran S, Biradavolu M, Cooper J: Using machine learning and qualitative interviews to design a five-question survey module for women’s agency. World Dev. 161, 106076 (2023) [DOI] [PMC free article] [PubMed] [Google Scholar]
- 14.Kshirsagar V, Wieczorek J, Ramanathan S, Wells R: Household poverty classification in data-scarce environments: a machine learning approach. arXiv preprint arXiv:1711.06813 (2017) [Google Scholar]
- 15.Logé F, Le Pennec E, Amadou-Boubacar H: Intelligent questionnaires using approximate dynamic programming. i-com 19(3), 227–237 (2021) [Google Scholar]
- 16.Louppe G, Wehenkel L, Sutera A, Geurts P: Understanding variable importances in forests of randomized trees. In: Adv. Neural Inf. Proc. Sys vol. 26 (2013) [Google Scholar]
- 17.McCracken LM, Dhingra L: A short version of the pain anxiety symptoms scale(PASS-20): preliminary development and validity. Pain Res. Manag 7, 517163 (2002) [DOI] [PubMed] [Google Scholar]
- 18.Meinshausen N, Bühlmann P: Stability selection. J. Royal Stat. Soc. Ser. B Stat. Methodol 72(4), 417–473 (2010) [Google Scholar]
- 19.Nembrini S, König IR, Wright MN: The revival of the Gini importance? Bioinformatics 34(21), 3711–3718 (2018) [DOI] [PMC free article] [PubMed] [Google Scholar]
- 20.Pedregosa F, Varoquaux G, Gramfort A, Michel V, Thirion B, Grisel O, Blondel M, Prettenhofer P, Weiss R, Dubourg V, Vanderplas J, Passos A, Cournapeau D, Brucher M, Perrot M, Duchesnay E: Scikit-learn: Machine learning in Python. J. Mach. Learn. Res 12, 2825–2830 (2011) [Google Scholar]
- 21.Rush A, Trivedi MH, Ibrahim HM, Carmody TJ, Arnow B, Klein DN, Markowitz JC, Ninan PT, Kornstein S, Manber R, Thase ME, Kocsis JH, Keller MB: The 16-item quick inventory of depressive symptomatology (QIDS), clinician rating (QIDS-C), and self-report (QIDS-SR): a psychometric evaluation in patients with chronic major depression. Biol. Psychiatry 54(5), 573–583 (2003) [DOI] [PubMed] [Google Scholar]
- 22.Shih CH, Thalla PR, Elhai JD, Mathews J, Brickman KR, Redfern RE, Xie H, Wang X: Preliminary study examining the mediational link between mild traumatic brain injury, acute stress, and post-traumatic stress symptoms following trauma. Eur. J. Psychotraumatology 11(1), 1815279 (2020) [DOI] [PMC free article] [PubMed] [Google Scholar]
- 23.Shih CH, Zhou A, Grider S, Xie H, Wang X, Elhai JD: Early self-reported post-traumatic stress symptoms after trauma exposure and associations with diagnosis of post-traumatic stress disorder at 3 months: latent profile analysis. BJPsych Open 9(1), e27 (2023) [DOI] [PMC free article] [PubMed] [Google Scholar]
- 24.Tibshirani R: Regression shrinkage and selection via the lasso. J. Royal Stat. Soc. Ser. B Stat. Methodol 58(1), 267–288 (1996) [Google Scholar]
- 25.Xie H, Shih CH, Aldoohan SD, Wall JT, Wang X: Hypothalamus volume mediates the association between adverse childhood experience and PTSD development after adulthood trauma. Transl. Psychiatry 13(1), 274 (2023) [DOI] [PMC free article] [PubMed] [Google Scholar]
- 26.Zhou A, McDaniel M, Hong X, Mattin M, Wang X, Shih CH: Emotion dysregulation mediates the association between acute sleep disturbance and later posttraumatic stress symptoms in trauma exposed adults. Eur. J. Psychotraumatology 14(2), 2202056 (2023) [DOI] [PMC free article] [PubMed] [Google Scholar]
- 27.Zou H, Hastie T: Regularization and variable selection via the elastic net. J. Royal Stat. Soc. Ser. B Stat. Methodol 67(2), 301–320 (2005) [Google Scholar]