The images for Figs 3 to 6 are incorrectly switched. The image that appears as Fig 3 should be Fig 6, the image that appears as Fig 4 should be Fig 3, the image that appears as Fig 5 should be Fig 4 and the image that appears as Fig 6 should be Fig 5. The figure captions appear in the correct order.
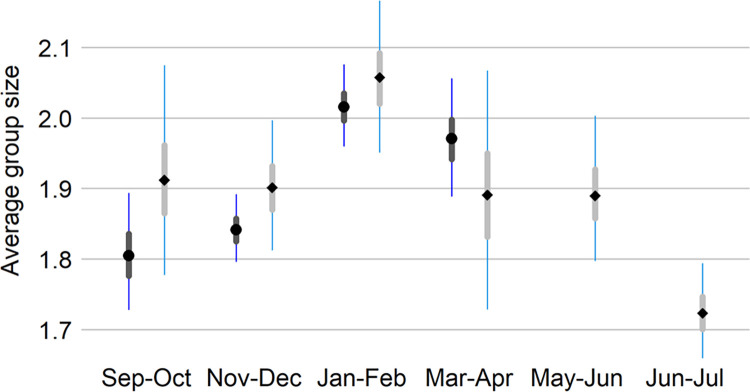
Fig 3. Marbled murrelet group size.
Fig 6. Marbled murrelet density by sampling window and year.
Fig 4. Marbled murrelet density by strata within survey season.
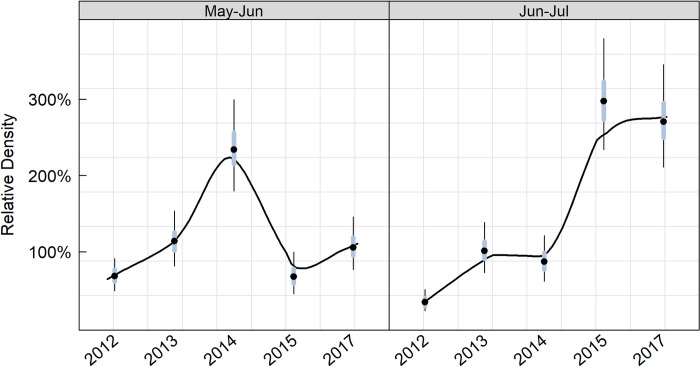
Fig 5. Relative marbled murrelet density for two 2-month breeding season survey intervals relative to that observed in the non-breeding season.
Posterior median (points), 25–75% quartile (thick bars) and 95% credible interval (thin bars) of marbled murrelet group size by 2-month survey window for all years pooled. The dark boxplots with circles and the light plots with diamonds were derived from the non-breeding (Sep-Apr) model and year-round (Sep-Jul) model, respectively. The year-round model only includes the sampling units consistent between breeding and non-breeding seasons (n = 11) and the non-breeding model includes all 32 sampling units. For the most part, murrelets were detected as pairs or singles. As a result, we did not attempt to model the effect of group size on detection by distance.
Estimated (± 95% Crl) marbled murrelet density for each year and 2-month survey window combination in Strata 2,3,4, and 5.
A 100% relative density in May-Jun for a given year indicates that the density of murrelets was identical to that observed during the non-breeding season (Sep-Apr) and would suggest that birds are not moving into the region from outer coastal environments to molt and over-winter as we predicted. However, if the May-Jun density were 50% of that observed during the non-breeding season, then there would be evidence for movement into the region during the non-breeding season.
Violin plot depicting the posterior distribution of annual marbled murrelet density (km2) by 2-month survey window during the non-breeding season. Black trend line derived from locally weighted sum of square regression (loess) fit to all posterior draws.
Reference
- 1.Pearson SF, Keren I, Lance MM, Raphael MG (2022) Non-breeding changes in at-sea distribution and abundance of the threatened marbled murrelet (Brachyramphus marmoratus) in a portion of its range exhibiting long-term breeding season declines. PLOS ONE 17(4): e0267165. 10.1371/journal.pone.0267165 [DOI] [PMC free article] [PubMed] [Google Scholar]


