ABSTRACT
Objectives:
This research aimed to examine the connection between indoor air quality and respiratory function in preschool children, a topic that, to the best of our knowledge, has not been explored before.
Methods:
This cross-sectional study was conducted within the geographical location of the Ministry of Education of Jeddah. Four hundred preschool-aged children (4–6 years old) from four preschools were enrolled. Structured questionnaires and peak flow meter (PFM) were used to assess the overall health and pulmonary function of the participants. An air detector for formaldehyde (HCHO), volatile organic compound, and fine particulate dust matter and a carbon dioxide (CO2) detector with temperature and humidity monitors were used to measure the air pollutants.
Results:
A significant difference was observed in PFM measurement between the four preschools (P = 0.017). The highest PFM green zone value was identified in the North preschool (n = 32, 54.2%), and the lowest value was identified in the Central preschool (n = 21, 33.3%). Regarding the red zone, the highest value was observed in the Central preschool (n = 14, 22.2%) and the lowest in the North preschool (n = 1, 1.7%). PFM measurement in the green zone showed lower CO2 levels (P = 0.014) and temperature (P = 0.04) than those in the yellow and red zones.
Conclusion:
Children schooling in adequate ventilation environments had better respiratory function than those in inadequate environmental ventilation.
Keywords: Indoor air quality, public preschool, respiratory function
Introduction
Air pollution (AP) is characterized as the contamination of the indoor or outdoor environment by physical, biological, or chemical agents that alter the natural characteristics of the atmosphere.[1] In 2016, the World Health Organization (WHO) estimated that 25–33% of the global disease burden was attributed to environmental risk factors, emphasizing the critical impact of the environment on public health.[2] Addressing social and environmental factors presents an opportunity to alleviate the global disease burden.[2]
According to the WHO, 91% of the global population in 2016 experienced air that did not meet clean standards. In addition, over half of the urban population faced outdoor AP (OAP) levels surpassing the WHO safety standard by at least 2.5 times. The impact of this issue was profound, leading to an estimated 4.2 million deaths worldwide attributed to OAP in both urban and rural areas. When combining the effects of indoor and OAP, it was responsible for an alarming 7 million deaths globally in 2016, equating to one in eight deaths.[2]
School health programs emerge as cost-effective preventive measures, recommended by the WHO to mitigate health risks, particularly respiratory illnesses, musculoskeletal pain, and injuries among children and youths.[3] Notably, studies by the US Environmental Protection Agency have demonstrated that indoor AP (IAP) can be 2–5 times higher than outdoor levels, with some instances reaching 100 times higher.[4] Children, constituting a quarter of the world population, are especially vulnerable to the consequences of IAP.[5]
The global morbidity and mortality related to respiratory diseases in children have been a major issue for health-care systems in developing and developed countries.[6] The impact of IAP and OAP on respiratory infections, such as pneumonia, is alarming, with second-hand smoke exposure alone causing 570,000 deaths in children under 5 years of age.[7] According to the WHO, approximately 60% of the global disease burden from respiratory infections can be attributed to IAP and OAP.[8]
Recognizing schools as environments with diverse hazards, it becomes crucial to assess and manage risks for the well-being of staff, students, and visitors. AP emerges as a significant hazard stemming from various human activities such as transportation, construction, industrial work, agriculture, mining, and smelting.[8,9] IAP, with its numerous potential sources in schools, underscores the importance of understanding indoor air quality (IAQ) variations across different spaces within educational institutions.[10]
School environments are not only the potential sources of IAP but also exhibit a wide range of IAQ. Health issues such as respiratory tract diseases, allergies, headaches, and fatigue are linked to IAP, as well inadequate structural ventilation, and dampness. In 2015, a cohort study conducted in Barcelona linked exposure to higher traffic-related AP in schools to attenuated cognitive development in children.[11]
The study of indoor environments reveals the presence of IAPs, including carbon dioxide (CO2), particulate matter (PM), carbon monoxide, sulphur dioxide, nitrogen dioxide (NO2), and volatile organic compounds (VOCs), which are of primary concern for health.[12,13]
Children raised in regions characterized by elevated levels of NO2 may face an elevated risk of developing schizophrenia.[14] Upon conducting a critical review of epidemiological evidence, it becomes evident that AP has detrimental effects on cognitive function. This association is marked by cognitive impairment and an elevated risk of dementia.[15] A systematic review conducted in 2022 found that IAP resulting from the use of solid fuels may be a significant risk factor for pneumonia in children.[16] Moreover, according to the recent review in 2023, IAQ assessment was carried out in day care centers, they found that effectively managing IAQ in a child care sitting environment by identifying and eliminating sources is cost-effective and time-efficient.[17]
Notably, the International Study of Asthma and Allergies in Childhood reported a global rise in asthma prevalence in 2007, particularly in low- and middle-income countries, emphasizing the importance of understanding the impact of environmental factors on respiratory health.[11] Lung function is influenced by various factors, some non-modifiable like family history and genetic predisposition, and others modifiable, such as exposure to IAPs. Children, spending a significant portion of their time indoors, are particularly at risk due to the immaturity of their respiratory systems.[18] Despite these concerning trends, there is a notable gap in the literature regarding the relationship between IAQ and respiratory function in preschool children especially in Saudi Arabia. This study aims to fill this gap by assessing this critical connection and contributing valuable insights into a relatively unexplored area of research.
Methods
Study setting and sampling
A cross-sectional study was conducted in Jeddah between November and December 2018 and included male and female children aged 4–6 years who attended public preschool. Multistage cluster analysis was conducted, and stratification was applied during the first two stages.
Stage 1
According to the Ministry of Education’s geographical map, four preschools were selected from four geographical areas in Jeddah (Central, East, West, and North).
Stage 2: Stratification according to the preschool levels
Within each preschool, stratification was applied according to age:
Stratum one: Children from preschool grade 2.
Stratum two: Children from preschool grade 3.
Stage 3: Student selection
A total of 400 students (100 from each school) were divided between the two strata, and 50 students from each stratum were selected from the updated list using systematic random sampling.
Students who could not perform peak flow meter (PFM) testing and those who had learning difficulties were excluded [Figure 1].
Figure 1.
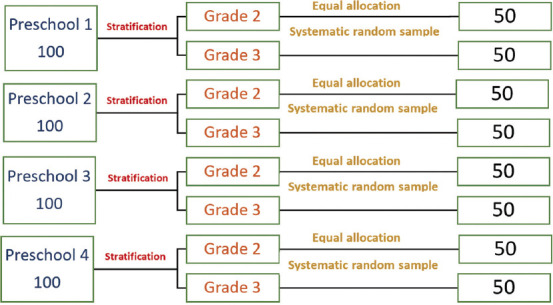
Student selection and stratification
Data collection
IAQ was assessed using a4-IN-1 Air Detector (WP6912) for formaldehyde (HCHO), VOCs, and fine particulate dust matter (PM2.5 and PM10), and MultiRAE is a multi-gas portable monitor and detector used to measure CO2, temperature, and humidity.[5,18]
Respiratory function measures
PFM
We used the PFM test to assess the children’s lung function and categorised them based on the results of their PFM test. The test aimed to measure the maximum expiratory flow, which represents the highest peak flow found after forced expiration and measured in liters per minute; it indicates lung function.
The measurement fell into three zones
Green zone (80–100% of the child predicted number): Indicates that the child was healthy, with a clear chest.
Yellow zone (50–80% of the child predicted number): Indicates that the child had warning signs, which included cough, wheezing, and shortness of breath, chest tightness, or runny nose.
Red zone (<50% of the child predicted number): Indicates that the child had difficulty breathing.
The following table was used to interpret the PFM results to classify the child’s respiratory health status according to the above-listed three zones [Table 1].
Table 1.
The identified three zones of the peak flow meter reading

Questionnaire
An adapted and modified questionnaire was obtained from a survey of respiratory health status conducted in 2010 in the Vaal Triangle Priority Area by Mundackal,[6] which included four main sections and 45 questions.
The first to fourth sections of the questionnaire contained the following: (1) questions on the child’s demographic data; (2) related to the child’s parent education, job, consanguinity, and family income per month; (3) related to the child’s house, including the risk factors for AP, child home type, number of people in the home, room number, source of drinking water, heating systems and use of electrical appliances, if there was a fireplace, what type of fuels were used for cooking, how the house was ventilated and if there is any mould, pets and smoking within the household, if there was any pesticide or coal use in the home, and child’s dietary habits; and (4) related to the child’s health such as allergies, asthma, chest cough, sputum, wheezing, and current health status. The last section included a question regarding the opinion of the child’s parent on AP in Jeddah and its source.
Statistical analyses
IBM SPSS Statistics for Windows, version 20 (IBM Corp., Armonk, NY, USA) was used for all statistical analyses. Numeric data are presented as mean ± standard deviation (SD), whereas for categorical variables, percentages are used. The comparisons between groups were analyzed by Student’s t-test or Mann-Whitney U test according to the data distribution and the Chi-squared test for categorical values.
Results
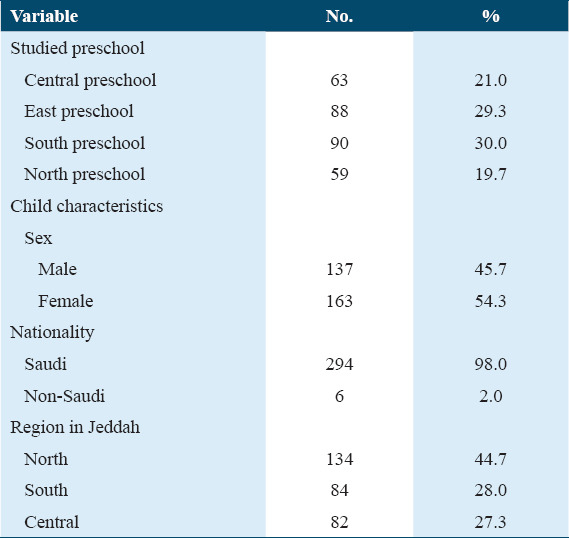
We conducted the study among four preschools located in the South, West, Central, and North areas of Jeddah City. We included 300 children, with a response rate of 75%; of them, 98% were Saudis, 163 (54.3%) of whom were female [Table 2].
Table 2.
Children’s sociodemographic characteristics
The highest PFM green zone value was identified in the North preschool (n = 32, 54.2%) [Figure 2], and the lowest value was identified in the Central preschool (n = 21, 33.3%) [Figure 3]. Yellow zone value was the highest and almost the same at the Central preschool (n = 28, 44.4%) [Figure 3] and North preschool (n = 26, 44.1%) [Figure 2]. The lowest yellow zone value was recorded in the South preschool (n = 33, 36.7%) [Figure 4]. The red zone value was the highest in the Central preschool (n = 14, 22.2%) [Figure 3] and lowest in the North preschool (n = 1, 1.7%) [Figure 2]. The differences in PFM measurements were significant between the schools (P = 0.017).
Figure 2.
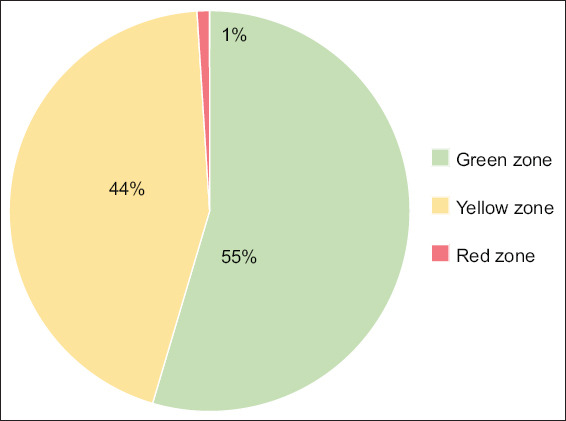
North preschool
Figure 3.
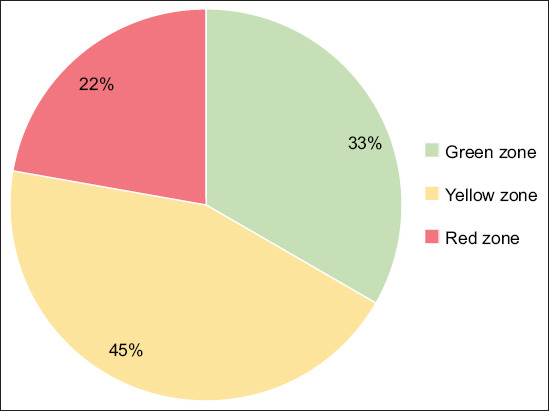
Central preschool
Figure 4.
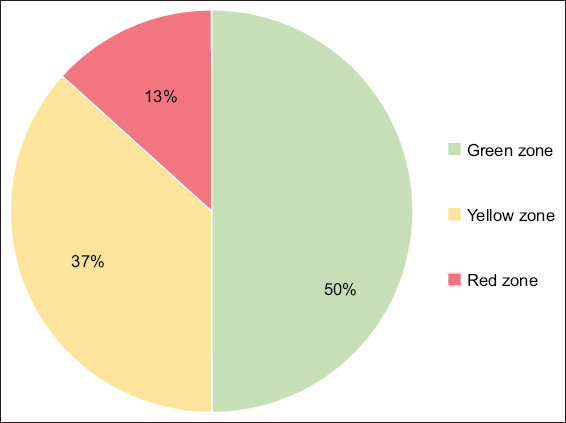
South preschool
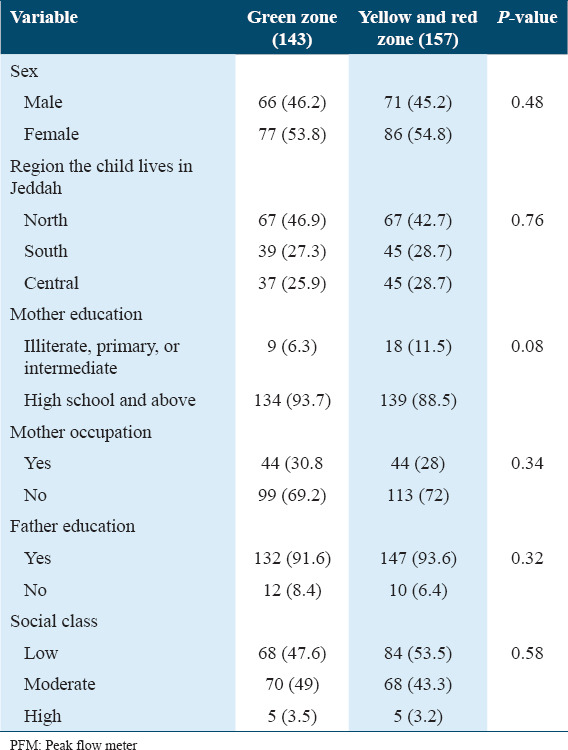
We observed that 54.8% of students in the yellow and red zones were female, but this difference was not statistically significant (P = 0.48) [Table 3]. There was also no significant difference based on the percentage of students in the green zone between the North, South, and Central regions (P = 0.76). Most students in the green zone had parents with education beyond high school (93.7% of mothers and 89.5% of fathers), but this result was not statistically significant (P = 0.08 and 0.54, respectively) [Table 3]. The result showed no difference in socioeconomic class (P = 0.58) [Table 3].
Table 3.
Predictor of student PFM attending preschool and sociodemographic characteristics (n=300)
There was a significant (P = 0.00) association between students in the yellow and red zones and a history of allergies and asthma [Table 4].
Table 4.
Predictor of student PFM attending preschool and history of allergy and asthma (n=300)
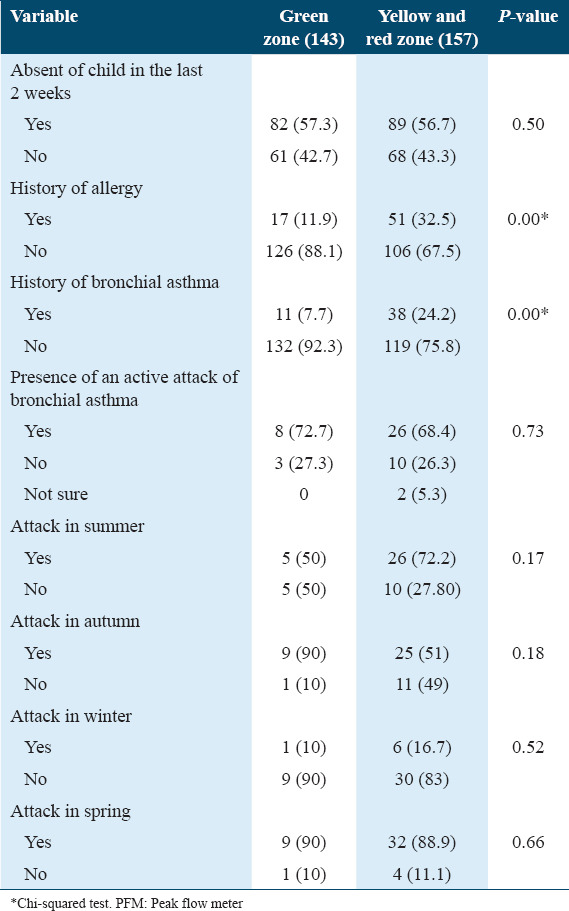
There was no significant association between the PFM value zones and seasons (summer, autumn, winter, and spring) (P = 0.17, 0.18, 0.52, and 0.66, respectively) [Table 4].
Yellow and red zones were significantly associated with the family history of bronchial asthma (P = 0.04) and medication use during a cold (P = 0.00) [Table 5].
Table 5.
Predictor of student PFM attending preschool and (medical, family) history (n=300)
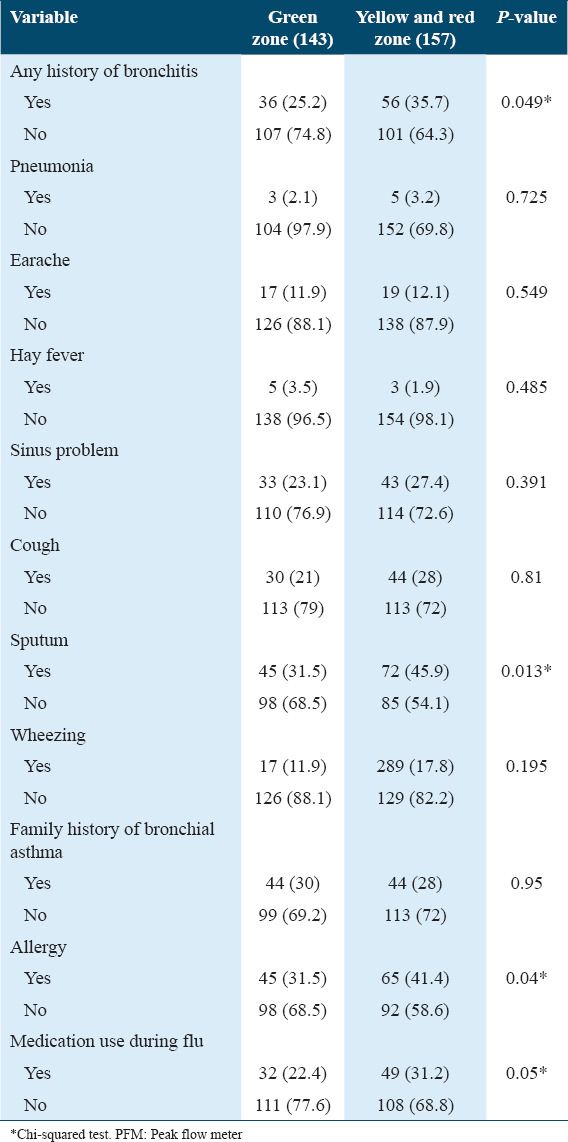
Bronchitis, pneumonia, earaches, sinus issues, cough, sputum, and wheezing were more frequent in students within the yellow and red zones, with significant increases in bronchitis (P = 0.049) and sputum (P = 0.013) [Table 5].
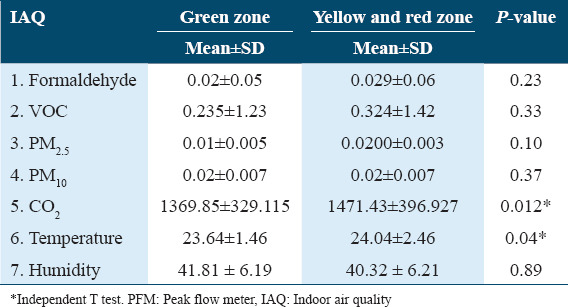
The green zone had lower levels of CO2 (mean = 1369.85.115, SD = 329.115) and lower temperatures (mean = 23.64 SD = 1.46) than the yellow and red zones (CO2 [mean = 1471.43, 24.04, SD = 396.927, 24.04 ± 2.46, 2.46], temperatures [mean = 1471.43, 24.04, SD = 396.927, 24.04 ± 2.46, 2.46]) (P < 0.05) [Table 6].
Table 6.
Association between PFM and IAQ
Discussion
This study observed better lung function in students who attended preschool in the North region of Jeddah than in other regions. Most respiratory symptoms appeared in the yellow and red zones of the PFM chart. Moreover, a statistically significant association was observed between the red and yellow zones and CO2, temperature, and lung function.[18]
Furthermore, poor lung function was moderately associated with a lower family socioeconomic status. Concentrations of CO2, PM2.5, PM10, and VOCs were lower in the North preschool, potentially owing to better airway exchange in the classrooms and fewer students per classroom.[7] In addition, the environment around the preschool could influence the air quality. For example, the north region is near the sea, whereas the Central and South regions house numerous factories.[8] In one study conducted in a university hospital in the Eastern Province of the Kingdom of Saudi Arabia, it was found that OAP may have a negative impact on IAQ.[19]
The poor IAQ levels may be attributed to the occupancy of students. These results are consistent with a study conducted in Poland, where measurements were taken both before the arrival of children and staff and after all classrooms were occupied. The findings revealed that IAQ measurements were lower in the afternoon.[20] Another study conducted in Portugal in 2017 showed that internal concentrations of internal quality measures were often higher at the end of the school day compared to the early morning periods, indicating the impact of occupancy rates.[21]
A different investigation in various nations found a comparable outcome of surpassing the recommended CO2 levels, mirroring the findings of a 2014 study in Malaysia.[11] In addition, a study carried out in Portugal in 2014 showed a similar result.[22]
Several factors can cause abnormalities in lung function, one of which is IAP. A study conducted in Klang Valley found an association between different IAQ parameters and lung function test (FEV1 and FVC) results among school children in urban areas.[6] Another factor in our study could be seasonal allergies because the study was performed in November and December, which is the rainy season, and many children reported being sick and absent for 2 weeks before the study.[9,10] The impact of seasonal allergies should be considered in future studies while appropriately controlling for other variables.
Our results indicated a significant association between the indoor concentration of CO2 and temperature with abnormal lung function.
Previously, CO2 and temperature were associated with reduced lung function among children, but no associations were evident for other IAQ measures (HCOC, VOC, PM2.5, PM10, and humidity).[11]
A study conducted by Arifuddin et al. in Malay reported the same association between CO2 and abnormal lung function.[12]
Another study conducted in Malay concluded that poor IAQ may increase the risk of lung function abnormalities and respiratory problems.[13]
Our study has several limitations, including limited funding, which limited the number of investigators, and limited resource availability, which could have affected the accuracy of the results. The study was conducted during the rainy season, which could also have affected the results. Further research should be conducted with more advanced equipment and during the low season for flu and allergies for more accurate results.
Conclusion
Our study sheds light on a crucial aspect of children’s health, specifically their respiratory function in relation to environmental ventilation. Through rigorous investigation, we observed a noteworthy correlation: children in environments with adequate ventilation demonstrated superior respiratory function compared to those with inadequate ventilation. Our findings unequivocally support the hypothesis that proper ventilation contributes positively to respiratory health in this demographic. Looking ahead, our study prompts further research into the specific mechanisms through which ventilation influences respiratory function in preschool children. Future studies might delve into the long-term effects of sustained exposure to varied ventilation conditions and explore interventions to optimize IAQ in educational settings.
Ethics Approval and Consent to Participate
This study has received ethical approval from the Institutional Review Boards of the Ministry of Health (Approval Number: H-02-J-002) and the Ministry of Education. Informed consent has also been obtained from parents
Consent for Publication
The authors jointly approved the publication of this manuscript.
Availability of Data and Material
The data supporting the findings of this study are available within the article. More detailed data used to support the findings of the current study are available from the corresponding author upon reasonable request.
Competing Interests
All the authors declared that there was no conflict and/or competing interests.
Funding Statement
This research did not receive any specific grant from funding agencies in the public, commercial, or not-for-profit sectors.
Authors’ Contributions
Bayan Hashim Alsharif; conceptualization, data collection, formal analysis, methodology, and writing the original draft. Sulafa Alqutub; conceptualization, data collection, formal analysis, methodology, and writing the original draft. Abdullah Khafagy; validation tools used for study, reviewing manuscript and proofreading. Maram Alshareef; Reviewing and editing the final draft.
Acknowledgments
This study has received ethical approval from the Institutional Review Boards of the Ministry of Health (Approval Number: H-02-J-002) and the Ministry of Education. Informed consent has also been obtained from parents.
References
- 1.Kumar P, Kausar MA, Singh AB, Singh R. Biological contaminants in the indoor air environment and their impacts on human health. Air Qual Atmos Health. 2021;14:1723–36. doi: 10.1007/s11869-021-00978-z. [DOI] [PMC free article] [PubMed] [Google Scholar]
- 2.Data, Analytics and Delivery for impact (DDI) World Health Statistics 2018:Monitoring Health for the SDGs, Sustainable Development Goals. 2018. [[Last accessed on 2024 Jan 25]]. Available from: https://www.who.int/publications/i/item/9789241565585 .
- 3.World Health Organization (WHO) The Cost of a Polluted Environment:1.7 Million Child Deaths a Year, Says WHO. 2017. [[Last accessed on 2018 Dec 05]]. Available from: https://www.who.int/news-room/detail/06-03-2017-the-cost-of-a-polluted-environment-1-7-million-child-deaths-a-year-says-who .
- 4.Indoor, Air Quality (IAQ) - US EPA. 2024. [[Last accessed on 2024 Jan 25]]. Available from: https://www.epa.gov/indoor-air-quality-iaq .
- 5.Assessment of Public Preschool Indoor Air Quality in Preschool Age Children. Jeddah City. 2018. [[Last accessed on 2023 Feb 14]]. Available from: https://www.researchgate.net/publication/354103934_assessment_of_public_preschool_indoor_air_quality_in_preschool_age_children_jeddah_city_2018/citations .
- 6.Mundackal AJ. A Survey of the Respiratory Health Status of 10-Year-Old Children in the Vaal Triangle Priority Area in 1990 and in 2010 a Cross-Sectional Inter-Comparative Study. South Africa:University of Pretoria. 2013 [Google Scholar]
- 7.Gaihre S, Semple S, Miller J, Fielding S, Turner S. Classroom carbon dioxide concentration, school attendance, and educational attainment. J Sch Health. 2014;84:569–74. doi: 10.1111/josh.12183. [DOI] [PubMed] [Google Scholar]
- 8.The Importance of Indoor Air Quality (IAQ) for Business Performance and Wellbeing-IOT Factory. [[Last accessed on 2021 Apr 29]]. Available from: https://iotfactory.eu/the-importance-of-indoor-air-quality-iaq-for-business-performance-and-wellbeing .
- 9.Sahoo D, Harsoda J. Effect of seasonal variation on respiratory dynamics in normal individuals. Natl J Physiol Pharm Pharmacol. 2019;9:969–72. [Google Scholar]
- 10.Liu CL, Lin CY, Yang SH. Seasonal differences in FEV1 response to bronchodilation:A comparison between young and elderly patients. Int J Gerontol. 2018;12:105–9. [Google Scholar]
- 11.Choo CP, Jalaludin J, Hamedon TR, Adam NM. Preschools'indoor air quality and respiratory health symptoms among preschoolers in Selangor. Procedia Environ Sci. 2015;30:303–8. [Google Scholar]
- 12.Arifuddin AA, Jalaludin J, Hisamuddin NH. Air pollutants exposure with respiratory symptoms and lung function among primary school children nearby heavy traffic area in Kajang. Asian J Atmos Environ. 2019;13:21–9. [Google Scholar]
- 13.Rawi NA, Jalaludin J, Chua PC. Indoor air quality and respiratory health among Malay preschool children in Selangor. Biomed Res Int. 2015;2015:248178. doi: 10.1155/2015/248178. [DOI] [PMC free article] [PubMed] [Google Scholar]
- 14.Horsdal HT, Agerbo E, McGrath JJ, Vilhjálmsson BJ, Antonsen S, Closter AM, et al. Association of childhood exposure to nitrogen dioxide and polygenic risk score for schizophrenia with the risk of developing schizophrenia. JAMA Netw Open. 2019;2:e1914401. doi: 10.1001/jamanetworkopen.2019.14401. [DOI] [PMC free article] [PubMed] [Google Scholar]
- 15.Delgado-Saborit JM, Guercio V, Gowers AM, Shaddick G, Fox NC, Love S. A critical review of the epidemiological evidence of effects of air pollution on dementia, cognitive function and cognitive decline in adult population. Sci Total Environ. 2021;757:143734. doi: 10.1016/j.scitotenv.2020.143734. [DOI] [PubMed] [Google Scholar]
- 16.Chen T, Zou C, Yuan Y, Pan J, Zhang B, Qiao L, et al. Indoor air pollution from solid fuel on children pneumonia in low- and middle-income countries:A systematic review and meta-analysis. Environ Sci Pollut Res. 2022;29:24574–88. doi: 10.1007/s11356-021-18293-6. [DOI] [PubMed] [Google Scholar]
- 17.Azuma K, Kagi N, Yanagi U, Osawa H. Effects of low-level inhalation exposure to carbon dioxide in indoor environments:A short review on human health and psychomotor performance. Environ Int. 2018;121:51–6. doi: 10.1016/j.envint.2018.08.059. [DOI] [PubMed] [Google Scholar]
- 18.Alnemari R, Kamal FM, Aljasir B, Bargawi A, Alnemari A? The short-term effect of air purification on lung function and blood pressure among asthmatics and their households. J Community Med Health Educ. 2018;8:621. [Google Scholar]
- 19.El-Sharkawy M, Noweir M. Indoor air quality levels in a university hospital in the Eastern Province of Saudi Arabia. J Family Community Med. 2014;21:39–47. doi: 10.4103/2230-8229.128778. [DOI] [PMC free article] [PubMed] [Google Scholar]
- 20.Gładyszewska-Fiedoruk K. Correlations of air humidity and carbon dioxide concentration in the kindergarten. Energy Build. 2013;62:45–50. [Google Scholar]
- 21.Mainka A, Zajusz-Zubek E. Indoor air quality in urban and rural preschools in Upper Silesia, Poland:Particulate matter and carbon dioxide. Int J Environ Res Public Health. 2015;12:7697–711. doi: 10.3390/ijerph120707697. [DOI] [PMC free article] [PubMed] [Google Scholar]
- 22.Araújo-Martins J, Carreiro Martins P, Viegas J, Aelenei D, Cano MM, Teixeira JP, et al. Environment and health in children day care centres (ENVIRH)-study rationale and protocol. Rev Port Pneumol (2006) 2014;20:311–23. doi: 10.1016/j.rppnen.2014.02.002. [DOI] [PMC free article] [PubMed] [Google Scholar]
Associated Data
This section collects any data citations, data availability statements, or supplementary materials included in this article.
Data Availability Statement
The data supporting the findings of this study are available within the article. More detailed data used to support the findings of the current study are available from the corresponding author upon reasonable request.


