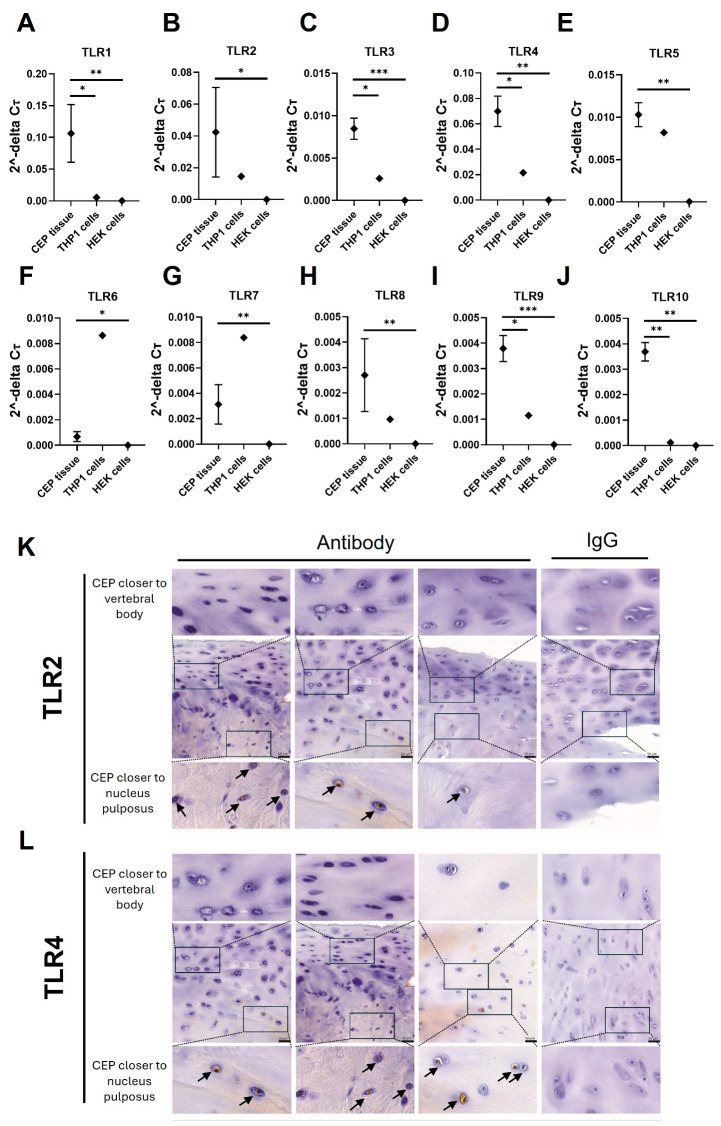
Figure 1.
Ex vivo analysis of TLR gene expression in CEP tissue. (A–J) TLR1–10 were measured with qPCR in RNA isolated from freshly isolated CEP tissue, HEK cells, and THP1 cells. The graphs present the 2^-DCT values normalized to GAPDH. Significant differences in expression levels between CEP tissue, THP1 cells, and HEK cells were tested using ordinary one-way ANOVA followed by Dunnett’s multiple comparisons test. * p < 0.05, ** p < 0.01, *** p < 0.001. (K,L) Immunohistochemistry stains for (K) TLR2 and (L) TLR4 from the CEP of three representative patients as well as the isotype control within a single patient example are shown (right column). Positive staining was found mainly on the side of the CEP closer to the nucleus pulposus. Positive staining is indicated by brown coloration and nuclei counterstain with Hematoxylin. Scale bars = 50 µm as indicated in the central image; zoomed-in regions are indicated with rectangles and positive stainings are highlighted by arrows.

