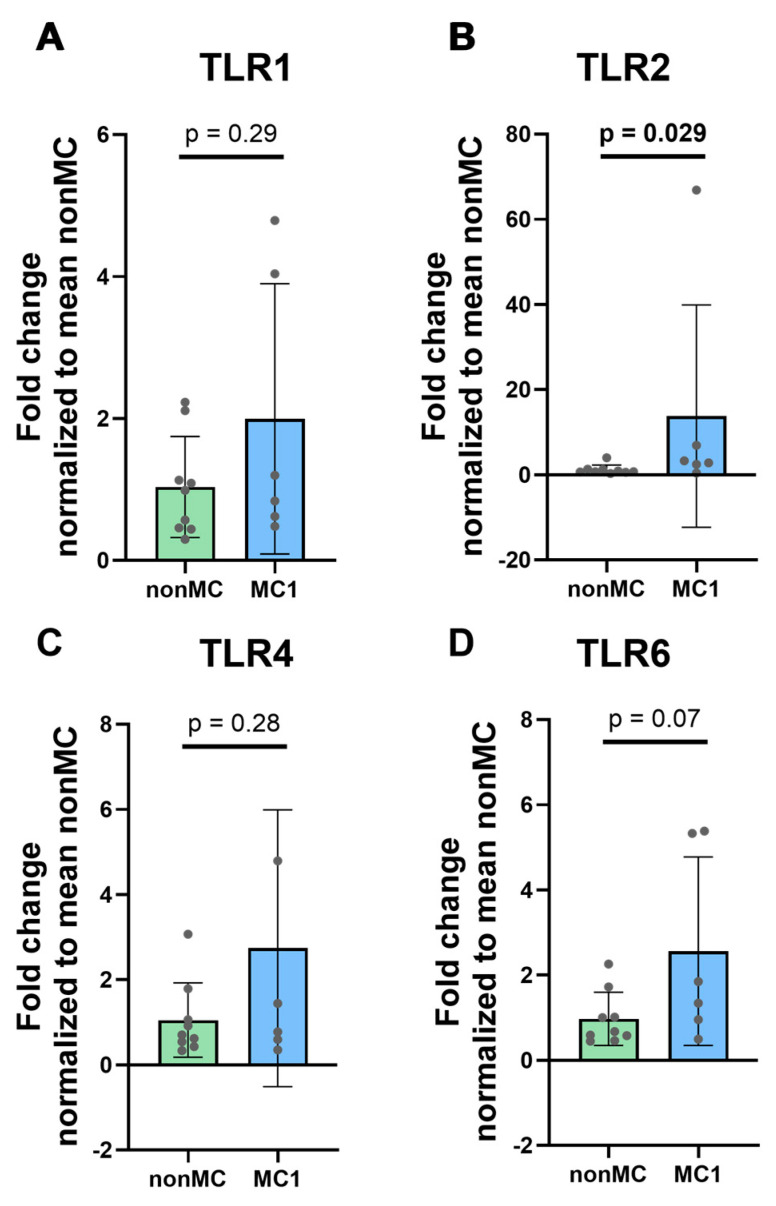
Figure 2.
Expression of surface TLRs involved in DAMP and PAMP recognition; specifically, (A) TLR1, (B) TLR2, (C) TLR4, and (D) TLR6 were measured in unstimulated cultured CEPCs isolated from CEPs adjacent to a degenerated disc with adjacent MC1 (n = 6) and from CEPs adjacent to a degenerated disc without MC1 (non-MC) (n = 9). The graphs illustrate mean fold change ± standard deviation. Significance was tested using unpaired t-tests on log2 fold change values normalized to the mean of non-MC DCt values. The graphs indicate mean fold change values ± standard deviation. The bold p-values indicate significance (p < 0.05).

