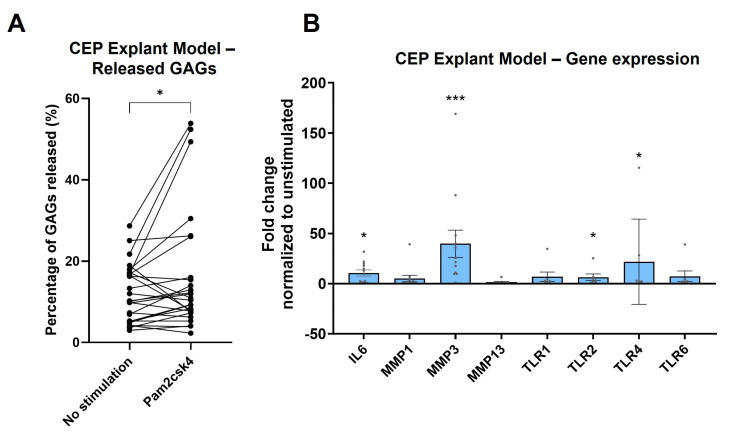
Figure 8.
CEP explant model with half the CEP punch biopsy exposed to Pam2csk4. (A) The percentage of released glycosaminoglycans (GAGs) is illustrated, with each pair representing one endplate punch biopsy cut in half. Significance was tested using the Wilcoxon paired one-tailed t-test. (B) The transcriptome of CEP after 14 days of incubation with 10 µg/mL Pam2csk4 is illustrated as log2 fold change relative to the unstimulated half. Significance was tested using one-way ANOVA, corrected with the two-stage linear step-up procedure of Benjamini, Krieger, and Yekutieli. * p < 0.05, *** p < 0.001.

