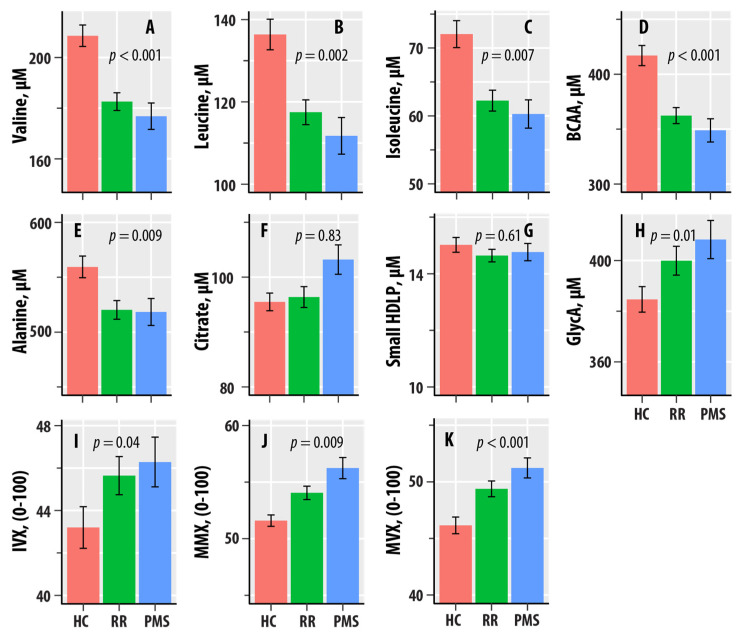
Figure 1.
(A–I) are bar graphs summarizing results from nuclear magnetic resonance spectroscopic profiling in healthy controls (HCs, salmon bars), relapsing–remitting multiple sclerosis (RR, green bars), and progressive MS (PMS, blue bars). The levels of valine (A), leucine (B), isoleucine (C), total branched-chain amino acids (BCAAs, D), alanine (E), citrate (F), small HDL particles (G), and glycated proteins (GlycA, H) are in µM. The values of the Inflammation Vulnerability Index (IVX, I), the Metabolic Malnutrition Index (MMX, J), and the Metabolic Vulnerability Index (MVX, K) range from 0 to 100. The bars represent mean values, and the error bars are standard errors. The regression p-values from Table 1 are shown.

