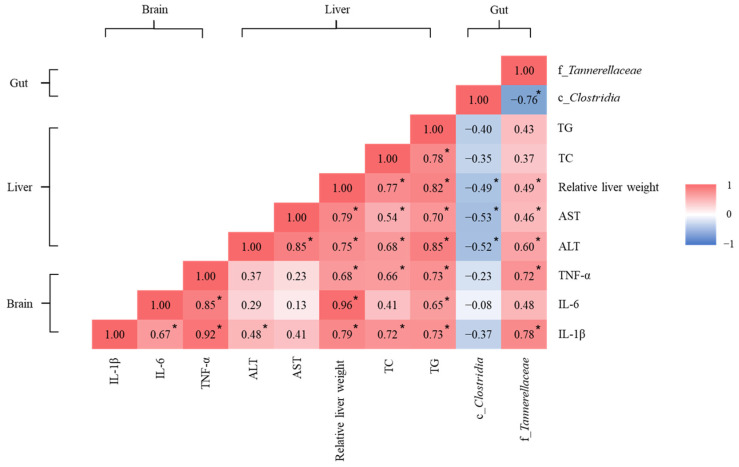
Figure 6.
Heatmap of linear regression for biomarkers of the brain and liver with specific gut microbiota. IL: interleukin; TNF-α: tumor necrosis factor-α; ALT: alanine transaminase; AST: aspartate transaminase; TC: total cholesterol; TG: triglyceride. Colors were assigned according to the distribution of the Pearson correlation coefficient: red and blue represent positive and negative correlations, respectively. * p < 0.05, significant correlations.

