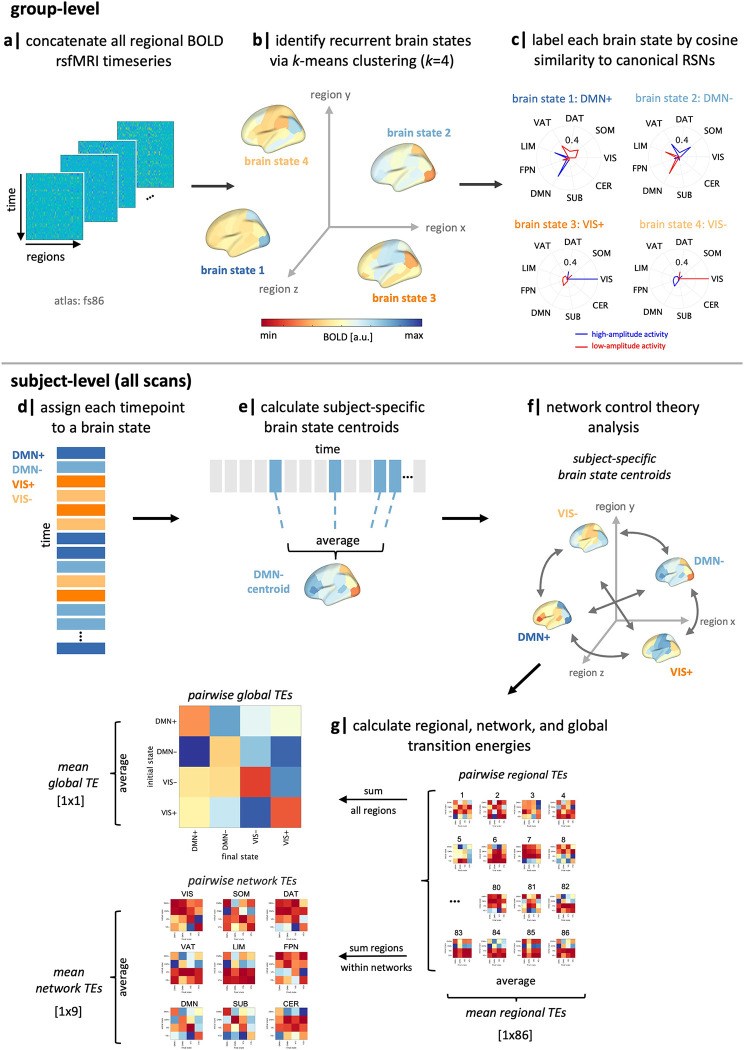
Figure 1.
Workflow. (a-b) We applied k-means clustering to regional rsfMRI time series of all subjects to identify four recurring “brain states”. (c) We calculated the cosine similarity of high and low amplitude activity with the Yeo 7-networks (59) plus subcortical and cerebellar networks and named each state by taking the maximum of those values. (d-e) For each subject, individual time frames in the fMRI scan were assigned to a brain state, and subject-specific brain state centroids were calculated. (f) Network control theory was then implemented using a group-average structural connectome to calculate the transition energy (TE) required for transitioning between pairs of subject-specific brain states. (g) Pairwise and mean TE values were computed at global, network, and regional levels for every individual in the dataset. SUB = subcortical structures, CER = cerebellar structures, VIS = visual network, SOM = somatomotor network, DAT = dorsal attention network, VAT = ventral attention network, LIM = limbic network, FPN = frontoparietal network, DMN = default mode network, RSN = resting-state network, TE = transition energy.

