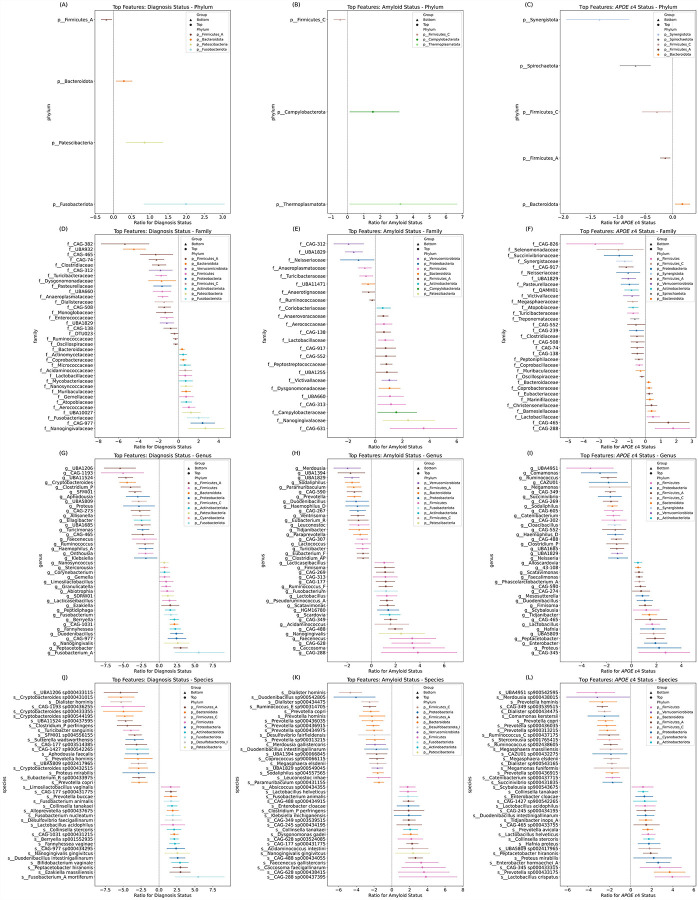
Figure 2. Differential abundance (DA) across AD groups.
Forest plots illustrating the DA of microbial features associated with AD groups. (A, D, G, and J) Contrasts in the abundance of various bacterial taxa at (A) phylum, (D) family, (G) genus, and (J) species levels between AD dementia and CU. (B, E, H, and K) The differences in abundance at these taxonomic levels between A+ and A− individuals. (C, F, I, and L) The microbial features differentially abundant between APOE ε4+ and APOE ε4− groups. The x-axes quantify the log ratio of presence between groups, with values above one indicating a higher abundance in the first-mentioned group. Circles denote “Top” features, indicating a positive association with AD groups (dementia diagnosis, amyloid positivity, and APOE ε4 positivity), whereas triangles denote “Bottom” features, indicating a negative association. The lines are color-coded by unique phylum as labeled in the legend. DA analysis was conducted using BIRDMAn.

