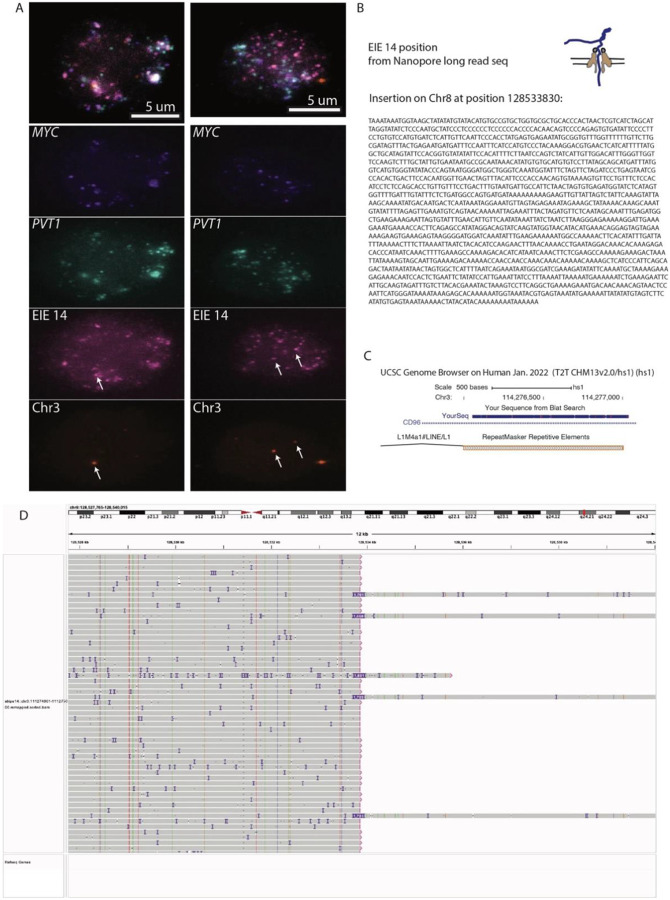
Extended Data Fig. 2:
A. ORCA (Optical Reconstruction of Chromatin Architecture) visualization of the COLO320DM cell nucleus. The images show the spatial arrangement of the MYC oncogene, Element 14 and the PVT1 locus, labeled in different colors. The scale bar represents 5 micrometers. Chr3 probe maps to the breakpoints of the EIE 14 origin inside CD96 intron.
B. EIE 14 position and structural variant “insertion” on Chr8 between CASC8 and CASC11, full sequence is listed in the methods part for the luciferase enhancer assay. The full SV list is in Supplementary Tables T4 and T5.
C. Sequence alignment of the T2T genome.
D. Screenshot of the IGV viewer with selected long reads depicting insertion sizes in purple.

