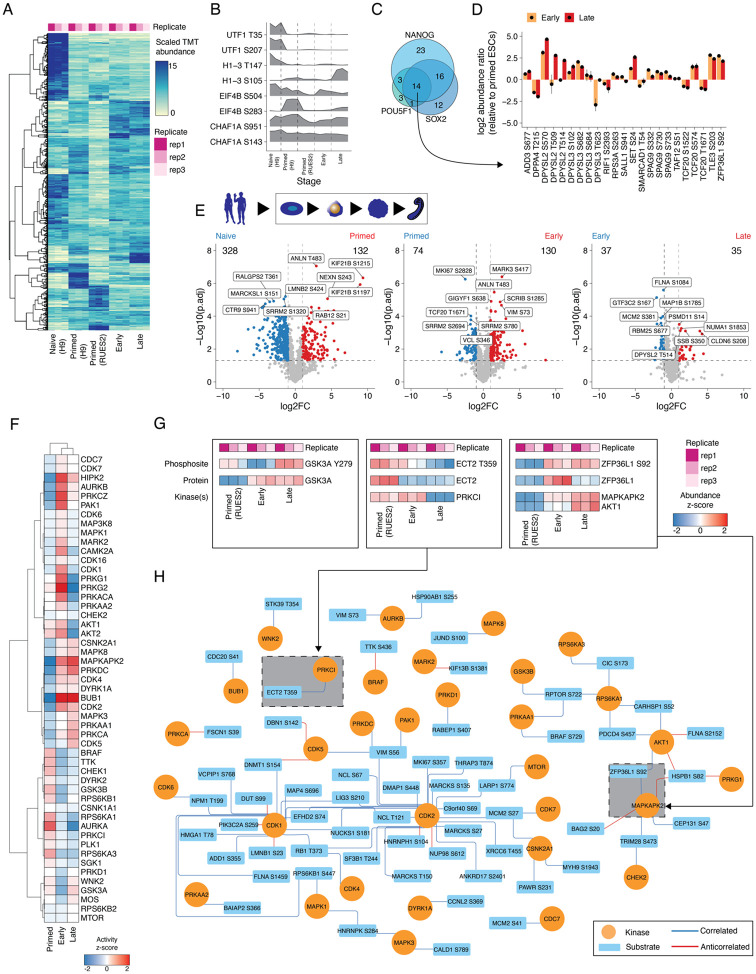
Figure 5. Quantitative phosphoproteomics reveals kinase activities across gastruloid development.
(A) The temporal dynamics of phosphorylated peptides across human gastruloid development. Rows indicate phosphosites, while columns signify sample type. Color scale indicates the scaled TMT abundance of individual phosphopeptides. (B) Ridgeplots depicting the characteristic phosphorylation states within a given protein. (C) Venn diagrams depicting the detection of phosphorylated proteins that are targets of pluripotency factors SOX2, POU5F1 and NANOG. Gene sets curated from Van Hoof et al.110 (D) Phosphosites associated with downstream targets of pluripotency factors. Y-axis indicates the log2 abundance ratio of early (yellow) or late (red) gastruloids to primed RUES2-GLR ESCs. Mean abundance ratios are indicated with dots and error bars represent the standard deviation. (E) Volcano plots of phosphosite abundance changes across consecutive stages of human gastruloid developmental stages. X-axis represents the log2 fold change between 2 timepoints and the y-axis represents the negative log10 of the BH-adjusted p-value. Phosphosites were normalized to their protein levels before differential expression testing. Labeled points indicate the top 5 most significant differentially expressed phosphosites between pairs of comparisons. (F) Heatmap depicting the z-scores of kinase-substrate enrichment analysis. (G) Representative examples of temporal phosphosite dynamics in comparison to their respective proteins and cognate kinases. Color scale indicates the abundance z-score. ECT2 T359 was correlated with PRKCI, while ZFP36L1 S92 was strongly correlated with both MAPKAPK2 and AKT1. (H) Network of kinases (circles) connecting to their substrates (rectangles). Pairs annotated from PhosphositePlus. Edge colors indicate correlated (blue) or anticorrelated (red) relationships (absolute rPearson >= 0.5) between kinase and substrate phosphosite nodes.

