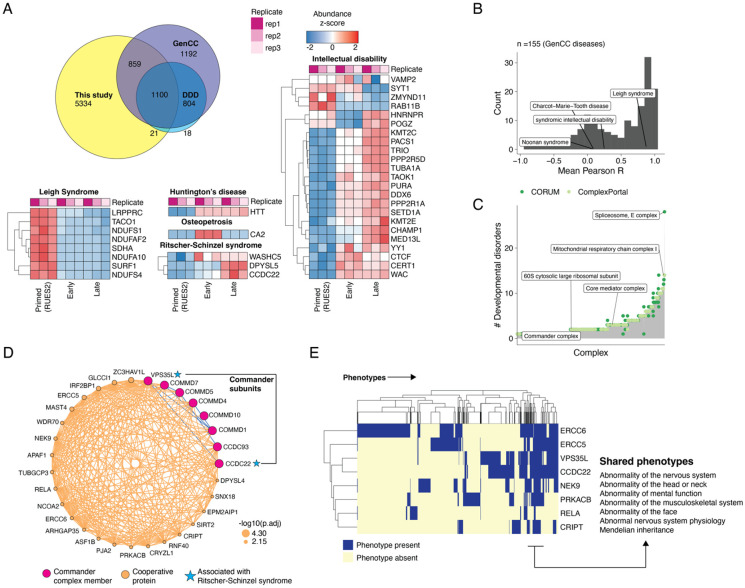
Figure 6. Co-regulatory networks of protein dynamics in gastruloids link to shared phenotypes and developmental disorders.
(A) Overlap of proteins detected across our dataset, GenCC and DDD. Heatmaps correspond to the temporal abundance changes of human proteins (rows) associated with a specific developmental disorder across human gastruloid development (columns). (B) Distribution of mean Pearson correlation coefficients across GenCC disease sets. Only diseases with >=2 genes are plotted. Mean rPearson was calculated by averaging Pearson correlation coefficients detected pairs of proteins in our dataset. (C) Histogram of the number of developmental disorders associated (y-axis) with genes comprising protein complexes (x-axis). (D) Co-regulation network of the Commander complex subunits. Size of orange nodes indicates the significance of cooperative association (−log10 of the adjusted p-value; Fisher’s exact test, see Methods). Proteins associated with developmental disorders (blue stars) were linked to the Commander complex co-regulation network. (E) Heatmap depicting the extent of shared phenotypic overlap (columns) across genes (rows) in the Commander subnetwork.

