

Abstract
Introduction:
Deep learning models hold great promise for digital pathology, but their opaque decision-making processes undermine trust and hinder clinical adoption. Explainable AI methods are essential to enhance model transparency and reliability.
Methods:
We developed HIPPO, an explainable AI framework that systematically modifies tissue regions in whole slide images to generate image counterfactuals, enabling quantitative hypothesis testing, bias detection, and model evaluation beyond traditional performance metrics. HIPPO was applied to a variety of clinically important tasks, including breast metastasis detection in axillary lymph nodes, prognostication in breast cancer and melanoma, and IDH mutation classification in gliomas. In computational experiments, HIPPO was compared against traditional metrics and attention-based approaches to assess its ability to identify key tissue elements driving model predictions.
Results:
In metastasis detection, HIPPO uncovered critical model limitations that were undetectable by standard performance metrics or attention-based methods. For prognostic prediction, HIPPO outperformed attention by providing more nuanced insights into tissue elements influencing outcomes. In a proof-of-concept study, HIPPO facilitated hypothesis generation for identifying melanoma patients who may benefit from immunotherapy. In IDH mutation classification, HIPPO more robustly identified the pathology regions responsible for false negatives compared to attention, suggesting its potential to outperform attention in explaining model decisions.
Conclusions:
HIPPO expands the explainable AI toolkit for computational pathology by enabling deeper insights into model behavior. This framework supports the trustworthy development, deployment, and regulation of weakly-supervised models in clinical and research settings, promoting their broader adoption in digital pathology.
Introduction
Digital pathology has emerged as a transformative force in medicine, ushering in an era where computational methods can augment and enhance the diagnostic and prognostic capabilities of pathologists. By digitizing whole slide images (WSIs) of tissue specimens, this field has opened new avenues for applying advanced machine learning techniques to analyze complex histological patterns and features. The potential impact of computational pathology is far-reaching, promising to improve diagnostic accuracy, standardize interpretation, and uncover novel biomarkers that may inform personalized treatment strategies1–15.
Building on these advances, the development of pathology foundation models represents a leap forward in computational pathology. These models have significantly expanded the field’s capabilities by providing powerful, generalizable tools for analyzing histological features16–27. They are trained on vast collections of histology image patches in a self-supervised manner, enabling them to learn general-purpose representations of histological features. By focusing on patches, foundation models can efficiently process the large size and complexity of WSIs while capturing key local patterns. The representations learned by these models can be utilized in downstream tasks by incorporating patch-level embeddings as inputs for downstream models. For specimen-level prediction tasks, these embeddings are often integrated into an attention-based multiple instance learning (ABMIL28) framework. In this approach, the foundation model provides patch-level feature representations, and ABMIL aggregates and prioritizes relevant patches to generate specimen-level predictions. This combination has quickly become the standard for leveraging foundation models in specimen-level classification, offering a scalable and effective way to utilize their pre-trained knowledge for complex clinical and research applications.
Unlike traditional image classification methods, ABMIL models rely on specimen-level labels, eliminating the need for exhaustive pixel-level annotations29. This flexibility has enabled ABMIL to excel across a range of tasks, including cancer detection30, 31, diagnosis32–35, identification of primary cancer origin36, grading31, 37, 38, genomic aberration detection39–42, molecular phenotyping43–45, treatment response prediction46–48, and prognostication47, 49–51. The integration of foundation models with ABMIL has proven particularly effective, combining the generalization capabilities of pre-trained models with the task-specific focus of ABMIL to advance computational pathology.
However, the widespread adoption of ABMIL models in clinical settings is hindered by challenges in model interpretability and trustworthiness9, 10, 52–56. Explainable AI methods have been proposed to address these challenges by providing insights into model behavior and identifying features that may influence predictions. Techniques such as LIME57, SHAP58, and SmoothGrad59 offer strategies to estimate feature contributions in input images. However, these methods often rely on linear or additive approximations, which can oversimplify complex model behaviors and fail to align with actual model predictions60, 61. Attention mechanisms have emerged as a widely used approach for interpreting ABMIL models, as evidenced by their extensive use in recent studies22, 28, 36, 45, 46, 50, 62–69. Although attention highlights regions of interest within WSIs, it does not directly quantify the influence of these regions on model predictions70, 71. This gap between attention and predictive influence can lead to misinterpretation, undermining trust in model decisions and limiting clinical applicability72–75. Addressing this limitation requires methods that explicitly evaluate the contribution of specific regions to model outputs.
One such approach was introduced by Zeiler and Fergus, occluding parts of an image with gray boxes and observing how the model’s predictions change76. This approach can help identify which parts of an image are most relevant to a model’s decision. However, when applied to pathology, this method has limitations. Covering regions of WSIs with gray patches can cause erratic behavior in the model, as these unnatural patterns are not encountered during training, leading to interpretations that may be difficult to trust. While identifying regions to occlude in natural images often aligns with human intuition, this becomes more challenging in WSIs, where multiple regions of interest may collectively influence predictions. Additionally, occlusion methods only indicate the importance of regions but do not address whether the identified features are sufficient to drive the model’s predictions.
To better understand how specific tissue features influence model predictions, generating realistic counterfactual WSIs is essential. Counterfactual WSIs allow us to explore “what if” scenarios by systematically altering tissue features and observing the impact on model behavior. For example, resizing a tumor region could help determine the model’s sensitivity to tumor size, while modifying the number and distribution of tumor-infiltrating lymphocytes might reveal their role in influencing predictions, such as for prognosis or treatment response.
However, creating reliable counterfactual WSIs presents significant challenges. First, precise segmentation of tissue structures is necessary to enable targeted alterations without affecting unrelated regions. Second, robust inpainting techniques are required to fill in altered regions realistically, ensuring the resulting WSI appears biologically plausible. Although recent advances in generative AI show promise for creating synthetic images77, applying these methods at the gigapixel scale for WSIs remains a technical challenge. The ability to generate realistic and valid counterfactual WSIs for clinical use has yet to be proven.
To address these challenges, we introduce HIPPO (Histopathology Interventions of Patches for Predictive Outcomes), an explainable AI method designed to enhance trust in ABMIL models and provide deeper insights into their decision-making processes. HIPPO goes beyond traditional attention-based interpretations by quantitatively assessing the impact of specific tissue regions on model predictions. HIPPO also leverages properties of multiple instance learning models to generate valid WSIs through the occlusion or inclusion of individual or groups of patches, simulating targeted interventions to understand how different histological features influence ABMIL model outputs.
We validate HIPPO across three distinct tasks: metastasis detection, prognostication, and IDH mutation classification. In the context of metastasis detection, we evaluate five foundation models in pathology using the CAMELYON16 dataset30. This dataset includes expert-annotated labels and thus allows us to rigorously assess HIPPO’s ability to align with established ground truth and demonstrate its practical utility. Our analysis uncovers model-specific limitations and biases that would have remained hidden using attention mechanism alone. We reveal that some models rely heavily on extratumoral tissue for metastasis detection, while others are surprisingly insensitive to small tumor regions. These findings highlight the importance of rigorous model evaluation beyond standard performance metrics and underscore the potential of HIPPO in identifying when and why models might fail. Building on this validation, we then aplied HIPPO to cancer prognostication in breast cancer and cutaneous melanoma datasets from The Cancer Genome Atlas. Our results demonstrate that HIPPO can identify tissue regions more strongly associated with prognosis compared to those highlighted by attention. Strikingly, we find that high-attention regions can sometimes have counterintuitive effects on prognostic predictions, further emphasizing the limitations of relying solely on attention for model interpretation. By quantitatively assessing the impact of tumor-infiltrating lymphocytes (TILs) on model predictions, we confirm that the models have captured the known prognostic significance of TILs in both breast cancer and melanoma. This ability to link model behavior to established biological knowledge is crucial for building trust in AI-driven prognostic tools. Finally, we applied HIPPO to IDH mutation classification in glioma and found that HIPPO outperformed attention in identifying the histological regions driving false negatives. By providing more precise and interpretable insights into model predictions, HIPPO enabled a clearer understanding of the reasons behind misclassifications.
Beyond model interpretation, HIPPO opens new possibilities for virtual hypothesis generation in computational pathology. We showcase this potential by using HIPPO to simulate the effects of autologous TIL therapy in melanoma patients. By digitally replicating TILs in specimens with poor prognosis, we demonstrate a proof-of-principle approach for identifying patients who potentially might benefit from this immunotherapy. This application illustrates how HIPPO can bridge the gap between computational predictions and clinically actionable insights.
As computational pathology continues to advance, the need for robust, interpretable, and trustworthy AI models becomes increasingly critical. HIPPO represents a significant step forward in this direction, offering a powerful tool for uncovering the strengths, limitations, and potential biases of ABMIL models in pathology. By providing a more comprehensive understanding of model behavior, HIPPO not only enhances the interpretability of existing models but also paves the way for developing more reliable and clinically relevant AI tools in pathology. As we demonstrate across multiple applications, from metastasis detection to prognostic modeling and mutation classification, HIPPO has the potential to accelerate the translation of computational pathology into clinical practice, ultimately improving patient care and outcomes.
Results
HIPPO: Histopathology Interventions of Patches for Predictive Outcomes
HIPPO is a specimen-level perturbation toolkit that explains weakly-supervised models in computational pathology (Fig. 1a). The fundamental goal of HIPPO is to explore counterfactual (i.e., “what if”) scenarios that are infeasible to realize in actual tissue samples. For instance, it would be impractical to directly manipulate the tumor microenvironment of a tissue specimen to understand its effect on a prognostic model. Instead, we can digitally modify a WSI that simulates this intervention. HIPPO enables virtual interventions through the occlusion or inclusion of single or multiple patches, utilizing the resulting ABMIL model predictions as counterfactual outcomes. HIPPO provides quantitative insights into how specific tissue alterations might impact pathological assessments through the lens of the AI model. These assessments can include but are not limited to, patient prognosis, treatment response prediction, metastasis detection, inference of spatial transcriptomics, gene mutation detection, and microsatellite instability identification. Applying HIPPO to ABMIL models enables researchers, regulators, and clinicians to elucidate model behavior and to better understand the relationship between patch-level tissue characteristics and model outputs.
Figure 1. HIPPO explainable AI toolkit.

HIPPO enables quantitative assessment of how specific tissue regions impact model predictions, enhancing interpretation and validation of AI models. a, Schematic of attention-based multiple instance learning. Whole slide images are divided into patches and embedded using a pretrained foundation model. ABMIL learns specimen-level labels from these bags of patches, assigning attention weights to each patch. Leveraging ABMIL’s invariance to patch order and count, we can create counterfactual specimens by adding or removing tissue regions within patches. Model outputs are then compared between original and counterfactual specimens to measure effects. b, HIPPO quantifies the effect of high-attention regions by removing them and measuring the resulting change in model outputs. c, HIPPO implements greedy search algorithms to identify necessary or sufficient tissue regions de novo.
Traditional approaches to digital interventions in medical imaging often require precise segmentation of objects for occlusion or inclusion76, 78, as well as sophisticated inpainting techniques to maintain image integrity79–82. Alternatively, generative AI can generate counterfactual images83, 84, but the quality of the generated images has not been thoroughly evaluated for histopathology. These manual or AI-assisted methods can introduce covariate shifts when imperfectly executed85, potentially leading to unreliable model predictions. The key insight for HIPPO is based on how data flows through ABMIL models. A WSI is treated as a bag of permutation-invariant patches, where the number and order of patches are allowed to vary28. Thus, an intervention can be achieved through two primary perturbation mechanisms: (1) removing specific patches, effectively excising tissue from the input specimen, or (2) including specific patches, simulating the addition of new tissue into the specimen. HIPPO leverages unique properties of multiple instance learning models to facilitate the generation of counterfactual images bypassing the complexities of direct image manipulation by creating hypothetical scenarios such as the introduction or removal of tumor patches or regions of tumor-infiltrating lymphocytes (TILs) from a patient’s specimen. Understanding when ABMIL models alter their predictions due to interventions provides quantitative insights into their decision making process, revealing important features and potential biases learned.
HIPPO offers hypothesis-driven and data-driven methods for intervention selection:
HIPPO-knowledge: choosing a region based on prior knowledge or a well-defined hypothesis and quantifying its effect by removing it from specimens or adding it to specimens without that region and measuring the change in model outputs (Fig. 1a).
HIPPO-attention: quantifying the effect of high attention regions by removing the high attention regions and measuring the change in model outputs (Fig. 1b).
HIPPO-search-high-effect: a greedy search algorithm to identify the regions that maximally drive a prediction. This can be used to identify regions necessary for a model’s output (Fig. 1c).
HIPPO-search-low-effect: a greedy search algorithm to identify the regions that lead to the smallest change in model predictions. This can be used to identify the regions that do not change model predictions and, therefore, are not necessary for the output of a model. After removing unnecessary regions, the remaining regions can be considered sufficient for the model prediction (Fig. 1c).
Hypothesis-driven interventions leverage prior knowledge of relevant patches, which can be identified with the assistance of pathologists or annotation tools. In cases where prior information is unavailable or when important features are sub-visual (e.g., in prognostic prediction tasks), data-driven interventions can automatically identify important patches de novo. Unlike traditional attribution methods that rely on additive approximations, HIPPO supports multi-patch interventions, enabling the exploration of how sets of patches collectively drive non-linear effects on predictions.
It is important to note that HIPPO generates counterfactual predictions based on the capabilities of the underlying AI model. Consequently, if the AI model has limitations in capturing complex biological relationships, these limitations will inherently influence HIPPO’s explanations. Furthermore, the resolution of HIPPO’s interventions is constrained to patches, which may restrict its ability to capture finer-grained details. Despite these constraints, HIPPO offers a novel and powerful approach for interrogating the biological factors driving predictions, shedding light on the decision-making process of AI models in unprecedented ways.
With the advent of digital pathology foundation models, it is important to evaluate model robustness, generalizability, and potential biases and understand their limitations. Here, we showcase the breakthroughs made possible by HIPPO in rigorously evaluating models built on top of foundation models for breast metastasis detection and prognosis prediction tasks. We compare five foundation models in metastasis detection and identify model-specific limitations and biases. We also use HIPPO to study the effects of tissue components on prognostic models, demonstrating how HIPPO’s capabilities surpass attention in identifying low and high-risk drivers. We also measure the effect of TILs on breast cancer and melanoma patient prognosis and demonstrate digitally that autologous TILs improve predicted prognosis in a subset of melanoma patients, marking exciting progress in the field.
Do MIL models think tumor is necessary for breast cancer metastasis detection?
Metastasis detection is a well-studied task, with well-defined features (i.e., tumor cells) that drive the label of whether or not a specimen contains metastasis. In a clinical setting, it is critical that metastases are identified; a false negative is unacceptable. Recent studies have shown that ABMIL models have strong performance in metastasis detection20. However, previous studies have also found that computer vision models can make the correct predictions for the wrong reasons, such as short-cut features or spurious correlations86, 87. Thus, the degree to which AI models rely on the tumor regions remains to be seen, even for a relatively straightforward task like tumor detection. Understanding this is critical to elucidate the strengths and limitations of ABMIL models for metastasis detection, including potential biases.
To evaluate this, we trained several ABMIL models for breast metastasis detection using the CAMELYON16 dataset30 (Fig. 2a). Several pathology foundation models have recently emerged, demonstrating near-human levels in metastasis detection. Here we consider five pathology foundation models (UNI20, REMEDIS16, Phikon18, CTransPath17, and RetCCL19). We trained five ABMIL models for each foundation model to distinguish whether or not a specimen contained metastasis. Similar to previously reported results20, UNI achieved a mean balanced accuracy of 0.982, REMEDIS 0.922, Phikon 0.907, CTransPath 0.858, and RetCCL 0.745. (Fig. 2b, Supplementary Table 1). For HIPPO explainability experiments, we used the best-performing model (out of 5 random initializations) on the test set for each foundation model. The best UNI model achieved balanced accuracy of 1.00, REMEDIS 0.949, Phikon 0.955, CTransPath 0.885, and RetCCL 0.769 (Supplementary Table 2).
Figure 2. Understanding the role of tumor in detecting metastases.

a, Example WSI from the CAMELYON16 dataset containing a macrometastasis (specimen test_001), with a 128 × 128 μm patch highlighted. b, Bar plot of balanced accuracy, sensitivity, and specificity on the CAMELYON16 test set (n=129, 80 negative, 49 positive) across five random initializations and five encoders, with mean values and 95% confidence intervals. The best-performing model for each encoder was used in subsequent experiments. c-d, Bar plots showing specificity when tumor-containing patches are removed (c) and sensitivity when only tumor tissue remains (d) in positive specimens (n=49, 22 macrometastases, 29 micrometastases), quantifying necessity and sufficiency of tumor regions for metastasis detection. e, Bar plot of sensitivity after adding metastases to negative specimens (3920 counterfactuals: 80 negative × 49 positive), further quantifying tumor sufficiency. f, Bar plot showing sensitivity of counterfactuals with a single 128 × 128 μm tumor patch in normal (n=80) and metastatic (n=49) specimens. g, Strip plot of model probabilities for tumor patches in specimen test_051 using the UNI-based ABMIL model, comparing original, tumor-removed, and single-tumor-patch (n=125) conditions. h, Line plot relating tumor size to model sensitivity, with each point representing 3920 counterfactuals (80 negative × 49 positive) as tumor patches are added to negative specimens.
In this dataset, expert pathologists have produced high resolution annotations of metastatic tumor regions. This allows us to use the HIPPO-knowledge method to determine whether metastatic regions are necessary for detecting breast cancer metastasis. Specifically, for patients who were positive for metastasis, we created counterfactual examples by removing all patches that intersected with the tumor annotations. If we assume that a model must rely on tumor-containing patches to make a prediction, an accurate model would always return a negative prediction when all tumor containing patches have been removed. In the following, we use specificity to quantify model behavior. Specificity is defined as the ratio of true negatives to all negative samples. In this set of counterfactuals, all specimens were negative, so the specificity represented the proportion of correct negative predictions by the models.
We compared model predictions before and after removing patches containing tumor. Notably, the UNI-based model exhibited the lowest specificity (0.73) in these counterfactual examples despite achieving the highest balanced accuracy on the original test set (1.00). This discrepancy was particularly pronounced in counterfactual specimens that originally contained macrometastases (specificity 0.59), suggesting that the UNI-based ABMIL model uses tissue outside of the tumor region to drive positive metastasis predictions. The REMEDIS-based model exhibited a similar trend, with a specificity of 0.77 in counterfactuals derived from macrometastases. In contrast, the other models showed less dependence on extratumoral tissue (sensitivity of Phikon-based, 0.86; CTransPath-based, 0.92; RetCCL-based, 0.88), indicating that their predictions are primarily driven by tumor epithelial cells rather than other tissue components (Fig. 2c).
We hypothesized that the low specificity of the UNI-based ABMIL model may be attributed to metastasis-induced alterations in the surrounding tumor microenvironment. To investigate this, we used HIPPO-knowledge to remove increasingly larger regions surrounding the tumor annotation and quantified the effect on metastasis detection. As the extent of peritumoral tissue removal increased, the UNI-based model was consistently more likely to predict the absence of metastasis. Specificity increased from 0.73 at dilation of 0 μm, to 0.78 at 64 μm, to 0.80 at 128 μm, to 0.86 at 256 μm, and to 0.88 at 1024 μm. This was driven primarily by macrometastatic specimens, where specificity increased from 0.59 at dilation of 0 μm to 0.68 at dilation of 64 μm, to 0.73 at dilation of 128 μm, to 0.82 at dilation of 256 μm, to 0.86 at dilation of 1024 μm. Notably, other ABMIL models remained largely unaffected by peritumoral tissue removal, highlighting a unique characteristic of the UNI-based model (Supplementary Fig. 1). In summary, HIPPO enabled the quantitative exploration of peritumoral tissue on metastasis detection.
Is tumor sufficient for breast cancer metastasis detection?
While necessity assesses the importance of a feature or feature set, it does not inform whether the feature set is sufficient for model predictions. Metastasis detection models must be able to detect tumor regions no matter how small. Using the HIPPO-knowledge method, we tested the sufficiency of metastatic regions using two methods: removing all non-tumor patches and measuring model outputs and adding tumor regions to normal specimens and measuring model outputs.
First, we constructed counterfactual specimens (n=49) by removing all non-tumor tissue (i.e., removing patches that did not intersect with expert tumor annotations) and measuring model outputs. With only the tumor present, the true label for these images was “positive”, and the foundation models had the following sensitivity (true positive rate): UNI-based 0.98, REMEDIS-based 0.92, Phikon-based 0.98, CTransPath-based 0.96, RetCCL-based 0.82 (Fig. 2d). There is evidence to suggest that extratumoral tissue caused false negative predictions. Four of the five foundation models improved sensitivity when using only tumor tissue in micrometastases compared to the original positive samples, suggesting that extratumoral tissue drove false negative predictions. The sensitivity of CTransPath increased by 25%, Phikon by 4%, REMEDIS by 5%, and RetCCL by 100%. For UNI, however, using original WSIs resulted in a sensitivity of 1.0 on micrometastasis. However, when using only the tumor tissue, one false negative prediction suggested that the UNI-based model may use tissue outside of the metastatic region in its predictions. Critically, this demonstrated that the tumor was insufficient for a positive prediction in this specimen with the UNI-based model and that extratumoral tissue was solely driving the positive prediction. RetCCL had a true positive rate in macrometastases of 0.95 (21 predicted positive of 22 positive specimens). When using only tumor tissue, all macrometastases were detected successfully, demonstrating that tissue outside the metastatic region caused a false negative prediction.
We also evaluated whether tumor was sufficient for metastasis detection by embedding tumor regions in normal specimens. We embedded all patches intersecting with tumor annotations into normal specimens, resulting in 3,920 positive counterfactual examples (80 normal slides × 49 positive slides). Model outputs for these examples were recorded. The UNI-based model had a sensitivity of 0.98, REMEDIS-based 0.86, Phikon-based 0.95, CTransPath-based 0.90, and RetCCL-based 0.63. Positive counterfactuals made with micrometastases were less likely to be detected by most models (UNI-based achieved sensitivity of 0.96, REMEDIS-based 0.75, Phikon-based 0.91, CTransPath-based 0.93, and RetCCL-based 0.40), suggesting that smaller tumors in the context of normal tissue are insufficient for positive metastasis detection (Fig. 2e).
The average treatment effect for each metastatic slide was calculated by averaging the model’s probability of metastasis across all negative samples. This informs which positive slides can drive positive predictions across individuals. 100% of macrometastases (n=22) led to true positives in UNI-based, REMEDIS-based, Phikon-based, and CTransPath-based models. In the RetCCL-based model, 90% (n=20) of macrometastases had an average true positive effect. Micrometastases (n=27) were less likely to induce positive predictions on average, with 96% (n=26) positive in UNI, 93% (n=25) in Phikon, 81% (n=22) in CTransPath, 74% (n=20) in REMEDIS, and 37% (n=10) in RetCCL.
Foundation models may miss small breast cancer metastases
To evaluate the sensitivity of ABMIL models to detect metastasis based on the size of the metastasis in a specimen, we analyzed the metastasis-positive specimens from the CAMELYON16 test set. Our methodology involved initially removing all tile embeddings that intersected with expert tumor annotations, effectively rendering the slide negative for metastases. A 128 × 128 μm region of tumor (shown in the right-hand side of Fig. 2a) was added to 80 normal specimens and 49 metastasis-removed positive specimens. When the single-patch tumor region was embedded in normal specimens, the REMEDIS-, Phikon-, and RetCCL-based ABMIL models detected 100% of counterfactuals as positive, highlighting their robustness to this small region of tumor. The UNI-based model, on the other hand, failed to detect 41% (n=33) of positive counterfactuals (n=80), and the CTransPath-based models failed to detect 35% (n=28) of positive counterfactuals. A similar trend was observed when the tumor region was embedded into the context of metastatic specimens (i.e., the positive specimen with metastasis removed). The REMEDIS-, Phikon-, and RetCCL-based models detected 100% of positive counterfactuals (n=49), whereas the UNI-based model missed 51% (n=25) and CTransPath-based missed 65% (n=32) of positive counterfactuals specimens (Fig. 2f). This result is surprising because the UNI-based model had perfect sensitivity in the original test set (Fig. 2b) as well as the highest sensitivity when larger tumors were embedded into normal tissue (Fig. 2e). This highlights that high classification performance on the held-out test set is insufficient to assess generalization to more nuanced downstream applications.
We also sought to quantify the sensitivity of models to each tumor patch in positive specimens, which can shed light on whether tumor patches carry different levels of informativeness for machine learning classifiers. To accomplish this, all tumor patches intersecting with expert tumor annotations were removed. Then, we reintroduced tiles fully within the expert tumor annotation, one at a time, to the tumor-removed specimen and evaluated the model outputs. These model outputs were compared to those when all tumor was removed. While some tumor patches could drive a positive prediction on their own, many could not (Fig. 2g for the UNI-based model, and other models and specimens are shown in Supplementary Figs. 2–6.).
To further quantify the effect of tumor size in metastasis detection, we added tumor patches into normal slides in a graded fashion and measured the sensitivity. All models exhibited a graded effect of tumor size, and UNI exhibited the highest sensitivity (Fig. 2h). Models tended to plateau in sensitivity at 0.262144 mm2 of tumor (16 patches) added. The RetCCL-based model showed the lowest sensitivity and the least sensitivity to smaller tumors.
To identify the largest amount of tumor that would go undetected by a model, we also used a HIPPO search method, HIPPO-search-low-effect. We found that in some cases, regions up to 1.5 mm2 could be added into a negative counterfactual while still maintaining a negative detection. Indeed, the tumor patches that were insufficient to drive large effect sizes were largely similar to the sufficient patches, though some insufficient patches contained adipose cells along with tumor epithelial cells (Supplementary Fig. 7). This shows that there exist regions within tumors that would go unseen by an ABMIL-based metastasis detection model. These biases should be explored further prior to the clinical use of metastasis detection models.
Peritumoral tissue can cause false positive metastasis detections
Given the effect of peritumoral tissue on UNI-based model predictions, we also evaluated whether peritumoral tissue was sufficient for positive metastasis predictions. A halo of peritumoral tissue was extracted from metastasis-positive specimens (n=49) with a width of 64, 128, 256, or 1024 μm, beginning at either the edge of the expert tumor annotation or 256 μm outside of the tumor annotation. The patches intersecting with the peritumoral halos were added to normal specimens (n=80), resulting in 3920 counterfactual examples (80 normal × 49 positive specimens). Model predictions were averaged across normal specimens, resulting in the average treatment effect of the peritumoral region of each positive specimen. This was evaluated for the UNI-based and Phikon-based models.
Halos of peritumoral tissue were sufficient to drive positive metastasis detection. Halos 1024 μm in width beginning from the edge of the expert tumor annotation from 20% (n=10) of positive specimens caused positive predictions in the UNI-based model when embedded in normal specimens, whereas 10% (n=5) caused positive predictions in the Phikon-based model. When starting the 1024 μm halo 256 μm outside of the tumor annotation, there were 14% (n=7) positive predictions in the UNI-based model and 10% (n=5) for the Phikon-based model. Thinner halos of 64 μm beginning 256 μm outside of the tumor annotation also caused positive predictions: 10% (n=5) in the UNI-based model and 6% (n=3) in the Phikon-based model (Supplementary Fig. 8). These results demonstrate that the models learned an association between peritumoral tissue and the presence of metastasis despite the peritumoral tissue not containing any metastasis. This highlights an important bias that could not have been uncovered using attention alone. HIPPO enabled the quantitative assessment of peritumoral tissue on metastasis detection in multiple foundation models.
Adipose tissue can cause false negative metastasis detections
To investigate patient samples that consistently drove false negative predictions further, we visualized the attention maps of the ABMIL models to identify regions that it considers important. For the CTransPath-based model, we observed that attention was concentrated in adipose regions for specimen test_066 (Figs. 3a and 3b).
Figure 3. Adipose tissue may cause models to miss breast cancer metastases.
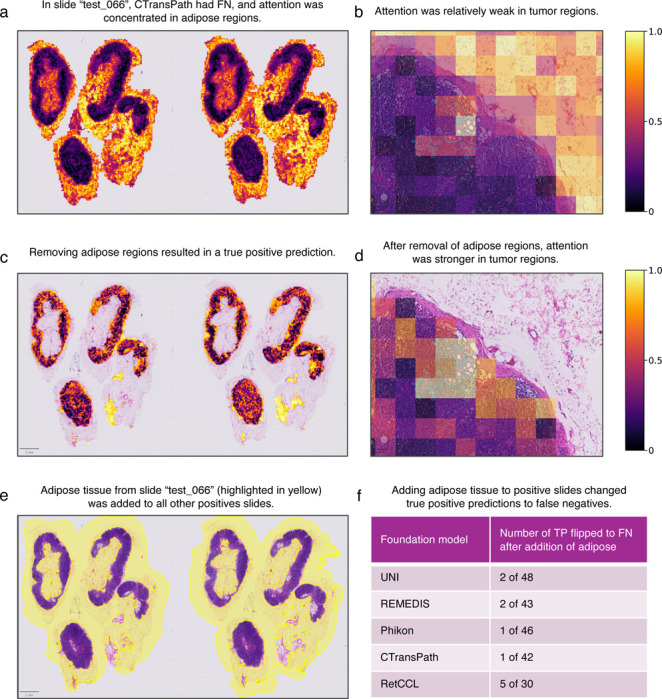
The CTransPath-based ABMIL model misclassified specimen test_066 as negative. a-b, Attention was strongest in adipose regions and relatively weak in the tumor. This led us to hypothesize that the adipose regions were causing the misclassification. c-d, The true positive prediction was rescued after adipose regions were removed. In addition, attention was concentrated in tumor regions (d). To evaluate how general the effect of this adipose tissue was on preventing true positive predictions, we added the embeddings from the adipose region (yellow highlighted region in e) to all positive slides except test_066. f, The addition of adipose tissue caused several true positive predictions to switch to false negatives, suggesting that the adipose tissue may cause false negatives.
Since attention maps only provide a qualitative visualization of regions in an image that the ABMIL models consider important, it is unclear to what extent adipose tissue directly affects model predictions. We address this with HIPPO-attention. The patches with adipose tissue were removed, and the effect of this perturbation on model outputs was quantified. We found that removing the adipose tissue rescued the true positive prediction in specimen test_066, suggesting that fat caused the false negative prediction (Figs. 3c and 3d). To test whether the adipose tissue from test_066 would cause a misclassification in other models and specimens, we added the adipose regions from that specimen into the 48 other positive specimens. We then recorded whether the addition of adipose tissue caused false negative predictions. We found that true positives were flipped to false negatives in 2, 2, 1, 1, and 5 specimens for UNI, REMIDIS, Phikon, CTransPath, and RetCLL, respectively (Figs. 3e and 3f). This highlights how HIPPO can elucidate biases that cause misclassification. While attention alone could not inform that adipose was the cause of misclassification, it was useful to formulate a hypothesis that we can test with HIPPO-attention. This demonstrates how HIPPO can complement attention-based interpretability analysis to quantitatively test hypotheses of putatively important tissue regions.
HIPPO identifies shortcut learning when attention struggles
Identifying spurious correlations in deep learning models for medical imaging is crucial to ensure reliable and clinically relevant results. To test HIPPO’s ability to identify spurious correlations, we conducted an experiment where we deliberately introduced an artificial bias into the CAMELYON16 dataset (Supplementary Figs. 9a and 9b). Specifically, 768 × 768 μm blue squares were added to all negative images. This mimics the plausible scenario in which a pathologist marks certain slides with a blue marker. However, in doing so, it introduces a strong spurious correlation with labels. We hypothesized that the models would learn that slides were negative if a blue region was present and that slides lacking this blue region are positive (as blue regions are easier to identify compared to more variable tumor regions).
An ABMIL model was trained on the modified training data using UNI embeddings. The model achieved a balanced accuracy of 1.0 on the test set, suggesting the spurious correlations created a trivial prediction task. By performing standard model interpretation using attention, we found that metastatic regions were considered highly important (Supplementary Fig. 9c). However, removing these regions using HIPPO did not alter the model predictions, demonstrating that tumor regions were not important for model predictions despite a strong attention assignment. This highlights an important weakness of attention: the disconnect between attended regions and model predictions.
Knowing that the metastatic regions did not affect model outputs, we used the search algorithm HIPPO-search-high-effect to identify the regions that maximally drove positive tumor predictions in both models using one positive specimen, test_002. Given that the model trained with spurious correlations uses the lack of a blue square as a cue for positive specimens, we expected that no individual patches would drive the positive metastasis output and that tumor regions would not have a high effect on the prediction. Indeed, effect sizes were small and evenly distributed across the WSI (minimum 2.1 × 10⁻⁵, maximum 0.02, mean 9.4 × 10⁻⁵, and median 5.5 × 10⁻⁵), indicating that no single region contributed strongly to the model prediction (Supplementary Fig. 9d). By contrast, applying this search algorithm to the model trained on the original CAMELYON16 dataset, we found that patch effect sizes were higher (minimum 3.7 × 10⁻⁸, maximum 0.09, mean 1.3 × 10⁻⁴, and median 4.9 × 10⁻⁸), and high effect patches were within expert tumor annotations (Supplementary Fig. 9e). By tying interpretation analysis directly to predictions, HIPPO-based interpretations may provide more reliable explanations of model predictions.
Shortcut learning is an important bias that must be identified and addressed in deep learning on medical images. In this case, model performance and attention were insufficient to diagnose the shortcut learning. Observational analysis based on attention maps could easily mislead an observer to believe that tumor regions drive model predictions. Quantifying effect sizes of tumor regions using HIPPO addressed these limitations and diagnosed the shortcut learning.
Refining the search for prognostic tissue biomarkers
Having demonstrated HIPPO’s effectiveness in metastasis detection, where the regions of interest are well-defined and were previously annotated by expert pathologists, we extended our investigation to the more complex domain of cancer prognosis. Unlike the clear delineation of tumor regions in metastasis detection, prognostic factors in WSIs are multifaceted and less clearly defined. We applied HIPPO to prognostic models that generate risk scores from WSIs, aiming to identify the tissue regions driving these predictions. Our experiments with HIPPO yielded two key insights. First, HIPPO’s search algorithms demonstrated superior ability in identifying tissue patches that consistently and significantly influence risk predictions compared to conventional attention-based methods. While attention mechanisms yielded mixed effects — potentially identifying regions that counterintuitively drive lower risk in otherwise high-risk specimens — HIPPO provided a more consistent, reliable, and quantitative assessment of the regions that drive risk. Second, HIPPO’s unique features enable virtual experiments to measure the effects of targeted tissue interventions on prognostic outcomes through the lens of the ABMIL model. HIPPO’s potential to accelerate the discovery and validation of prognostic tissue biomarkers is an exciting development in cancer research, potentially bridging the gap between computational predictions and clinical actionability.
We trained prognostic ABMIL models using the PORPOISE framework50, a computational tool designed for predicting survival outcomes from histopathology images, to predict overall survival from WSIs in breast cancer (TCGA-BRCA) and cutaneous melanoma (TCGA-SKCM) (Supplementary Fig. 10). The same training and validation splits were used as in the original publication. Non-overlapping 128 × 128 μm patches from WSIs were embedded using the UNI model20 (in the original PORPOISE publication, a truncated ResNet5088 was used). Low and high risk were defined as the first and fourth quartiles of risk scores. High attention regions were defined as the top 1% of attended patches, and HIPPO search algorithms were also used to identify the top 1% of patches by effect size.
High attention regions drove counterintuitive effects in many specimens, while HIPPO-search-low-effect and HIPPO-search-high-effect identified more robust and consistent drivers of risk. High attention regions in high-risk cutaneous melanoma specimens (n=67) drove lower risk in 45% (n=30) of specimens. HIPPO-search-high-effect, on the other hand, identified regions that all drove higher risk and that more greatly contributed to high-risk predictions (t = 3.03, p < 0.01, independent t-test). High attention in high-risk breast cancer specimens (n=256) drove lower risk in 40% (n=102) specimens. Again, HIPPO-search-high-effect consistently identified regions that drove higher risk in the high-risk specimens (t = 8.83, p < 0.0001, independent t-test) (Fig. 4a). High attention regions in low-risk SKCM specimens (n=67) drove higher risk in 10% (n=7). HIPPO-search-low-effect identified regions that all drove lower risk and more strongly contributed to lower risk predictions (t = −2.30, p < 0.05, independent t-test). High attention regions in low-risk BRCA specimens (n=256) drove higher risk predictions in 8% (n=20) specimens. HIPPO-search-low-effect identified patches that consistently drove lower risk predictions (t = −5.43, p < 0.0001, independent t-test) (Fig. 4b). This counterintuitive effect underscores that attention scores may not directly relate to model predictions. Thus, interpretations that solely rely on these features may be misguided. HIPPO search algorithms reliably identified the regions that drove risk predictions and may have value as a tool for prognostic biomarker search.
Figure 4. HIPPO outperforms attention in identifying prognostic tissue regions.

We studied prognostic ABMIL models in invasive breast carcinoma (BRCA) and cutaneous melanoma (SKCM) from The Cancer Genome Atlas. a, b, Box plots of the prognostic effects of patches selected using attention and HIPPO in high-risk (a) and low-risk (b) specimens. The y-axis depicts the risk contribution, which is calculated as the original predicted risk minus the predicted risk when using a specimen with high-attention or high-HIPPO patches removed. Positive values indicate contribution to higher risk (a), and negative values indicate contribution to lower risk (b). The x-axis is the method of patch selection (either the top 1% of attended patches or the top 1% of patches found using HIPPO-search-high-effect). c, Box plots showing the predicted risk scores before and after adding tumor-infiltrating lymphocytes (TILs) to high-risk BRCA (left, n=256) and SKCM (right, n=67) specimens. Orange boxes show the original risk scores, and gray boxes show risk scores after adding TILs from low-risk specimens and averaging across low-risk specimens. Lower risk scores indicate improved prognosis. d, Box plots showing the predicted risk scores before and after removing TILs from low-risk BRCA (left, n=256) and SKCM (right, n=67) specimens. Box plots show the first and third quartiles, the median (central line) and the range of data with outliers removed (whiskers), and significance is shown (*: p < 0.05, **: p < 0.01, ***: p < 0.001). Sample sizes in high-risk (a, c) and low-risk (b, d) are n=256 for BRCA (left) and n=67 for SKCM (right).
TILs are a well-known prognostic biomarker. We evaluated the necessity and sufficiency of TILs for low-risk predictions in BRCA and SKCM. To test sufficiency, we extracted TIL-positive patches from low-risk specimens and placed them in high-risk specimens. For each high-risk slide, we embedded the TILs from each low-risk slide, and we averaged the model predictions across the low-risk slides to compute the average treatment effect of TILs for each high-risk slide. In high-risk BRCA specimens (n=253, three specimens failed cell detection), the addition of TILs from low-risk specimens decreased the risk by 46% (t = 17.95, p < 0.0001, paired t-test) from 0.37 (std. dev. 0.20) to 0.20 (std. dev. 0.15). In SKCM (n=67), the addition of TILs significantly decreased risk by 59% (t = −22.53, p < 0.0001, paired t-test) from 0.60 (std. dev. 0.14) to 0.25 (std. dev. 0.08) (Fig. 4c). To evaluate the necessity of TILs, we removed TIL-positive patches from low-risk specimens and measured the change in predictions. If TILs were necessary, then risk predictions would increase upon removal of TILs. In BRCA (n=254, two specimens failed cell detection), the removal of TILs significantly increased risk by 179% (t = 3.83, p < 0.001, paired t-test) from 0.002 (std. dev. 0.001) to 0.005 (std. dev. 0.014). In SKCM (n=67), the removal of TILs increased risk by 98% (t = 4.27, p < 0.0001, paired t-test) from 0.064 (std. dev. 0.045) to 0.126 (std. dev. 0.123) (Fig. 4d). The removal of TILs did increase risk predictions, but the risk predictions did not reach the level of high-risk slides, suggesting that other features in the WSIs were also driving the low-risk predictions. HIPPO facilitated a quantitative evaluation of the role of TILs on prognosis, providing insights beyond those achievable through the attention mechanism of ABMIL.
Generating hypotheses of which patients may benefit from autologous TIL therapy
Lifileucel is a promising immunotherapy for melanoma that involves isolating TILs from a patient’s tumor, replicating the TILs, and infusing them back into the patient1. In a phase II clinical trial, over 30% of patients responded to the therapy89. Identifying the patients that might respond to this therapy has the potential to improve patient outcomes and decrease costs (a single treatment may cost over $50000090). Therefore, we sought to explore whether we could emulate this with ABMIL and HIPPO. We conducted virtual experiments to measure the effect of autologous TILs on prognosis. We used the prognostic model for cutaneous melanoma described above, and we studied the high-risk specimens in TCGA-SKCM (n=67 WSIs, n=54 patients). Counterfactuals were designed to model the injection of autologous TILs. In each specimen, TIL-positive patches were replicated 2×, 10×, 20×, and 100× (Supplementary Fig. 11a). TIL-positive patches were defined using the same heuristic as above (see Methods). The change in model predictions between original specimens and autologous counterfactuals was recorded to measure the effect of additional TILs on prognosis. Cohen’s d was also calculated to quantify effect sizes. Importantly, we do not claim to demonstrate the efficacy of autologous TIL therapy through HIPPO and TCGA-SKCM. Rather, we aim to show a proof-of-principle that HIPPO may be used for hypothesis generation.
Autologous TILs significantly lowered predicted risk in a dose-dependent manner. Risk decreased by −2.18 % (d = −0.50) at 2× dose (t = −4.06, p < 0.001, paired t-test), −10.8 % (d = −0.56) at 10× dose (t = −4.59, p < 0.0001, paired t-test), −15.3 % (d = −0.62) at 20× dose (t = −5.06, p < 0.0001, paired t-test), and −20.8 % (d = −0.67) at 100× dose (t = −5.49, p < 0.0001, paired t-test) (Supplementary Fig. 11b). Increasing the number of TILs by 100× decreased predicted risk scores by over half in 18 % of high-risk specimens. Together, we demonstrated a proof-of-principle in which we use HIPPO to identify patients who may benefit from autologous TIL therapy through improved predicted prognosis following the replication of their TILs.
HIPPO addresses limitations of attention in explaining mutation detection
To evaluate HIPPO’s advantages over attention in diagnosing misclassifications, we applied it to IDH mutation classification, a prognostic marker in gliomas91. Using ABMIL models trained on the EBRAINS dataset92 (n=873), we classified wildtype (n=540) and mutant (n=333) IDH in H&E-stained specimens, employing 10-fold Monte Carlo cross-validation to assess variability. The classifiers demonstrated strong performance, with balanced accuracy of 0.89 ± 0.03 (mean ± std. dev.) (Fig. 5a), though the false negative (FN) rate ranged from 0.03 to 0.26 across folds. We used HIPPO and attention to identify and remove influential patches in FN specimens, aiming to increase the model’s IDH mutation probability.
Figure 5. HIPPO outperforms attention in identifying regions that cause misclassifications.

a, Box plot showing model performance for IDH mutation classification, with 10-fold Monte Carlo cross validation. Balanced accuracy (BA), F1-score (F1), and the receiver operating characteristic area under the curve (ROC AUC) are depicted. We sought to investigate the causes of false negative (FN) predictions (i.e., specimens which have an IDH mutation but were classified as wildtype) (n=38 specimens). We compared the ability of attention and HIPPO to identify the regions that drove FNs. We removed the top 20% of patches by attention and by HIPPO-search-high-effect. The HIPPO search found patches that increased probability of IDH mutation when removed. b, Box plot of model probabilities in FN specimens at baseline (original specimens), attention, and HIPPO. Removing the patches found by HIPPO rescued true positive predictions in many cases and led to significantly higher model probabilities than baseline (p < 0.0001, independent t-test) and attention (p < 0.0001, independent t-test). Removing the top 10% of patches by attention did not significantly change model predictions from baseline (p > 0.05, independent t-test). Classification threshold is shown at y = 0.5. c, Sample of regions that HIPPO identified as driving FN predictions. These regions were identified by HIPPO but were not identified by attention. FN specimen with (d) top 20% of patches by attention, (e) top 20% of patches by HIPPO, and (f) patches found by HIPPO but not found by attention. While the regions found by attention and HIPPO may appear similar, the differences are enough to mean the difference between false negative and true positive. Box plots show the first and third quartiles, the median (central line) and the range of data with outliers removed (whiskers), and significance is shown (****: p < 0.0001, n.s.: not significant).
When removing the top 20 % of patches identified by the strategy HIPPO-search-high-effect, predicted IDH mutation probabilities increased significantly from baseline (p < 0.0001, independent t-test, Cohen’s d = 2.18), resulting in a true positive classification for 76 % of cases. In comparison, removing the top 20 % of high-attention patches only converted FNs to true positives in 16 % of cases, with a nonsignificant effect on mutation probability (p > 0.05, independent t-test, Cohen’s d = 0.38) (Fig. 5b). These results suggest that HIPPO was more effective than attention at identifying critical regions causing FN predictions.
While there was a large degree of overlap between the patches identified by HIPPO and attention (median: 70 %, range: 28 % to 93 %), the patches exclusive to HIPPO were often key to resolving FN classifications. A representative sample of these patches is shown in Fig. 5c. Highlighting this, in specimen a1982c61–357f-11eb-b540–001a7dda7111, occluding high-HIPPO patches raised the IDH mutation probability from 0.24 to 0.93 (Fig. 5d), while occluding high-attention patches raised it only to 0.30 (Fig. 5e). Although HIPPO and attention overlapped by 89 %, the unique patches identified by HIPPO proved crucial in converting this FN prediction to a true positive prediction (Fig. 5e).
HIPPO also demonstrated clear advantages over attention in identifying regions that drive positive predictions. Using HIPPO-search-high-effect, we identified the patches most strongly contributing to positive predictions and compared these to patches prioritized by attention. HIPPO consistently identified more impactful patches, as shown by the steeper and more substantial decreases in model predictions when HIPPO-identified patches were removed compared to those identified by attention (Supplementary Figs. 12a and 12c).
Heatmaps generated from HIPPO outputs revealed a sharper delineation of critical regions than attention maps, which may enhance interpretability. Interestingly, HIPPO sometimes highlighted different regions than those with high attention scores, suggesting that diagnostically relevant areas may not always correspond to high-attention regions (Supplementary Figs. 12b and 12d). To further assess patch quality, we measured how many patches needed to be removed to lower a positive prediction below a probability threshold of 0.4. HIPPO required significantly fewer patches than attention (p < 0.001, independent t-test), indicating that it identified higher-quality, diagnostically relevant patches.
Discussion
In this study, we introduce HIPPO, an explainable AI method designed to enhance the interpretability and trustworthiness of ABMIL models in computational pathology. Our results demonstrate HIPPO’s ability to uncover hidden biases, quantify the impact of specific tissue regions on model predictions, and bridge the gap between computational outputs and clinically relevant insights. These findings may have significant implications for the development, regulation, and clinical application of AI in pathology.
One of the key strengths of HIPPO lies in its capacity to reveal model-specific limitations that are not apparent from performance metrics or attention mechanisms alone. In our evaluation of metastasis detection models, we uncovered surprising variations in how different foundation models process histological information. For instance, some models showed a strong reliance on peritumoral tissue, while others demonstrated unexpected insensitivity to small tumor regions. These findings underscore the importance of rigorous model evaluation beyond standard performance metrics and highlight potential pitfalls in clinical deployment.
The revelation that high-attention regions can sometimes have counterintuitive effects on prognostic predictions is particularly striking. This disconnect between attention and model output challenges the common practice of using attention maps as a primary means of model interpretation. Our results suggest that regulatory bodies and clinical teams should exercise caution when relying solely on attention-based explanations and should consider incorporating quantitative impact assessments, such as those provided by HIPPO, in their evaluation processes. For example, one may use HIPPO-knowledge to quantify the effect of high attention regions on model predictions.
HIPPO’s ability to verify that models have learned biologically relevant information, as demonstrated by our analysis of TILs in prognostic models, is crucial for building trust in AI-driven clinical tools. This alignment between model behavior and established biological knowledge provides a foundation for explaining model decisions to clinicians and patients, potentially facilitating the integration of AI tools into clinical workflows. It is also possible to use HIPPO’s de novo search to identify sets of patches from which expert pathologists could interpret manually to identify new tissue biomarkers.
The application of HIPPO to simulate the effects of autologous TIL therapy in melanoma patients showcases the potential for virtual experimentation in computational pathology. As foundation models and ABMIL methods improve, this approach could have far-reaching implications for personalized medicine, offering a computational method to predict treatment responses and guide therapy selection. However, it is important to note that these simulations are based on model predictions and would require extensive clinical validation before they can be considered for patient care.
Our findings suggest several key considerations for the future development and deployment of ABMIL models in clinical settings: (1) Model developers should incorporate robustness to tissue heterogeneity and small tumor regions as explicit design goals, potentially through targeted data augmentation using HIPPO-based counterfactuals; (2) Regulatory approval processes for AI tools in pathology may consider including comprehensive evaluations of model behavior across diverse tissue contexts, going beyond aggregate performance metrics; (3) The implementation of AI tools in clinical practice should be accompanied by clear explanations of model strengths and limitations, with HIPPO-like analyses providing quantitative assessments of model reliability for specific tissue types or patient subgroups; (4) Post-deployment monitoring of AI models should include ongoing analysis of model behavior in real-world settings, with HIPPO offering a means to detect potential shifts in model performance or the emergence of unexpected biases.
While our study demonstrates the potential of HIPPO, several limitations must be acknowledged. First, the counterfactual scenarios generated by HIPPO, while informative, may not always reflect biologically plausible tissue alterations. Future work should focus on refining these interventions to more closely mimic realistic tissue changes. Second, HIPPO operates at the resolution of patches, which represents a fundamental limit in its ability to capture finer-grained tissue-level details. Additionally, our analysis was limited to a specific set of foundation models and datasets. Broader evaluation across diverse pathology tasks and model architectures is needed to fully characterize the generalizability of our findings. In addition the interpretations offered by HIPPO are inherently bound by the underlying model’s capabilities and potential shortcomings in representing complex biological systems.
Looking ahead, this work opens several promising directions for future research. Integrating HIPPO with multimodal data, such as genomic and clinical information, could deepen its capacity to reveal insights into both model behavior and biological relevance. While HIPPO identifies important patches de novo, interpreting these patches often requires the expertise of trained pathologists to discern the shared features driving model predictions. Alternatively, observational statistics derived from the patches, such as nuclear pleomorphism from nuclear segmentation or tissue type classifications, could help identify key features within HIPPO-identified patches. Incorporating matched spatial transcriptomics data offers another compelling avenue93, potentially enabling biomarker discovery by linking sub-visual molecular features with morphological characteristics. Such integrations could help overcome the patch-level resolution limit of HIPPO, offering more granular insights into the interplay between molecular features and patient prognosis.
Another critical avenue involves leveraging HIPPO as a powerful auditing tool for ABMIL models. By systematically identifying model limitations, HIPPO can uncover hidden biases, weaknesses in feature representation, or instances where predictions rely on irrelevant or spurious features. This level of scrutiny can guide targeted refinements, such as fine-tuning models to correct specific deficiencies or retraining with more representative data. Moreover, HIPPO’s ability to highlight important patches provides a transparent framework for validating whether the model aligns with clinical expectations and pathology expertise. These improvements have the potential to not only enhance model robustness but also foster trust and reliability in clinical applications, paving the way for safer and more interpretable deployment in real-world settings.
In conclusion, HIPPO represents a major advance in the ability to interpret AI models in computational pathology. By providing a quantitative framework for assessing the impact of specific tissue regions on model predictions, HIPPO offers a powerful tool for uncovering model limitations, verifying biological relevance, and biomarker discovery for myriad clinical applications. As the field of computational pathology continues to evolve, quantitative methods like HIPPO will be crucial in ensuring that AI tools are deployed responsibly and effectively in healthcare settings.
Methods
HIPPO toolkit
HIPPO (Histopathology Interventions of Patches for Predictive Outcomes) is an explainable AI toolkit for attention-based multiple instance learning (ABMIL) models in computational pathology. It generates counterfactual examples by manipulating whole slide image patches to explain model behavior. In ABMIL, tissue from a whole slide image (WSI) is divided into small tiles, which are embedded using a pre-trained model. These patch embeddings serve as input to the ABMIL model, which learns to map sets of patch embeddings to specimen-level labels. HIPPO is made possible by two key features of ABMIL: (1) models are invariant to patch order, and (2) models accommodate variable number of patches. Taking advantages of these features of ABMIL, HIPPO creates counterfactual examples by adding or removing patches, allowing for evaluation of hypothetical scenarios and quantification of the effects of tissue region on model predictions.
When annotations are available, they can guide hypothesis-driven experiments. Patches corresponding to specific annotated regions can be removed or added to test their necessity or sufficiency for model predictions. For instance, in the present study, we utilized expert annotations of tumor regions to investigate the necessity and sufficiency of tumor presence in predicting metastasis. By removing tumor patches, we assessed their impact on model predictions to determine their criticality. Conversely, tumor patches were added to other specimens to evaluate their sufficiency in driving positive predictions. Automated methods may also be used to generate annotations. In the present report, for example, regions positive for tumor-infiltrating lymphocytes were defined using an off-the-shelf cell classification network, and these regions were used to test hypotheses in prognostic models.
In many cases, annotations are unavailable. In these cases, attention-based methods can be used to select patches for experimentation. Patches with the highest attention scores, such as the top 1 % of patches, can be removed to examine their influence on predictions. The same patches can also be added to other specimens to evaluate their sufficiency for inducing specific predictions. This approach compensates for a limitation of attention mechanisms, which lack explicit information about the direction of effect. By selectively removing high-attention patches, we quantify both the direction and magnitude of their influence on model outputs.
Additionally, the HIPPO search algorithm offers an alternative for identifying critical patches. This method directly evaluates the effect of each patch on the model’s predictions, accommodating potential nonlinear interactions among patches. The algorithm operates as follows:
Begin with the full set of patches for a whole slide image (WSI) and record the initial model prediction.
Iteratively drop one patch at a time, measure the change in the model’s prediction, and replace the patch.
Identify and permanently remove the patch that results in the lowest prediction (to identify necessary patches) or the smallest change (to identify sufficient patches).
Repeat the process until all patches are exhausted or a stopping criterion is met.
The HIPPO search algorithm provides a systematic framework for identifying patches that are most critical to model predictions. This can be particularly useful when hypothesis-driven experiments reveal discrepancies between expected and actual model behavior, or when the important tissue features are not known beforehand. By identifying the regions the model prioritizes, this approach enables comparisons with domain knowledge, helps uncover unexpected decision-making patterns, and may aid in biomarker discovery. A limitation of the HIPPO search strategy is potentially long runtime, depending on the number of patches in a specimen. To address this, a batched approach can be used, wherein multiple patches are removed at each iteration. By adjusting the batch size, a trade-off can be achieved between computational efficiency and the granularity of the results.
Deep neural network development
We used attention-based multiple instance learning (ABMIL) to learn specimen-level labels from wholes slide images. For metastasis detection, we evaluated five different patch encoders: UNI20, REMEDIS16, CTransPath17, Phikon18, and RetCCL19. These encoders were used to embed non-overlapping 128 × 128 μm patches, with all encoders utilizing identical patches. We standardized hyperparameters across all ABMIL models, adapting from Chen et al.20. The architecture comprised a first hidden layer of 512 units and a second of 384 units, incorporating gated attention. During training, we applied a dropout rate of 0.25. The output layer performed binary classification, distinguishing between the presence and absence of metastasis. Models were trained using cross-entropy loss and the Adam optimizer with a learning rate of 1 × 10⁻⁴, following a cosine learning rate scheduler. We used a batch size of 1 without gradient accumulation. Training continued for a maximum of 20 epochs, with the best model selected based on the highest ROC AUC on the validation set. To assess initialization variability, we trained five separate models with different random seeds for each patch encoder. For subsequent experiments, we selected the initialization yielding the highest balanced accuracy on the CAMELYON16 test set for each encoder. We visualized attention heatmaps using QuPath94. All models were implemented in PyTorch and trained on NVIDIA RTX 2080 Ti GPUs.
The setup for IDH mutation classification was similar to that of metastasis classification. However, CONCH21 embeddings were used, and 10-fold Monte Carlo cross validation was employed to assess variability across models. All models were implemented in PyTorch and trained on NVIDIA RTX 2080 Ti GPUs.
For prognostic models, we used the ABMIL models defined in50. The model was composed of a linear layer with 512 units, dropout with a rate of 0.25, and a second linear layer of 256 units. Gated attention was used. The model had four outputs, representing hazards at four points in time. Risk scores were calculated as in ref.50 and were in range [0, 1], where 0 indicates lowest probability of survival. Models were all implemented in PyTorch, and training was performed on NVIDIA RTX 2080 Ti GPUs.
Datasets
Breast cancer metastasis dataset
We used the CAMELYON16 dataset30 to study breast cancer metastasis. This dataset consists of 399 images and has fine-grained tumor annotations made by expert pathologists. The training set was split into 90% training and 10% validation, stratified by the label of the specimen (i.e., normal or tumor). Training set consisted of 143 negative and 100 positive WSIs (52 macrometastases and 48 micrometastases). The validation set consisted of 16 negative and 11 positive WSIS (6 macrometastases and 5 micrometastases). We used the pre-defined test set, which consisted of 80 negative and 49 positive WSIs (22 macrometastases and 27 micrometastases). In the entire dataset, there were 160 metastasis-positive specimens. There was an average tumor area of 12.26 mm2 (std. dev. 34.04 mm2; minimum 0.008 mm2; and maximum 276.09 mm2). All 399 slides had pixel spacings between 0.226 and (MPP). The WSIs had 10, 250 ± 6, 672 patches (mean ± standard deviation), where each patch was 128 × 128 μm.
Prognostic datasets
Prognostic models were trained and evaluated using the invasive breast carcinoma (BRCA) and cutaneous melanoma (SKCM) studies from The Cancer Genome Atlas. In TCGA BRCA, 1,022 WSIs from 956 patients were used (130 death events), and in TCGA SKCM, 268 slides from 230 patients were used (89 death events). Overall survival time and censoring was used and retrieved from the code repository2 of ref.50. The training and validation splits for cross validation were accessed from the same code repository. The WSIs in TCGA BRCA had 11, 260 ± 6, 544 patches (mean ± standard deviation). The WSIs in TCGA SKCM had 14, 153 ± 7, 471 patches.
IDH mutation dataset
The EBRAINS dataset92, comprising 795 patients and 873 specimens with known IDH mutation status, was used to develop IDH mutation classification models. The dataset included 540 IDH wildtype and 333 IDH mutant specimens, spanning 508 glioblastomas, 189 astrocytomas, and 176 oligodendrogliomas. All WSIs were in NDPI format with physical spacing of 0.227 μm. Specimens were partitioned for 10-fold Monte Carlo cross-validation using the CLAM toolkit62. The WSIs had 9, 100 ± 6, 878 patches (mean ± standard deviation), where each patch was 128 × 128 μm.
Whole slide image processing
Whole slide images were read using OpenSlide95, and a modified version of the CLAM toolkit62 was used to segment tissue and calculate patch coordinates. Regions of tissue are identified to not spend computational resources on glass regions of the WSI. The image is converted to HSV color model (hue, saturation, value/brightness). The saturation channel is smoothed and thresholded to create a binary tissue image. Non-overlapping patches coordinates of 128 × 128 μm were calculated within the tissue regions. The CLAM toolkit62 was modified to create patches at uniform physical sizes. The size of a patch in pixels can vary based on the spacing (μm/px, MPP), and the patch size in base pixels is calculated using,
| (1) |
The 128 × 128 μm patches from CAMELYON16 were then embedded using five pre-trained models (embedding dimensions in parentheses): UNI (1024)20, REMEDIS (4096)16, Phikon (768)18, CTransPath (768)17, and RetCCL (2048)19. The TCGA-BRCA and TCGA-SKCM specimens for prognostic models were embedded using the UNI model, and the glioma specimens from EBRAINS were embedded using the CONCH model. When embedding a slide, patches were read directly from the WSI file. A batch of 64 patches was read from the WSI, and then that batch was processed by the model to compute embeddings. The embeddings of all patches in a WSI were concatenated into one array and saved to disk for reuse. These embeddings served as inputs to all ABMIL models in the present report.
HIPPO experiment details
Testing the necessity of tumor regions
The degree to which tumor regions influence ABMIL models for metastasis detection remains unclear. To test the necessity of tumor regions, all of the tumor in the 49 tumor-positive specimens was removed, and change in model outputs was recorded. The embeddings of all patches intersecting with expert tumor annotations were removed. See Supplementary Fig. 13 for the histogram of the number of patches removed from each WSI. Once all of the tumor patches were removed from the bag of embeddings, the specimen was called “negative” for metastasis. The modified bags of embeddings were run through the model, and outputs were recorded. The true negative rate (specificity) was calculated as the ratio of true negative detections to all negative samples. In this case, as all samples were negative, the true negative rate was the proportion of specimens called negative by the model. This was done for all patch embedding tested in the present report.
Testing the sufficiency of tumor regions
The sufficiency of tumor regions for metastasis detection remains unclear. We evaluated this in two ways: by evaluating the use of only tumor tissue from positive specimens (n=49), and by embedding metastatic patches from positive specimens (n=49) into negative specimens (n=80). In the first method, we removed all patches that did not intersect with the expert tumor annotations. This evaluated the hypothetical scenario that the specimen contained tumor and no other type of tissue. The labels of all specimens remained “positive”, and model outputs were recorded. Sensitivity was measured as the proportion of positive model predictions.
In the second method, we created counterfactual examples of metastasis-positive specimens (n=3920) from normal specimens (n=80). All combinations were evaluated: the patches that intersected expert tumor annotations from each positive slide were added to each negative slide, making a total of 3920 counterfactual examples (80 negative × 49 positive specimens). Each of these counterfactual examples was labeled “positive” because they contained tumor. These counterfactual examples were then run through the ABMIL models, and outputs were recorded. Sensitivity was measured as the proportion of positive model outputs.
Testing the effect of tumor size
The extent to which tumor size affects specimen-level metastasis detection is incompletely understood. Conventionally, this analysis is limited to existing specimens. We explore a more rich set of tumor sizes using counterfactual examples. First, we evaluated the effect of a single 128 × 128 μm tumor region in normal and metastatic specimens. The tumor region was taken from specimen test_001 at the coordinates (37878, 63530, 38444, 64096), indicating minimum X, minimum Y, maximum X, and maximum Y. For normal specimens, we added the embedding of this one patch into each of the 80 normal specimens and fed these bags of embeddings to the ABMIL model. Sensitivity was measured as the proportion of positive model predictions. We also evaluated this in the context of positive specimens. First, all tumor patches intersecting with expert tumor annotations were removed, and the single patch embedding was added to the bags of embeddings. 48 positive samples were used – the specimen that the patch came from was not included. Sensitivity was measured as the proportion of positive predictions.
In addition, the effect of each individual tumor patch was evaluated for metastasis detection. In the positive slides (n=49), all tumor patches intersecting expert tumor annotations were removed to render the slide negative for metastasis. Then, each tumor patch that was fully contained by the tumor annotations was added to the bag of embeddings one at a time, and model outputs were recorded. Model probabilities for tumor were recorded.
Last, the size of tumor was evaluated by sampling increasing numbers of tumor patches. First, all tumor patches intersecting with expert tumor annotations were removed. Then, tumor patches fully contained by the annotations were randomly sampled and added back to the bag of embeddings. This was evaluated over multiple numbers of sampled patches (i.e., 1, 2, 4, 8, 16, 32, 64). Sensitivity was evaluated as the proportion of positive predictions.
Identifying the largest unseen tumor
Motivated by the graded effect of tumor size on metastasis detection performance, we sought to identify the largest area of tumor that would still result in a negative prediction by the ABMIL models. To accomplish this, we used a HIPPO search algorithm. First, all patches that intersected the expert tumor annotation were removed, to render the specimen “negative” for metastasis. Then, tumor patches were added to the specimen one at a time, and model outputs were assessed. The tumor patch that resulted in the lowest model probability of tumor was kept in the bag, and the next round of the search was initiated. This was repeated until the model probability of tumor was greater than 0.5, which would trigger a positive prediction. The set of tumor patches that were in the bag prior to reaching a threshold of 0.5 were considered the largest area of tumor that could be present while maintaining a negative predictions.
Testing the effect of adipose tissue on metastasis detection
Upon inspection of attention maps for the CTransPath-based metastasis detection model, adipose regions had high attention in a false negative, leading us to hypothesize that adipose regions were driving the false negative in that specimen. Attention alone could not allow us to address this hypothesis, but HIPPO could. The adipose regions were annotated in QuPath. Patches that intersected with the adipose region were removed, while ensuring that no tumor patches were removed. To measure the effect of this adipose tissue in other specimens, patches intersecting with the adipose annotation were added to the other 48 metastasis-positive slides, and the number of changes from true positive to false negative were recorded.
Diagnosing shortcut learning
We sought to evaluate how HIPPO can uncover shortcut learning and how it compares to attention in this regard. To do this, we modified the normal specimens in the CAMELYON16 dataset to include a blue square (hexadecimal color code #284283). This is meant to mimic a plausible real world scenario in which a pathologist marked certain slides with a blue pen. In practice, we embedded one blue square of 128 × 128 μm using the UNI model20 and replicated that embedding 36 times to create a 768 × 768 μm blue region. The embeddings of this blue region were concatenated with the patch embeddings of normal specimens. The specimens with metastasis were not modified. We reasoned that the ABMIL model would learn to distinguish normal from metastatic specimens by the presence of a blue region. To assess whether tumor regions were affecting model predictions in positive specimens, we removed all patches intersecting with tumor annotations in positive specimens and recorded model outputs. To visualize attention maps, we saved patch-wise attention weights in GeoJSON format and visualized the maps in QuPath94. We also used the search strategy HIPPO-search-high-effect to identify the regions with highest effect sizes de novo. We also did this using a UNI-based ABMIL model trained on the original, unaltered CAMELYON16 dataset, trained using the same hyperparameters and random seed.
Identifying prognostic regions and comparing with attention
We sought to compare the effectiveness of attention and HIPPO for identifying tissue regions related to predicted prognosis. TCGA BRCA and SKCM data were used in these experiments. For attention, regions assigned the top 1% of attention scores were selected. For HIPPO, the search strategy HIPPO-search-high-effect was used to identify the regions most contributing to high risk in high-risk specimens, and the search strategy HIPPO-search-low-effect was used to identify the regions most contributing to low risk in low-risk specimens. Low and high risk were defined as the first and fourth quartiles of predicted risk scores, respectively. The first 1% of patches identified by the HIPPO search algorithms were selected for evaluation. To quantify the effect of the selected regions on predicted prognosis, we calculated the difference between the predicted prognosis on the original specimens and the predicted prognosis on the specimens with the selected regions removed.
| (2) |
Positive values indicated that the regions contributed to higher risk, and negative values indicated that the regions contributed to lower risk. Independent t-tests were used to assess significance of differences between attention and HIPPO.
Effect of TILs on prognostic models
In prognostic models, we measured the effects of tumor-infiltrating lymphocytes (TILs) on model behavior. The number of TILs was quantified using the same approach as Ref.50. Briefly, HoVer-Net96 was used to outline and label the nuclei in TCGA BRCA and SKCM WSIs. The model labels nuclei as one of six categories: tumor epithelium, lymphocyte, stroma, necrosis, normal epithelium, and unknown. Each 128 × 128 μm was called TIL-positive if it contained more than 20 cells, more than 10 immune cells, and more than 5 tumor cells. In TCGA BRCA, HoVer-Net failed for 12 WSIs, some of which were missing pixel spacing information.
We measured the effect of TIL patches on predicted prognosis in TCGA BRCA AND SKCM by either removing TILs from low-risk specimens or adding TILs to high-risk specimens, where low-risk was defined as samples in the first quartile of predicted risk and high-risk were samples in the fourth quartile of predicted risk. The predicted prognoses were compared before and after the intervention. To evaluate the sufficiency of TILs for predicting low risk, we added TIL patches from low-risk specimens to high-risk specimens. Risk predictions of the model were recorded, and differences were tested using paired t-tests. To assess the necessity of TIL regions, we removed TIL-positive patches from low risk specimens and measured risk predictions. Differences were tested using paired t-tests.
Evaluating autologous TILs
Autologous TIL therapy is a promising immunotherapy. We explored how HIPPO could be used for hypothesis generation in the context of autologous TILs in high-risk SKCM specimens (n=67). We sought to assess the degree to which prognostic ABMIL models are effected by the number of TILs in a specimen. We do not claim to assess the efficacy of autologous TILs through HIPPO. The embeddings of TIL-positive regions were replicated 2×, 10×, 20×, or 100×, and the change in predicted risk was measured:
| (3) |
Negative values indicated that the addition of TILs decreased risk. The change in risk from baseline was assessed using paired t-tests.
Explaining misclassifications in IDH mutation classification
We analyzed histopathology specimens with known IDH mutations but misclassified as negative by the models (i.e., false negative, FN). The objective was to evaluate whether removing the top 20 % of patches, identified by attention or HIPPO search, could increase the likelihood of a correct classification. To reduce running time of experiments, we analyzed FN specimens with fewer than 20000 patches (n=38). For each specimen, the softmax probability for IDH mutation was recorded. Next, the 20 % of patches with the highest attention scores were removed, and the updated model probability was documented. In addition, the top 20 % of patches identified by HIPPO-search-high-effect were removed, and the updated model probability was recorded (search algorithm described below). The final IDH mutation probabilities after the different methods of patch removal were compared across baseline, attention, and HIPPO conditions. Cohen’s d was used to assess effect sizes, and independent t-tests evaluated statistical significance between conditions. The experiment was conducted exclusively on specimens from the test set of each fold during the 10-fold Monte Carlo cross-validation, ensuring that no specimens from the training or validation sets were included.
The HIPPO-search-high-effect algorithm iteratively removed individual patches, replacing each patch after recording its impact on mutation probability. The patch whose removal most increased the probability of IDH mutation was permanently excluded, with this process repeated until 20 % of patches were removed. The search was performed using NVIDIA A100 GPUs.
Identifying regions driving positive IDH mutation prediction
We evaluated the extent to which attention and HIPPO search identified patches driving positive predictions, focusing on specimens with positive predictions in the first Monte Carlo cross-validation fold (n=25). The HIPPO-search-high-effect algorithm was applied, removing patches in batches of 10 per iteration to accelerate runtime. Patches were ranked by their impact on IDH mutation probabilities, with the 10 patches whose removal most reduced the prediction probability excluded at each step. The IDH mutation probability was recorded after each batch, continuing until 90 % of patches were removed. A similar approach was used for attention, removing patches in descending order of attention scores in batches of 10 and recording model outputs after each removal. Model outputs for each specimen were visualized as line plots, comparing results from HIPPO and attention. Heatmaps of attention and HIPPO outputs were viewed using QuPath for qualitative assessment.
To assess the efficiency of HIPPO in identifying critical patches, we conducted an experiment to determine how many patches needed to be removed to reduce the model probability below 0.4, hypothesizing that HIPPO would require fewer patches than attention due to its ability to better capture the most important regions driving predictions. The HIPPO and attention outputs from above were used in this experiment. The ratio of patches required (i.e., number of patches required normalized by number of patches in specimen) were compared between attention and HIPPO using independent t-test and visualized using a scatter plot.
Supplementary Material
Acknowledgements
This research was supported by National Science Foundation (NSF) grant IIS2212046, National Institutes of Health (NIH) grant UH3CA225012, and Stony Brook Profund 2022 seed funding. JRK was also supported by the Medical Scientist Training Program at Stony Brook University and NIH grant T32GM008444 (NIGMS). We would also like to acknowledge the Department of Biomedical Informatics at Stony Brook University and the Simons Center for Quantitative Biology at Cold Spring Harbor Laboratory.
Footnotes
Competing interests
The authors declare the following competing interests: J.H.S. is co-founder and chief executive officer of Chilean Wool, LLC. All other authors declare no competing interests.
Code availability
A Python package implementing HIPPO is available at https://github.com/kaczmarj/HIPPO and is licensed under the terms of the 3-Clause BSD License. HIPPO documentation is published at https://github.com/kaczmarj/HIPPO under the terms of the Creative Commons Attribution-NonCommercial-ShareAlike 4.0 International copyright license (CC BY-NC-SA 4.0). Model weights and inference code are available at the following repositories: UNI (https://huggingface.co/MahmoodLab/UNI), REMEDIS (https://github.com/google-research/medical-ai-research-foundations), Phikon (https://huggingface.co/owkin/phikon), CTransPath (github.com/Xiyue-Wang/TransPath), and RetCCL (https://github.com/Xiyue-Wang/RetCCL). Model weights for the models trained for this report will be deposited to online repositories.
Data availability
The CAMELYON16 dataset is available at https://camelyon17.grand-challenge.org/Data/ under the CC0 license (public domain). The results shown here are in whole or part based upon data generated by the TCGA Research Network: https://www.cancer.gov/tcga. Clinical data and whole slide image files can be accessed at https://portal.gdc.cancer.gov. Training and validation splits for prognostic models were accessed at https://github.com/mahmoodlab/PORPOISE.
References
- 1.Van der Laak J., Litjens G. & Ciompi F. Deep learning in histopathology: the path to the clinic. Nat. medicine 27, 775–784 (2021). [DOI] [PubMed] [Google Scholar]
- 2.Echle A. et al. Deep learning in cancer pathology: a new generation of clinical biomarkers. Br. journal cancer 124, 686–696 (2021). [DOI] [PMC free article] [PubMed] [Google Scholar]
- 3.Topol E. J. High-performance medicine: the convergence of human and artificial intelligence. Nat. medicine 25, 44–56 (2019). [DOI] [PubMed] [Google Scholar]
- 4.Song A. H. et al. Artificial intelligence for digital and computational pathology. Nat. Rev. Bioeng. 1, 930–949 (2023). [Google Scholar]
- 5.Niazi M. K. K., Parwani A. V. & Gurcan M. N. Digital pathology and artificial intelligence. The lancet oncology 20, e253–e261 (2019). [DOI] [PMC free article] [PubMed] [Google Scholar]
- 6.Rakha E. A. et al. Current and future applications of artificial intelligence in pathology: a clinical perspective. J. clinical pathology 74, 409–414 (2021). [DOI] [PubMed] [Google Scholar]
- 7.Cui M. & Zhang D. Y. Artificial intelligence and computational pathology. Lab. Investig. 101, 412–422 (2021). [DOI] [PMC free article] [PubMed] [Google Scholar]
- 8.Morales S., Engan K. & Naranjo V. Artificial intelligence in computational pathology–challenges and future directions. Digit. Signal Process. 119, 103196 (2021). [Google Scholar]
- 9.Tizhoosh H. R. & Pantanowitz L. Artificial intelligence and digital pathology: challenges and opportunities. J. pathology informatics 9, 38 (2018). [DOI] [PMC free article] [PubMed] [Google Scholar]
- 10.Tran K. A. et al. Deep learning in cancer diagnosis, prognosis and treatment selection. Genome Medicine 13, 1–17 (2021). [DOI] [PMC free article] [PubMed] [Google Scholar]
- 11.Cifci D., Veldhuizen G. P., Foersch S. & Kather J. N. Ai in computational pathology of cancer: improving diagnostic workflows and clinical outcomes? Annu. Rev. Cancer Biol. 7, 57–71 (2023). [Google Scholar]
- 12.Shmatko A., Ghaffari Laleh N., Gerstung M. & Kather J. N. Artificial intelligence in histopathology: enhancing cancer research and clinical oncology. Nat. cancer 3, 1026–1038 (2022). [DOI] [PubMed] [Google Scholar]
- 13.Perez-Lopez R., Ghaffari Laleh N., Mahmood F. & Kather J. N. A guide to artificial intelligence for cancer researchers. Nat. Rev. Cancer 1–15 (2024). [DOI] [PubMed]
- 14.Unger M. & Kather J. N. A systematic analysis of deep learning in genomics and histopathology for precision oncology. BMC Med. Genomics 17, 48 (2024). [DOI] [PMC free article] [PubMed] [Google Scholar]
- 15.Bera K., Schalper K. A., Rimm D. L., Velcheti V. & Madabhushi A. Artificial intelligence in digital pathology—new tools for diagnosis and precision oncology. Nat. reviews Clin. oncology 16, 703–715 (2019). [DOI] [PMC free article] [PubMed] [Google Scholar]
- 16.Azizi S. et al. Robust and efficient medical imaging with self-supervision. arXiv preprint arXiv:2205.09723 (2022).
- 17.Wang X. et al. Transformer-based unsupervised contrastive learning for histopathological image classification. Med. Image Analysis 81, 102559, DOI: 10.1016/j.media.2022.102559 (2022). [DOI] [PubMed] [Google Scholar]
- 18.Filiot A. et al. Scaling self-supervised learning for histopathology with masked image modeling. medRxiv DOI: 10.1101/2023.07.21.23292757 (2023). [DOI]
- 19.Wang X. et al. Retccl: Clustering-guided contrastive learning for whole-slide image retrieval. Med. Image Analysis 83, 102645, DOI: 10.1016/j.media.2022.102645 (2023). [DOI] [PubMed] [Google Scholar]
- 20.Chen R. J. et al. Towards a general-purpose foundation model for computational pathology. Nat. Medicine 30, 850–862, DOI: 10.1038/s41591-024-02857-3 (2024). [DOI] [PMC free article] [PubMed] [Google Scholar]
- 21.Lu M. Y. et al. A visual-language foundation model for computational pathology. Nat. Medicine 30, 863–874 (2024). [DOI] [PMC free article] [PubMed] [Google Scholar]
- 22.Wang X. et al. A pathology foundation model for cancer diagnosis and prognosis prediction. Nature 1–9 (2024). [DOI] [PubMed]
- 23.Vorontsov E. et al. A foundation model for clinical-grade computational pathology and rare cancers detection. Nat. medicine 1–12 (2024). [DOI] [PMC free article] [PubMed]
- 24.Zimmermann E. et al. Virchow2: Scaling self-supervised mixed magnification models in pathology. arXiv preprint arXiv:2408.00738 (2024).
- 25.Filiot A., Jacob P., Mac Kain A. & Saillard C. Phikon-v2, a large and public feature extractor for biomarker prediction. arXiv preprint arXiv:2409.09173 (2024).
- 26.Nechaev D., Pchelnikov A. & Ivanova E. Hibou: A family of foundational vision transformers for pathology. arXiv preprint arXiv:2406.05074 (2024).
- 27.Aben N. et al. Towards large-scale training of pathology foundation models. arXiv preprint arXiv:2404.15217 (2024).
- 28.Ilse M., Tomczak J. & Welling M. Attention-based deep multiple instance learning. In International conference on machine learning, 2127–2136 (PMLR, 2018). [Google Scholar]
- 29.Gadermayr M. & Tschuchnig M. Multiple instance learning for digital pathology: A review of the state-of-the-art, limitations & future potential. Comput. Med. Imaging Graph. 102337 (2024). [DOI] [PubMed]
- 30.Ehteshami Bejnordi B. et al. Diagnostic Assessment of Deep Learning Algorithms for Detection of Lymph Node Metastases in Women With Breast Cancer. JAMA 318, 2199–2210, DOI: 10.1001/jama.2017.14585 (2017). [DOI] [PMC free article] [PubMed] [Google Scholar]
- 31.Bulten W. et al. Artificial intelligence for diagnosis and gleason grading of prostate cancer: the panda challenge. Nat. medicine 28, 154–163 (2022). [DOI] [PMC free article] [PubMed] [Google Scholar]
- 32.Qiu S., Guo Y., Zhu C., Zhou W. & Chen H. Attention based multi-instance thyroid cytopathological diagnosis with multi-scale feature fusion. In 2020 25th International Conference on Pattern Recognition (ICPR), 3536–3541 (IEEE, 2021). [Google Scholar]
- 33.Butke J. et al. End-to-end multiple instance learning for whole-slide cytopathology of urothelial carcinoma. In MICCAI Workshop on Computational Pathology, 57–68 (PMLR, 2021). [Google Scholar]
- 34.Del Amor R. et al. Constrained multiple instance learning for ulcerative colitis prediction using histological images. Comput. methods programs biomedicine 224, 107012 (2022). [DOI] [PubMed] [Google Scholar]
- 35.Del Amor R. et al. An attention-based weakly supervised framework for spitzoid melanocytic lesion diagnosis in whole slide images. Artif. intelligence medicine 121, 102197 (2021). [DOI] [PubMed] [Google Scholar]
- 36.Lu M. Y. et al. Ai-based pathology predicts origins for cancers of unknown primary. Nature 594, 106–110 (2021). [DOI] [PubMed] [Google Scholar]
- 37.Su Z. et al. Attention2majority: Weak multiple instance learning for regenerative kidney grading on whole slide images.Med. Image Analysis 79, 102462, DOI: 10.1016/j.media.2022.102462 (2022). [DOI] [PMC free article] [PubMed] [Google Scholar]
- 38.Li J. et al. A multi-resolution model for histopathology image classification and localization with multiple instance learning. Comput. Biol. Medicine 131, 104253, DOI: 10.1016/j.compbiomed.2021.104253 (2021). [DOI] [PMC free article] [PubMed] [Google Scholar]
- 39.Saldanha O. L. et al. Self-supervised attention-based deep learning for pan-cancer mutation prediction from histopathology. NPJ Precis. Oncol. 7, 35 (2023). [DOI] [PMC free article] [PubMed] [Google Scholar]
- 40.Dernbach G. et al. Dissecting ai-based mutation prediction in lung adenocarcinoma: a comprehensive real-world study. Eur. J. Cancer 114292 (2024). [DOI] [PubMed]
- 41.Zheng Q. et al. Predicting tumor mutation burden and vhl mutation from renal cancer pathology slides with self-supervised deep learning. Cancer Medicine 13, e70112 (2024). [DOI] [PMC free article] [PubMed] [Google Scholar]
- 42.Schirris Y., Gavves E., Nederlof I., Horlings H. M. & Teuwen J. Deepsmile: Contrastive self-supervised pre-training benefits msi and hrd classification directly from h&e whole-slide images in colorectal and breast cancer. Med. Image Analysis 79, 102464, DOI: 10.1016/j.media.2022.102464 (2022). [DOI] [PubMed] [Google Scholar]
- 43.Valieris R. et al. Weakly-supervised deep learning models enable her2-low prediction from h &e stained slides. Breast Cancer Res. 26, 124 (2024). [DOI] [PMC free article] [PubMed] [Google Scholar]
- 44.Boehm K. M. et al. Multimodal histopathologic models stratify hormone receptor-positive early breast cancer. bioRxiv DOI: 10.1101/2024.02.23.581806 (2024). https://www.biorxiv.org/content/early/2024/02/28/2024.02.23.581806.full.pdf. [DOI]
- 45.El Nahhas O. S. et al. Regression-based deep-learning predicts molecular biomarkers from pathology slides. nature communications 15, 1253 (2024). [DOI] [PMC free article] [PubMed] [Google Scholar]
- 46.Lipkova J. et al. Deep learning-enabled assessment of cardiac allograft rejection from endomyocardial biopsies. Nat. medicine 28, 575–582 (2022). [DOI] [PMC free article] [PubMed] [Google Scholar]
- 47.Jiang Y. et al. Biology-guided deep learning predicts prognosis and cancer immunotherapy response. Nat. Commun. 14, 5135 (2023). [DOI] [PMC free article] [PubMed] [Google Scholar]
- 48.Mallya M., Mirabadi A. K., Farahani H. & Bashashati A. Benchmarking histopathology foundation models for ovarian cancer bevacizumab treatment response prediction from whole slide images. arXiv preprint arXiv:2407.20596 (2024).
- 49.Chen R. J. et al. Multimodal co-attention transformer for survival prediction in gigapixel whole slide images. In Proceedings of the IEEE/CVF international conference on computer vision, 4015–4025 (2021). [Google Scholar]
- 50.Chen R. J. et al. Pan-cancer integrative histology-genomic analysis via multimodal deep learning. Cancer Cell 40, 865–878, DOI: 10.1016/j.ccell.2022.07.004 (2022). [DOI] [PMC free article] [PubMed] [Google Scholar]
- 51.Ammeling J. et al. Attention-based multiple instance learning for survival prediction on lung cancer tissue microarrays. In BVM Workshop, 220–225 (Springer, 2023). [Google Scholar]
- 52.Plass M. et al. Explainability and causability in digital pathology. The J. Pathol. Clin. Res. 9, 251–260, DOI: 10.1002/cjp2.322 (2023). [DOI] [PMC free article] [PubMed] [Google Scholar]
- 53.Castro D. C., Walker I. & Glocker B. Causality matters in medical imaging. Nat. Commun. 11, 3673 (2020). [DOI] [PMC free article] [PubMed] [Google Scholar]
- 54.Foote A. et al. Now you see it, now you dont: adversarial vulnerabilities in computational pathology. arXiv preprint arXiv:2106.08153 (2021).
- 55.Ghaffari Laleh N. et al. Adversarial attacks and adversarial robustness in computational pathology. Nat. communications 13, 5711 (2022). [DOI] [PMC free article] [PubMed] [Google Scholar]
- 56.Dawood M., Branson K., Tejpar S., Rajpoot N. & Minhas F. Buyer beware: confounding factors and biases abound when predicting omics-based biomarkers from histological images. bioRxiv 2024–06 (2024).
- 57.Ribeiro M. T., Singh S. & Guestrin C. “why should i trust you?” explaining the predictions of any classifier. In Proceedings of the 22nd ACM SIGKDD international conference on knowledge discovery and data mining, 1135–1144 (2016). [Google Scholar]
- 58.Lundberg S. M. & Lee S.-I. A unified approach to interpreting model predictions. In Proceedings of the 31st International Conference on Neural Information Processing Systems, NIPS’17, 4768–4777 (Curran Associates Inc., Red Hook, NY, USA, 2017). [Google Scholar]
- 59.Selvaraju R. R. et al. Grad-cam: Visual explanations from deep networks via gradient-based localization. In Proceedings of the IEEE international conference on computer vision, 618–626 (2017). [Google Scholar]
- 60.Lipton Z. C. The mythos of model interpretability: In machine learning, the concept of interpretability is both important and slippery. Queue 16, 31–57 (2018). [Google Scholar]
- 61.Bilodeau B., Jaques N., Koh P. W. & Kim B. Impossibility theorems for feature attribution. Proc. Natl. Acad. Sci. 121, e2304406120 (2024). [DOI] [PMC free article] [PubMed] [Google Scholar]
- 62.Lu M. Y. et al. Data-efficient and weakly supervised computational pathology on whole-slide images. Nat. biomedical engineering 5, 555–570 (2021). [DOI] [PMC free article] [PubMed] [Google Scholar]
- 63.Xiong C., Chen H., Sung J. J. & King I. Diagnose like a pathologist: transformer-enabled hierarchical attention-guided multiple instance learning for whole slide image classification. In Proceedings of the Thirty-Second International Joint Conference on Artificial Intelligence, 1587–1595 (2023). [Google Scholar]
- 64.Niehues J. M. et al. Generalizable biomarker prediction from cancer pathology slides with self-supervised deep learning: A retrospective multi-centric study. Cell reports Medicine 4 (2023). [DOI] [PMC free article] [PubMed] [Google Scholar]
- 65.Graziani M. et al. Attention-based interpretable regression of gene expression in histology. In International Workshop on Interpretability of Machine Intelligence in Medical Image Computing, 44–60 (Springer, 2022). [Google Scholar]
- 66.Cai C. et al. Pathologist-level diagnosis of ulcerative colitis inflammatory activity level using an automated histological grading method. Int. J. Med. Informatics 192, 105648 (2024). [DOI] [PubMed] [Google Scholar]
- 67.Yao J., Wei L., Hao P., Liu Z. & Wang P. Application of artificial intelligence model in pathological staging and prognosis of clear cell renal cell carcinoma. Discov. Oncol. 15, 545 (2024). [DOI] [PMC free article] [PubMed] [Google Scholar]
- 68.Zhang Y. et al. Attention-challenging multiple instance learning for whole slide image classification. arXiv preprint arXiv:2311.07125 (2023).
- 69.Sehring J. et al. al. Leveraging attention-based convolutional neural networks for meningioma classification in computational histopathology. Cancers 15, 5190 (2023). [DOI] [PMC free article] [PubMed] [Google Scholar]
- 70.Javed S. A. et al. Additive mil: Intrinsically interpretable multiple instance learning for pathology. Adv. Neural Inf. Process. Syst. 35, 20689–20702 (2022). [Google Scholar]
- 71.Nan T. et al. Establishing truly causal relationship between whole slide image predictions and diagnostic evidence subregions in deep learning. arXiv preprint arXiv:2407.17157 (2024).
- 72.Liu X., Zhang W. & Zhang M.-L. Attention is not what you need: Revisiting multi-instance learning for whole slide image classification. arXiv preprint arXiv:2408.09449 (2024).
- 73.Raff E. & Holt J. Reproducibility in multiple instance learning: a case for algorithmic unit tests. Adv. Neural Inf. Process. Syst. 36 (2024). [Google Scholar]
- 74.Lin T., Yu Z., Hu H., Xu Y. & Chen C.-W. Interventional bag multi-instance learning on whole-slide pathological images. In Proceedings of the IEEE/CVF Conference on Computer Vision and Pattern Recognition, 19830–19839 (2023). [Google Scholar]
- 75.Pocevičiūtė M., Eilertsen G. & Lundström C. Survey of xai in digital pathology. Artif. intelligence machine learning for digital pathology: state-of-the-art future challenges 56–88 (2020).
- 76.Zeiler M. D. & Fergus R. Visualizing and understanding convolutional networks. In Computer Vision–ECCV 2014: 13th European Conference, Zurich, Switzerland, September 6–12, 2014, Proceedings, Part I 13, 818–833 (Springer, 2014). [Google Scholar]
- 77.Pozzi M. et al. Generating and evaluating synthetic data in digital pathology through diffusion models. Sci. Reports 14, 28435, DOI: 10.1038/s41598-024-79602-w (2024). [DOI] [PMC free article] [PubMed] [Google Scholar]
- 78.Lin C., Covert I. & Lee S.-I. On the robustness of removal-based feature attributions. Adv. Neural Inf. Process. Syst. 36 (2024). [Google Scholar]
- 79.Bertalmio M., Sapiro G., Caselles V. & Ballester C. Image inpainting. In Proceedings of the 27th annual conference on Computer graphics and interactive techniques, 417–424 (2000). [Google Scholar]
- 80.Tjoa E. & Guan C. A survey on explainable artificial intelligence (xai): Toward medical xai. IEEE transactions on neural networks learning systems 32, 4793–4813 (2020). [DOI] [PubMed] [Google Scholar]
- 81.Graziani M., Lompech T., Müller H. & Andrearczyk V. Evaluation and comparison of cnn visual explanations for histopathology. In Proceedings of the AAAI Conference on Artificial Intelligence Workshops (XAI-AAAI-21), Virtual Event, 8–9 (2021). [Google Scholar]
- 82.Afshar P., Hashembeiki S., Khani P., Fatemizadeh E. & Rohban M. H. Ibo: Inpainting-based occlusion to enhance explainable artificial intelligence evaluation in histopathology. arXiv preprint arXiv:2408.16395 (2024). [Google Scholar]
- 83.DeGrave A. J., Cai Z. R., Janizek J. D., Daneshjou R. & Lee S.-I. Auditing the inference processes of medical-image classifiers by leveraging generative ai and the expertise of physicians. Nat. Biomed. Eng. 1–13 (2023). [DOI] [PubMed]
- 84.Ktena I. et al. Generative models improve fairness of medical classifiers under distribution shifts. Nat. Medicine 1–8 (2024). [DOI] [PMC free article] [PubMed]
- 85.Taori R. et al. Measuring robustness to natural distribution shifts in image classification. Adv. Neural Inf. Process. Syst. 33, 18583–18599 (2020). [Google Scholar]
- 86.Geirhos R. et al. Shortcut learning in deep neural networks. Nat. Mach. Intell. 2, 665–673, DOI: 10.1038/s42256-020-00257-z (2020). [DOI] [Google Scholar]
- 87.DeGrave A. J., Janizek J. D. & Lee S.-I. Ai for radiographic covid-19 detection selects shortcuts over signal. Nat. Mach. Intell. 3, 610–619 (2021). [Google Scholar]
- 88.He K., Zhang X., Ren S. & Sun J. Deep residual learning for image recognition. In Proceedings of the IEEE conference on computer vision and pattern recognition, 770–778 (2016). [Google Scholar]
- 89.Sarnaik A. A. et al. Lifileucel, a tumor-infiltrating lymphocyte therapy, in metastatic melanoma. J. Clin. Oncol. 39, 2656–2666, DOI: 10.1200/JCO.21.00612 (2021). [DOI] [PMC free article] [PubMed] [Google Scholar]
- 90.Healey N. Tumor infiltrating lymphocyte approval heralds new era for precision cancer immunotherapy. Nat. Medicine 30, 1795–1796, DOI: 10.1038/d41591-024-00040-2 (2024). [DOI] [PubMed] [Google Scholar]
- 91.Han S. et al. Idh mutation in glioma: molecular mechanisms and potential therapeutic targets. Br. journal cancer 122, 1580–1589 (2020). [DOI] [PMC free article] [PubMed] [Google Scholar]
- 92.Roetzer-Pejrimovsky T. et al. The digital brain tumour atlas, an open histopathology resource. Sci. Data 9, 55 (2022). [DOI] [PMC free article] [PubMed] [Google Scholar]
- 93.Jaume G. et al. Hest-1k: A dataset for spatial transcriptomics and histology image analysis. arXiv preprint arXiv:2406.16192 (2024).
- 94.Bankhead P. et al. Qupath: Open source software for digital pathology image analysis. Sci. reports 7, 1–7, DOI: 10.1038/s41598-017-17204-5 (2017). [DOI] [PMC free article] [PubMed] [Google Scholar]
- 95.Goode A., Gilbert B., Harkes J., Jukic D. & Satyanarayanan M. Openslide: A vendor-neutral software foundation for digital pathology. J. pathology informatics 4, 27 (2013). [DOI] [PMC free article] [PubMed] [Google Scholar]
- 96.Graham S. et al. Hover-net: Simultaneous segmentation and classification of nuclei in multi-tissue histology images. Med. image analysis 58, 101563 (2019). [DOI] [PubMed] [Google Scholar]
Associated Data
This section collects any data citations, data availability statements, or supplementary materials included in this article.
Supplementary Materials
Data Availability Statement
The CAMELYON16 dataset is available at https://camelyon17.grand-challenge.org/Data/ under the CC0 license (public domain). The results shown here are in whole or part based upon data generated by the TCGA Research Network: https://www.cancer.gov/tcga. Clinical data and whole slide image files can be accessed at https://portal.gdc.cancer.gov. Training and validation splits for prognostic models were accessed at https://github.com/mahmoodlab/PORPOISE.