Abstract
Purpose
To assess the reproducibility of radiomic features (RFs) extracted from dynamic contrast-enhanced computed tomography (DCE-CT) scans of patients diagnosed with hepatocellular carcinoma (HCC) with regards to inter-observer variability and acquisition timing after contrast injection. The predictive ability of reproducible RFs for differentiating between the degrees of HCC differentiation is also investigated.
Methods
We analyzed a set of DCE-CT scans of 39 patients diagnosed with HCC. Two radiologists independently segmented the scans, and RFs were extracted from each sequence of the DCE-CT scans. The same lesion was segmented across the DCE-CT sequences of each patient’s scan. From each lesion, 127 commonly used RFs were extracted. The reproducibility of RFs was assessed with regard to (i) inter-observer variability, by evaluating the reproducibility of RFs between the two radiologists; and (ii) timing of acquisition following contrast injection (inter- and intra-imaging phase). The reproducibility of RFs was assessed using the concordance correlation coefficient (CCC), with a cut-off value of 0.90. Reproducible RFs were used for building XGBoost classification models for the differentiation of HCC differentiation.
Results
Inter-observer analyses across the different contrast-enhancement phases showed that the number of reproducible RFs was 29 (22.8%), 52 (40.9%), and 36 (28.3%) for the non-contrast enhanced, late arterial, and portal venous phases, respectively. Intra- and inter-sequence analyses revealed that the number of reproducible RFs ranged between 1 (0.8%) and 47 (37%), inversely related with time interval between the sequences. XGBoost algorithms built using reproducible RFs in each phase were found to be high predictive ability of the degree of HCC tumor differentiation.
Conclusions
The reproducibility of many RFs was significantly impacted by inter-observer variability, and a larger number of RFs were impacted by the difference in the time of acquisition after contrast injection. Our findings highlight the need for quality assessment to ensure that scans are analyzed in the same physiologic imaging phase in quantitative imaging studies, or that phase-wide reproducible RFs are selected. Overall, the study emphasizes the importance of reproducibility and quality control when using RFs as biomarkers for clinical applications.
Introduction
Radiomics is an emerging translational field that aims to extract and analyze data from medical images, using quantitative image features known as radiomic features (RFs), to support evidence-based clinical decision-making [1–3]. Machine learning models built from RFs have a wide range of clinical applications, including predicting cancer prognosis and predicting aortic dissection [4, 5]. However, for these models to have greater legitimacy in clinical practice, the RFs from which they are built must be reproducible under a wide variety of factors related to image acquisition and processing [6–9]. For instance, a feature that is meaningful in one dataset may not be in another due to its sensitivity to acquisition settings (e.g., scanner manufacturer, scanning technique, and reconstruction parameters). As a result, the reproducibility of RFs has been extensively studied using human cohorts of a variety of pathologies and phantom data as well [10–18].
Despite this, limited studies have examined the reproducibility of RFs across and within different CT contrast-enhancement phases, mainly due to the lack of dynamic contrast-enhanced computed tomography (DCE-CT) images for this purpose. DCE-CT is typically used in the diagnosis and characterization of primary liver lesions, such as hepatocellular carcinoma [19–21]. DCE-CT scans are taken at different time points as the contrast travels through various organs and clinically be classified into three contrast enhancement phases (arterial, portal venous, and delayed phase) based on the LI-RADS 2018 criteria [22]. Because of the sensitivity of RFs, the accuracy and validity of models built using these features extracted from CT images acquired in different phases can be impacted [23–25]. There exists a need to study their reproducibility across and within all the contrast enhancement phases. However, there is a scarcity of literature on this topic, particularly in the imaging of liver lesions. Since Hepatocellular Cell Carcinoma (HCC) lesions show different characteristics in different imaging phases [26], biologically meaningful RFs could potentially have unique measurement values across the different phases [15, 27, 28]. However, to date, no study has evaluated the reproducibility of RFs within time windows in each contrast enhancement phase.
In this study, we present a unique dataset of DCE-CT scans from HCC patients. Our aims are: (i) to investigate the effects of differences in lesion segmentation on the reproducibility of RFs, and (ii) to assess the reproducibility of RFs within and across contrast enhancement phases, namely the non-contrast enhanced (NCE), late arterial (L-AP), and portal venous phases (PVP). Ultimately, the goal is to guide robust analysis of RFs extracted from contrast enhanced CTs.
Materials and methods
Patient data
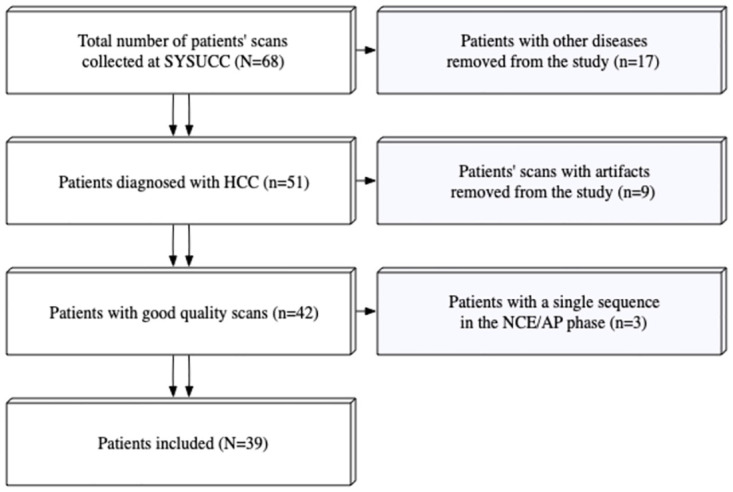
Completely de-identified DCE-CT scans of 68 patients who underwent liver lesion assessment were retrospectively collected at a single medical center, with the institutional review board approval. The inclusion criteria were: (i) Pathologically proven HCC; (ii) Absence of artifacts in the scans. Patients with pathologic diagnoses other than HCC (n = 17), patients with scans containing artifacts (n = 9), and those with missing sequences (n = 3) were excluded. This resulted in a total of 39 patients included for analysis in this study (Fig 1). All Scans were acquired prior to the start of treatment. The study was conducted in accordance with the Declaration of Helsinki and was approved by the Institutional Review Board of Sun Yat-Sen University Cancer Center (SYSUCC) (protocol code 510060, approved on November 9th, 2022). Informed consent was waived by the Institutional Review Board of SYSUCC. The data was accessed for research purposes on the 11th of January 2023.
Fig 1. A flowchart of the patients’ inclusion process.
Imaging data, segmentation, and RFs extraction
The DCE-CT scans were acquired using a TOSHIBA Aquilion scanner. Each sequence scan included four slices, with time intervals between consecutive DCE sequences of 1–2 seconds. Scanning of the patients commenced immediately after contrast injection. The number of DCE-CT sequences per patient ranged between 36 and 42 sequences. The acquisition and reconstruction parameters for the included DCE-CT scans are presented in Table 1.
Table 1. Acquisition and reconstruction parameters of the imaging data.
| Vendors | Model | X-Ray tube Current (mA) |
Exposure time (ms) |
kVP | Reconstruction kernel | Slice thickness (mm) | Pixel spacing (mm2) |
|---|---|---|---|---|---|---|---|
| Toshiba | Aquilion | 50–250 | 500–4000 | 120 | FC02 | 2, 5, 8 | 0.56x0.56–1.0x1.0 |
| FC04 | |||||||
| FL03 |
The volumes of interest (VOIs) of HCCs were independently segmented by two radiologists (QW and PG, with four and five years of experience in abdominal imaging, respectively) using an integrated tumor segmentation tool customized from the open-source Weasis platform [29]. Each radiologist segmented the VOIs on the sequence where the tumor was most visible. The segmentations were then automatically propagated to the remaining sequences, and further reviewed by each radiologist to ensure correct and consistent lesion segmentation across all sequences. RFs were extracted from the VOIs using an in-house software. A set 127 RFs was extracted from each lesion, derived from different feature classes, including ‘First Order Statistics’, ‘Sigmoid Feature’, ‘Discrete Wavelet Transform’, ‘Edge Frequency’, ‘Fractal Dimension’, ‘GTDM’, ‘Gabor’, ‘LAW filter’, ‘LOG feature’, ‘Run Length’, ‘Spatial correlation’, ‘GLCM’, to characterize image patterns as comprehensively as possible. More details about feature class definitions as well as implementation details can be found in our previous work [10]. No image resampling was performed, and RFs were extracted by setting the bin width to 25 Hounsfield units. The extracted RFs are provided in S1 File.
Analysis of inter-observer variability
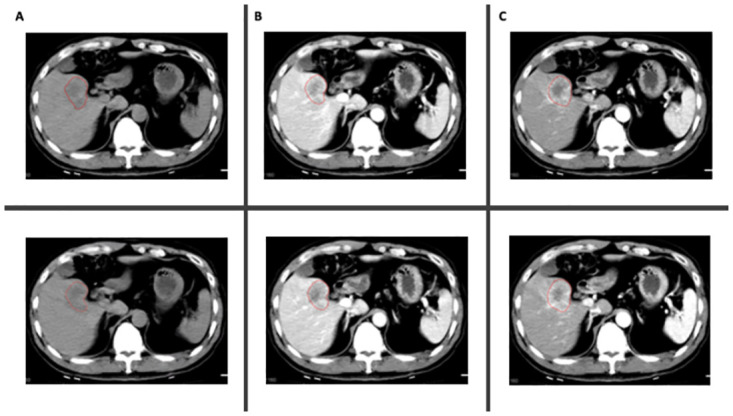
Two radiologists (QW and PG) independently assigned one of the labels (NCE, L-AP, or PVP) to each of the DCE sequences and segmented the HCC lesions (Fig 2). The labels were based on the LI-RADS Version 2018 criteria for defining dynamic CT phases, as well as other commonly used clinical criteria [22, 30]. Disagreements over the labels were reviewed and discussed with a third radiologist (YC, with six years of experience), and a consensus was reached on all labels. The similarity in the segmentations between the two radiologists was assessed using Dice Similarity Coefficient (DSC) [31]. The agreement in feature values extracted from all the sequences between the radiologists’ segmentations was assessed as one of the primary endpoints.
Fig 2. Example of segmentations in two different sequences per phase; (A) NCE; (B) L-AP; (C) PVP.
Analysis of effects of phase variability
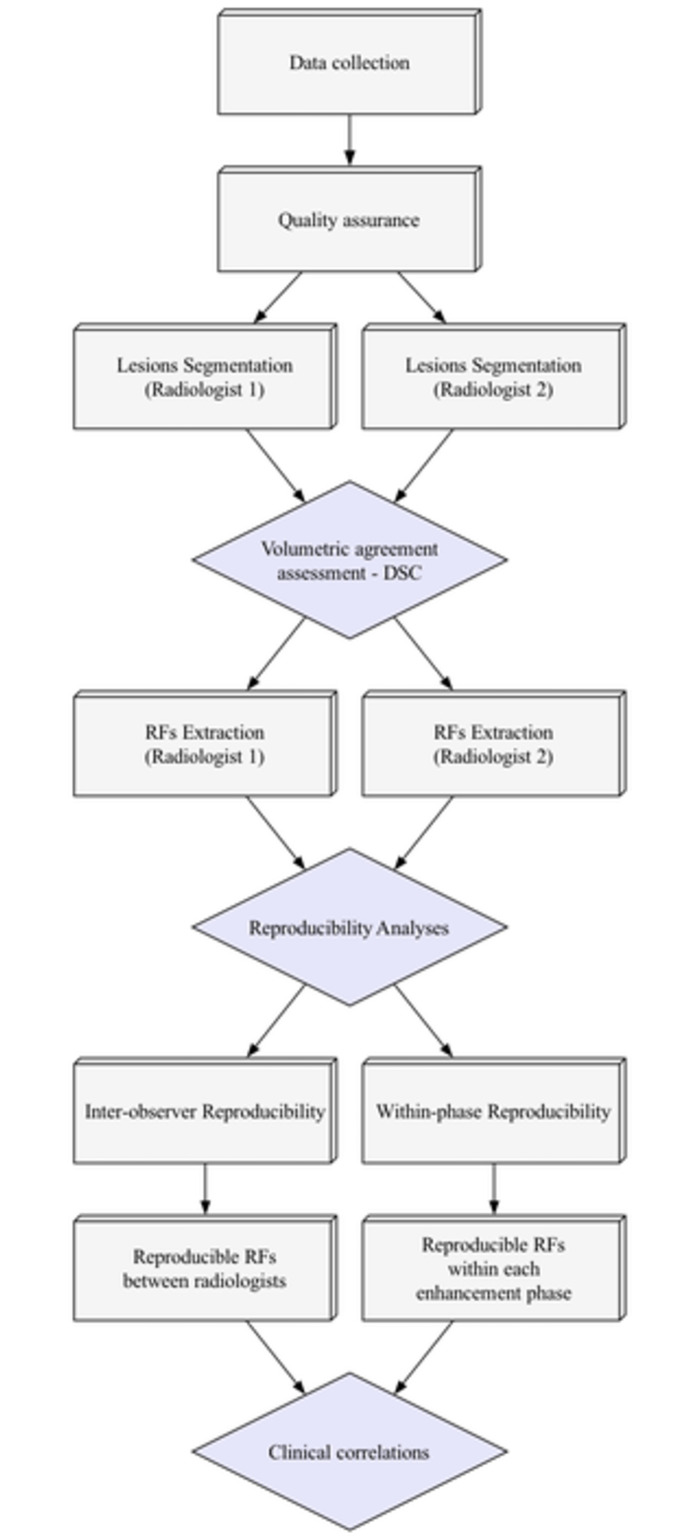
To assess the agreement in RF values within different phases for each radiologist independently, a different approach was used. The number of sequences within each phase needed to be the same for all the patients. Therefore, the fewest number of sequences available per phase across all patients was identified and set as the number of sequences to be included. Several patients had only two NCE sequences, therefore only the first two NCE sequences were included for all the patients. For the L-AP phase, seven sequences were selected for each patient: the first two, the middle three, and the last two sequences. Similarly, seven PVP sequences were included for each patient: the first two, the middle three, and the last two sequences. Pairwise comparisons were performed across all 16 selected sequences. The concordance correlation coefficient (CCC) with a cutoff of 0.90 was used to identify the within-phase reproducible RFs. Following the identification of reproducible RFs, features that were found to be highly correlated were removed. High correlation was defined as Spearman’s R > 0.90. When two RFs were found to be highly correlated, the one with the higher average correlation with the remaining RFs was removed. The study workflow is depicted in Fig 3.
Fig 3. Study workflow.
Statistical analyses
All statistical analyses were performed using R language on RStudio version 2022.02.0 [32, 33]. To assess the agreement in RF values between the two radiologists, the CCC was used [34]. Pairwise comparisons were made across the included scans. RF values extracted from all segmented lesions by the two radiologists were compared once using all the data, and once within each contrast enhancement phase. RFs with CCC values equal to or higher than 0.90 were considered reproducible [35].
To assess the correlations between the reproducible RFs and the degree of histologic differentiation of the HCC lesions, Wilcoxon rank-sum test to assess differences in values across groups of well to moderately differentiated tumors and moderately to poorly differentiated tumors was used. The significance level was set at 0.05.
Machine learning was used to develop classification models using the reproducible RFs. For this analysis, the data were first split into 29 (74%) training and 10 (26%) testing sets. The outcomes in the training set were balanced using the synthetic minority oversampling technique (SMOTE). Following that, if the number of the reproducible features was less than 3, all were used for building the final model. If the number of reproducible RFs exceeded 3, recursive feature elimination with treebag functions and 5-fold cross-validation was used to select the most important RFs, with a maximum of 3. XGBoost algorithm was used to develop the classification model. The model was validated on the test set, and the AUC, sensitivity, specificity, negative predictive value (NPV), and positive predictive value (PPV) were used to assess the models’ performance.
Results
Patient data
The patients included (N = 39) had a median (IQR) age of 57 (43, 66) years, and 35 (89.7%) were male. Of the 39 patients, 37 (94.9%) had chronic Hepatitis B infection, and 7 (17.9%) reported consuming a minimum of 100 ml per day for longer than 30 years. According to pathology assessment, 3 (7.7%) patients had well-differentiated HCC, 4 (10.3%) had well to moderately differentiated HCC, 16 (41.0%) had moderately differentiated HCC, 12 (30.8%) had moderately to poorly differentiated HCC, and 4 (10.3%) had poorly differentiated HCC. The tumors had an average volume (± standard deviation) of 18537.6 (±16548.5) mm3. The average largest tumor diameter was 33.7 (±13.1) mm. All tumors were best visualized and first segmented on the L-AP sequences.
Inter-observer variability
The assessment of segmentation similarity between the radiologists showed a DSC of 0.79. Among the extracted features, 29 (22.8%) RFs were concordant across the NCE sequences; 52 (40.9%) RFs were concordant across the L-AP sequences; and 36 (28.3%) RFs were concordant across the portal venous phase sequences (Table 2).
Table 2. List of non-correlated reproducible RFs within the different phases between the radiologists.
| NCE | L-AP | PVP |
|---|---|---|
| GLCM Contrast | GLCM Contrast | GLCM Sum Squares |
| GLCM Sum Squares | LoG Z Uniformity | GLCM Contrast |
| GTDM Strength | GLCM Correlation | LoG Z Uniformity |
| Intensity 75percent | GLCM Sum Squares | GLCM ASM |
| Intensity Median | Gabor Min Z | RSRLGL Emphasis |
| Intensity Energy | Intensity 25percent | Gabor Min Z |
| Intensity 25percent | Intensity Root mean square | GLCM Correlation |
| RSRLGL Emphasis | Intensity Mean | RHGLR Emphasis |
| Intensity Root mean square | Intensity Median | RGL Uniformity |
| Intensity Mean | Intensity Energy | RSR Emphasis |
| RGL Uniformity | Intensity 75percent | Sigmoid Amplitude Mean |
| Intensity PeakPosition | Sigmoid Offset Mean | Gabor Median Z |
| RHGLR Emphasis | GLCM ASM | Gabor Min Z Boundary |
| RSR Emphasis | Intensity Maximum | Intensity 75percent |
| Sigmoid Amplitude Mean | Intensity PeakPosition | Intensity Energy |
| GLCM Correlation | Gabor sum Z | Gabor Mean Z Boundary |
| Gabor Max Z | RSRLGL Emphasis | Intensity Median |
| Intensity Uniformity | RHGLR Emphasis | Intensity Mean |
| GLCM ASM | GLCM Sum Entropy | Gabor Median Z Boundary |
| Intensity Mean absolute deviation | GLCM Entropy | Intensity Root mean square |
| DWF Z LLL | Gabor Mean Z Boundary | GTDM Strength |
| Intensity Variance | Laws 3 Z NoBoundary | Intensity 25percent |
| DWF Z LL | Gabor Median Z Boundary | Intensity PeakPosition |
| Spatial Correlation | GLCM Cluster Tendency | Gabor Max Z |
| DWF Z L | Gabor Mean Z | GTDM Complexity |
| LoG Z Uniformity | GLCM IDM | Gabor sum Z |
| Intensity Std | Sigmoid Amplitude Mean | Gabor Mean Z |
| Gabor Min Z | Sigmoid Amplitude Std | Intensity Uniformity |
| Intensity Entropy | Sigmoid Offset Mean | GLCM Diff Entropy |
| Sigmoid Offset Std | Intensity Entropy | |
| Spatial Correlation | Intensity Mean absolute deviation | |
| RSRHGL Emphasis | Emphasis | |
| Intensity Entropy | DWF Z LLL | |
| Intensity Mean absolute deviation | Intensity Std | |
| Sigmoid Amplitude Mean | DWF Z LL | |
| RLRHGL Emphasis | Laws 6 Z Boundary | |
| Intensity Uniformity | RLRHGL Emphasis | |
| Intensity Std | ||
| Intensity Variance | ||
| GLCM Diff Entropy | ||
| RLGLR Emphasis | ||
| GLCM MCC | ||
| DWF Z LLL | ||
| RLR Emphasis | ||
| GLCM IMC2 | ||
| GLCM Homogeneity | ||
| DWF Z LL | ||
| RPL Uniformity | ||
| DWF Z L | ||
| GLCM Max Prob | ||
| RGL Uniformity | ||
| GLCM IMC1 | ||
| GLCM Diff Variance | ||
| RSR Emphasis | ||
| Gabor Median Z | ||
| Laws 4 Z NoBoundary | ||
| GLCM Cluster Tendency |
RSRLGL: Run Short Run Low Gray Level; RGL: Run Gray Level; RSR: Run Short Run; RSRLGL: Run Short Run Low Gray Level; RLRHGL: Run Long Run High Gray Level; RHGLR: Run High Gray Level Run; RLRLGL: Run Long Run Low Gray Level; RLGLR: Run Low Gray Level Run; RPL: Run Primitive Length; RLR: Run Long Run; RSR: Run Short Run; RGL: Run Gray Level.
Effects of phase variability
Inter-phase variability
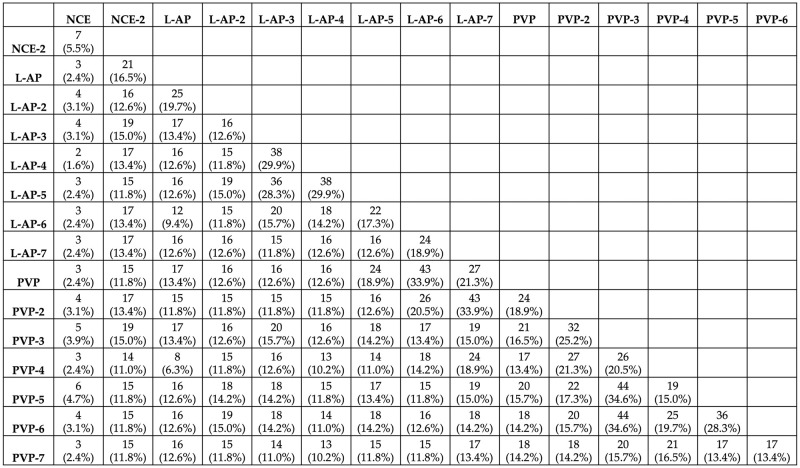
For Radiologist 1, the number of reproducible RFs varied across the pairwise comparisons, ranging from 2 (1.6%) to 44 (34.6%), with a median of 16 (12.6%) reproducible RFs (Fig 4).
Fig 4. The number of reproducible RFs across the different pairs for radiologist 1.
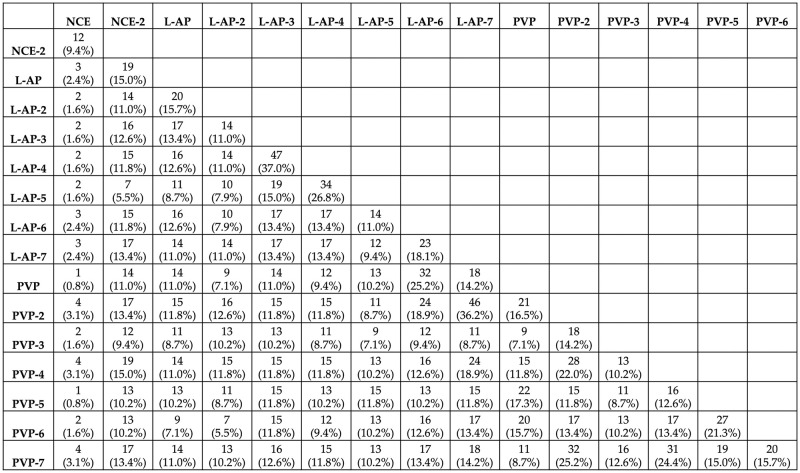
For Radiologist 2, the number of reproducible RFs varied across the pairwise, ranging from 1 (0.8%) to 47 (37%), with a median of 14 (11%) reproducible RFs (Fig 5).
Fig 5. The number of reproducible RFs across the different pairs for radiologist 2.
Intra-phase reproducible features
For Radiologist 1, the number of reproducible RFs in the NCE sequence comparisons was 7 (5.5%). For the L-AP and PVP sequences, 9 (7.1%), and 15 (11.8%) were found to be reproducible, respectively (Table 3).
Table 3. Reproducible RFs within each phase for radiologist 1.
| NCE | L-AP | PVP |
|---|---|---|
| RPL Uniformity | Gabor sum Z | DWF Z L |
| LoG Z Uniformity | Gabor Max Z | DWF Z LL |
| LoG Z Entropy | Gabor Mean Z | DWF Z LLL |
| Laws 1 Z Boundary | Gabor sum Z Boundary | Gabor sum Z |
| Laws 1 Z NoBoundary | Gabor Max Z Boundary | Gabor Max Z |
| GLCM Cluster Tendency | Gabor Mean Z Boundary | Gabor Mean Z |
| GLCM Sum Squares | Gabor Median Z Boundary | Gabor Median Z |
| LoG Z MGI | Gabor sum Z Boundary | |
| LoG Z Entropy | Gabor Max Z Boundary | |
| Gabor Mean Z Boundary | ||
| Gabor Median Z Boundary | ||
| LoG Z MGI | ||
| LoG Z Entropy | ||
| LoG Z Uniformity | ||
| RPL Uniformity |
For Radiologist 2, the number of reproducible RFs in the NCE sequences comparison was 12 (9.4%). For L-AP, and PVP sequences, 5 (3.9%), and 10 (7.9%), RFs were found to be reproducible across all comparisons, respectively (Table 4).
Table 4. Reproducible RFs within each phase for radiologist 2.
| NCE | L-AP | PVP |
|---|---|---|
| RPL Uniformity | Gabor_Median_Z | Gabor sum Z |
| LoG Z Uniformity | Gabor_Median_Z_Boundary_ | Gabor Mean Z |
| LoG Z Entropy | LoG_Z_MGI | Gabor Median Z |
| Laws 1 Z Boundary | LoG_Z_Entropy | Gabor sum Z Boundary |
| GLCM Cluster Tendency | LoG_Z_Uniformity | Gabor Mean Z Boundary |
| GLCM Sum Squares | Gabor Median Z Boundary | |
| Laws 2 Z Boundary | LoG Z MGI | |
| Laws 1 Z NoBoundary | LoG Z Entropy | |
| Spatial Correlation | LoG Z Uniformity | |
| Laws 2 Z NoBoundary | Gabor sum Z | |
| Intensity 75percent | ||
| GTDM Complexity |
Clinical correlations
Descriptive statistics
The association between the reproducible RFs and the degree of histologic differentiation of HCC was assessed for each reproducible RF within each phase per radiologist.
The descriptive statistics of reproducible RFs, and Wilcoxon’s p value for radiologists 1 and 2 are presented in Tables 5 and 6, respectively.
Table 5. Descriptive statistics of reproducible RFs for radiologist 1.
| Well/ well to moderately differentiated | Moderately/moderately to poorly differentiated | Wilcoxon’s P | ||||
|---|---|---|---|---|---|---|
| Feature | Reproducible in | Mean | Std | Mean | Std | |
| LoG Z Entropy | All | 0.81084088 | 0.19784667 | 0.73873998 | 0.19999369 | 0.02 |
| LoG Z Uniformity | All | 0.78372545 | 0.06505319 | 0.80779936 | 0.06743802 | 0.007 |
| RPL Uniformity | All | 5711.28719 | 3601.99597 | 7096.44203 | 5113.26691 | 0.19 |
| GLCM Cluster Tendency | NCE | 4.13538221 | 2.57371024 | 25.3603648 | 80.6924916 | 0.04 |
| GLCM Sum Squares | NCE | 1.21385 | 0.68590361 | 6.51011919 | 20.2192168 | 0.06 |
| Laws 1 Z Boundary | NCE | -5.4428589 | 30.4929671 | 75.1900693 | 238.403838 | 0.04 |
| Laws 1 Z NoBoundary | NCE | -0.0012624 | 29.967227 | 56.6860394 | 194.590942 | 0.21 |
| Gabor Max Z | L-AP, PVP | 191738.865 | 89148.508 | 165261.087 | 77492.9668 | 0.02 |
| Gabor Max Z Boundary | L-AP, PVP | 142946.827 | 72493.964 | 124979.013 | 63201.4264 | 0.07 |
| Gabor Mean Z | L-AP, PVP | 102997.378 | 43414.2068 | 92292.0788 | 42779.8162 | 0.03 |
| Gabor Mean Z Boundary | L-AP, PVP | 73125.5601 | 33650.0336 | 65258.6635 | 32660.1312 | 0.06 |
| Gabor Median Z Boundary | L-AP, PVP | 68511.5623 | 29154.9881 | 62058.8812 | 31611.4923 | 0.04 |
| Gabor sum Z | L-AP, PVP | 102997.378 | 43414.2068 | 92292.0788 | 42779.8162 | 0.03 |
| Gabor sum Z Boundary | L-AP, PVP | 73125.5601 | 33650.0336 | 65258.6635 | 32660.1312 | 0.06 |
| LoG Z MGI | L-AP, PVP | -106.45322 | 45.3658445 | -97.463615 | 43.207301 | 0.19 |
| DWF Z L | PVP | 46760.9049 | 11789.8323 | 50914.6943 | 12912.3405 | 0.03 |
| DWF Z LL | PVP | 182570.699 | 47222.3263 | 199565.35 | 52601.3594 | 0.04 |
| DWF Z LLL | PVP | 696397.637 | 189172.778 | 766498.316 | 215973.343 | 0.04 |
| Gabor Median Z | PVP | 98430.8248 | 42631.8654 | 91752.466 | 43439.3522 | 0.18 |
| LoG Z Entropy | All | 0.81084088 | 0.19784667 | 0.73873998 | 0.19999369 | 0.02 |
| LoG Z Uniformity | All | 0.78372545 | 0.06505319 | 0.80779936 | 0.06743802 | 0.007 |
Table 6. Descriptive statistics of reproducible RFs for radiologist 2.
| Well/ well to moderately differentiated | Moderately/moderately to poorly differentiated | Wilcoxon’s P | ||||
|---|---|---|---|---|---|---|
| Feature | Reproducible in | Mean | Std | Mean | Std | |
| LoG Z Entropy | All | 0.84017141 | 0.20049751 | 0.77365664 | 0.21928965 | 0.05 |
| LoG Z Uniformity | All | 0.7740279 | 0.06662804 | 0.79548159 | 0.07492333 | 0.03 |
| RPL Uniformity | NCE | 5313.05116 | 3068.62499 | 6447.44889 | 4782.4508 | 0.63 |
| Laws 1 Z Boundary | NCE | -1.5328711 | 32.3471104 | 93.3039239 | 284.303348 | 0.11 |
| GLCM Cluster Tendency | NCE | 3.68511314 | 2.09531987 | 32.0283901 | 92.7285088 | 0.04 |
| GLCM Sum Squares | NCE | 1.08411679 | 0.59919914 | 8.18591084 | 23.2482303 | 0.05 |
| Laws 2 Z Boundary | NCE | -0.3968899 | 5.82649192 | 4.96820483 | 20.4548899 | 0.87 |
| Laws 1 Z NoBoundary | NCE | 0.01004171 | 26.1001051 | 65.1889458 | 226.154652 | 0.27 |
| Spatial Correlation | NCE | 3.9978685 | 0.00285726 | 3.99639061 | 0.01241057 | 0.23 |
| Laws 2 Z NoBoundary | NCE | -0.0051824 | 3.36182758 | 3.57497103 | 13.4274582 | 0.81 |
| Intensity 75percent | NCE | 46.0714286 | 9.96504881 | 37.765625 | 8.4303725 | 0.002 |
| GTDM Complexity | NCE | 22.7597394 | 17.2464581 | 99.6954943 | 183.20409 | 0.13 |
| Gabor Median Z | L-AP, PVP | 95078.2523 | 38553.17 | 92149.0064 | 45708.9279 | 0.21 |
| Gabor Median Z Boundary | L-AP, PVP | 67950.499 | 28335.9102 | 65638.1497 | 33849.1774 | 0.21 |
| LoG Z MGI | L-AP, PVP | -111.50057 | 45.563221 | -104.89081 | 48.0902486 | 0.19 |
| Gabor sum Z | PVP | 110196.985 | 49865.3778 | 103158.139 | 46503.8447 | 0.31 |
| Gabor Mean Z | PVP | 110196.985 | 49865.3778 | 103158.139 | 46503.8447 | 0.31 |
| Gabor sum Z Boundary | PVP | 78687.0126 | 38459.4449 | 72504.6692 | 34873.3984 | 0.22 |
| Gabor Mean Z Boundary | PVP | 78687.0126 | 38459.4449 | 72504.6692 | 34873.3984 | 0.22 |
| LoG Z Entropy | All | 0.84017141 | 0.20049751 | 0.77365664 | 0.21928965 | 0.04 |
Classification models: NCE
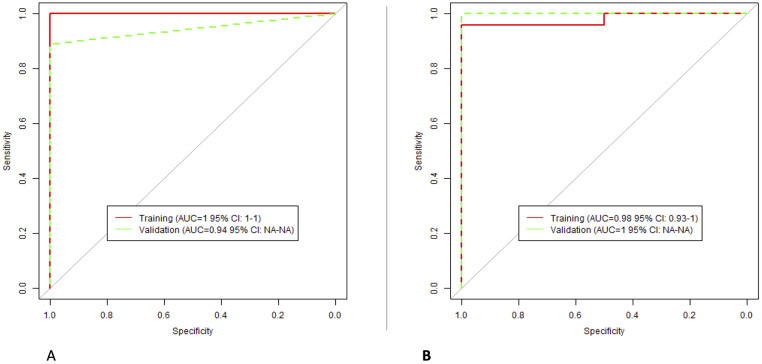
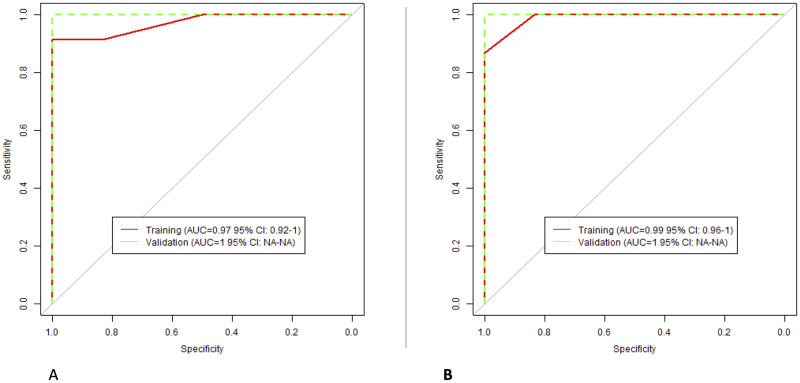
XGBoost algorithms to classify the degree of HCC lesion differentiation were built using the reproducible RFs. For radiologist 1, the selected RFs were: “GLCM Sum Squares”, “GLCM Cluster Tendency”, and “Laws 1 Z Boundary”. For radiologist 2, the selected features were: “Intensity 75percent”, “Spatial Correlation”, and “GLCM Cluster Tendency”. The models’ performance is presented in Fig 6.
Fig 6. The performance of NCE classification models; (A) Radiologist 1; (B) Radiologist 2.
Classification models: L-AP
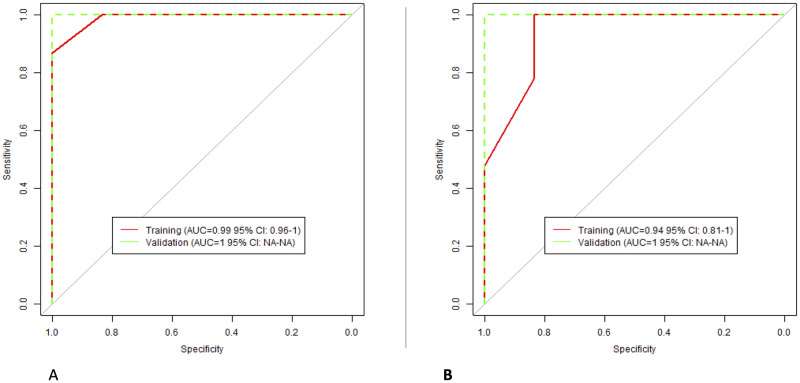
For radiologist 1, the selected RFs were: “Gabor Max Z”, and “Gabor sum Z”. For radiologists 2, the selected RFs were: “LoG Z Entropy”, “LoG Z Uniformity”, and “LoG Z MGI”. The performance of the models is presented in Fig 7.
Fig 7. The performance of L-AP classification models; (A) Radiologist 1; (B) Radiologist 2.
Classification models: PVP
For radiologist 1, the selected RFs were: “DWF Z L”, “DWF Z LL”, and “LoG Z Uniformity”. For radiologists 2, the included RFs were: “Gabor Median Z”, “Gabor sum Z”, and “Gabor Mean Z”. The performance of the models is presented in Fig 8.
Fig 8. The performance of PVP classification models; (A) Radiologist 1; (B) Radiologist 2.
Discussion
In this study, using our HCC DCE-CT dataset, we assessed the effects of interobserver (inter-segmentation) variability on the reproducibility of RFs, as well as the agreement in RF values within each of the three clinically used imaging phases. Uniquely, we analyzed DCE-CT scans, which provide sequential CT images with specific time intervals (in a range of seconds). Thus, we were able to analyze the reproducibility of RFs within the window of different contrast enhancement phases, which was not previously investigated. As expected, our results showed that the differences in RF values attributed to the variations in imaging timing/sequences were more profound compared to the interobserver effects. At least a quarter of the extracted RFs were reproducible between the two radiologists across different phases, while the number of reproducible RFs for the same radiologist varied between 1% and 37% depending on the pairs of DCE-CT sequences compared. The removal of the highly correlated RFs further significantly reduced the number of reproducible RFs. Henceforth, the segmentation and timing variabilities are important factors that significantly affect the reproducibility of RFs. These findings align with previous studies that assessed the effects of inter-observer variability and clinically used imaging phases on the reproducibility of RFs [13, 15, 36–40].
The findings of this study are consistent with previous research that, in a more limited manner, investigated the effects of contrast enhancement on the reproducibility of RFs [27, 40, 41]. A prior study investigating the reproducibility of HCC RFs across the imaging phases (arterial and PVP) reported that 25% of the original RFs extracted with Pyradiomics toolbox were reproducible [15]. Another published study examining the effects of variations in imaging phase on the reproducibility and predictive power of renal cell carcinoma RFs across the NCE, AP, and PVP scans reported a maximum agreement of 22.4% between the NCE and PVP scans, while the PVP RFs were found to be the least predictive of overall survival in renal cell carcinoma patients [24]. Based on the findings of these studies, the tumor type and site variations also impact the effects of contrast enhancement on the reproducibility of RFs, as different sets of features were reported across studies that investigated different tumor types and sites, in addition to the differences in type and make of imaging hardware.
Unlike prior studies, our data allowed us to investigate within-phase reproducibility. Our results demonstrate that even subtle changes in acquisition time can significantly affect the reproducibility of the extracted RFs. Different phases are acquired to study tumor changes, such as intensity wash-in/wash-out, and they should be analyzed separately in quantitative image analysis. Yet, these were sometimes analyzed together in the literature. The majority of the RFs in this experiment had a very narrow window of reproducibility across the DCT sequences. This confirms the need for both care and caution when investigating RFs acquired in even slightly different contrast enhancement. This is critical for radiomics analyses since most imaging cohorts, whether publicly or privately available, are acquired in different contrast enhancement phases. We strongly recommend the inclusion of a phase determination step in radiomics studies analyzing contrast-enhanced imaging datasets.
Interestingly, our results showed that the numbers of reproducible RFs within each phase and across all pairs differed per radiologist. The highest number of reproducible RFs was observed in the PVP comparisons for both radiologists. While this result could be due to the different numbers of comparisons available for each phase, it might also relate to the appearance of HCC lesions in different imaging phases. Nevertheless, when considering the agreement between radiologists, the L-AP phase had the highest number of reproducible non-correlated RFs, which was also the phase where radiologists performed the first segmentation. It is worth noting that while these RFs have the highest reproducibility, their predictive value must also be considered when selecting the most suitable phase for HCC radiomic studies. Our results reiterate the need for proper quality and reproducibility assessments before performing radiomics analyses.
When considering interobserver variability, our analysis revealed a high agreement in RF values between radiologists in less than a third of the extracted RFs. The number of RFs varied slightly when each phase was assessed separately, with PVP segmentations showing the highest number of reproducible RFs. A similar pattern was observed for intra-phase variability; the highest concordance in RF values was observed across the PVP comparisons.
The evaluation of reproducible RFs within each phase, and for each radiologist, demonstrated a high discriminative ability between the degrees of HCC differentiation in our dataset. These RFs, which intuitively describe the texture of the lesions, thus meet both key criteria for biomarkers: reproducibility and predictivity.
While we carefully designed and executed the statistical analyses in this study, several limitations remain. First, the number of sequences per phase varied among the included patients, which we addressed by standardizing the number of sequences per patient for imaging phase analyses. The scans were selected based on their position within the phase sequences. The different number of within-phase comparisons most likely affects the final number of reproducible RFs per phase. Second, different vendors and imaging parameters were used to acquire the scans, which impacts the reproducibility of RFs. Although the comparisons in this experiment were longitudinal, the rank of patients could be variably affected, ultimately impacting the calculated CCC values. The lack of data prevented the analysis of the effects of variations in imaging acquisition and reconstruction parameters on RFs. While the number of patients included in this study was limited to 39, CCC values are robust in a sample size as small as 10 patients. In addition, previous studies investigating the reproducibility of RFs used a similar number of patients [10, 28, 42–46], including studies on HCC radiomics [47–51]. Lastly, although the reproducible RFs were found to be predictive of the degree of HCC differentiation, the limited number of patients constrains the generalizability of this finding. However, this study serves as a pilot, especially since previous radiomics studies investigating the association between RFs and HCC differentiation have primarily focused on magnetic resonance imaging features.
In conclusion, our results indicate that the majority of RFs are sensitive to variations in the time of acquisition following the injection of a contrast agent. Future radiomics studies should analyze scans acquired in different contrast enhancement phases separately or at least consider the imaging phase during analysis. Furthermore, interobserver variability significantly affects the reproducibility of RFs and must be accounted for in multi-observer radiomics studies. While portal venous phase scans yielded the highest reproducibility within and among radiologists and could be recommended for multi-institutional HCC radiomics studies, biological intent must also be considered when designing such a study.
Supporting information
(CSV)
Data Availability
All relevant data are within the manuscript and its Supporting information files.
Funding Statement
The author(s) received no specific funding for this work.
References
- 1.Lambin P., et al., Radiomics: extracting more information from medical images using advanced feature analysis. European journal of cancer, 2012. 48(4): p. 441–446. doi: 10.1016/j.ejca.2011.11.036 [DOI] [PMC free article] [PubMed] [Google Scholar]
- 2.Gillies R.J., Kinahan P.E., and Hricak H., Radiomics: images are more than pictures, they are data. Radiology, 2016. 278(2): p. 563–577. doi: 10.1148/radiol.2015151169 [DOI] [PMC free article] [PubMed] [Google Scholar]
- 3.Guiot J., et al., A review in radiomics: making personalized medicine a reality via routine imaging. Medicinal Research Reviews, 2022. 42(1): p. 426–440. doi: 10.1002/med.21846 [DOI] [PubMed] [Google Scholar]
- 4.Zhang Y., et al., Radiomics-based prognosis analysis for non-small cell lung cancer. Scientific reports, 2017. 7(1): p. 46349. doi: 10.1038/srep46349 [DOI] [PMC free article] [PubMed] [Google Scholar]
- 5.Guo Y., et al., Non-contrast CT-based radiomic signature for screening thoracic aortic dissections: a multicenter study. European Radiology, 2021. 31: p. 7067–7076. doi: 10.1007/s00330-021-07768-2 [DOI] [PubMed] [Google Scholar]
- 6.Yip S.S. and Aerts H.J., Applications and limitations of radiomics. Physics in Medicine & Biology, 2016. 61(13): p. R150. doi: 10.1088/0031-9155/61/13/R150 [DOI] [PMC free article] [PubMed] [Google Scholar]
- 7.Ibrahim A., et al., Radiomics for precision medicine: Current challenges, future prospects, and the proposal of a new framework. Methods, 2021. 188: p. 20–29. doi: 10.1016/j.ymeth.2020.05.022 [DOI] [PubMed] [Google Scholar]
- 8.Strimbu K. and Tavel J.A., What are biomarkers? Current Opinion in HIV and AIDS, 2010. 5(6): p. 463. doi: 10.1097/COH.0b013e32833ed177 [DOI] [PMC free article] [PubMed] [Google Scholar]
- 9.Zhao B., Understanding sources of variation to improve the reproducibility of radiomics. Frontiers in oncology, 2021. 11: p. 826. doi: 10.3389/fonc.2021.633176 [DOI] [PMC free article] [PubMed] [Google Scholar]
- 10.Zhao B., et al., Reproducibility of radiomics for deciphering tumor phenotype with imaging. Scientific reports, 2016. 6(1): p. 23428. doi: 10.1038/srep23428 [DOI] [PMC free article] [PubMed] [Google Scholar]
- 11.Meyer M., et al., Reproducibility of CT radiomic features within the same patient: influence of radiation dose and CT reconstruction settings. Radiology, 2019. 293(3): p. 583–591. doi: 10.1148/radiol.2019190928 [DOI] [PMC free article] [PubMed] [Google Scholar]
- 12.Fiset S., et al., Repeatability and reproducibility of MRI-based radiomic features in cervical cancer. Radiotherapy and Oncology, 2019. 135: p. 107–114. doi: 10.1016/j.radonc.2019.03.001 [DOI] [PubMed] [Google Scholar]
- 13.Granzier R.W., et al., MRI-based radiomics in breast cancer: feature robustness with respect to inter-observer segmentation variability. scientific reports, 2020. 10(1): p. 1–11. [DOI] [PMC free article] [PubMed] [Google Scholar]
- 14.Jha A., et al., Repeatability and reproducibility study of radiomic features on a phantom and human cohort. Scientific reports, 2021. 11(1): p. 1–12. [DOI] [PMC free article] [PubMed] [Google Scholar]
- 15.Ibrahim A., et al., Reproducibility of CT-based hepatocellular carcinoma radiomic features across different contrast imaging phases: A proof of concept on SORAMIC trial data. Cancers, 2021. 13(18): p. 4638. doi: 10.3390/cancers13184638 [DOI] [PMC free article] [PubMed] [Google Scholar]
- 16.Rinaldi L., et al., Reproducibility of radiomic features in CT images of NSCLC patients: an integrative analysis on the impact of acquisition and reconstruction parameters. European Radiology Experimental, 2022. 6(1): p. 2. doi: 10.1186/s41747-021-00258-6 [DOI] [PMC free article] [PubMed] [Google Scholar]
- 17.Granzier R.W., et al., Test–Retest Data for the Assessment of Breast MRI Radiomic Feature Repeatability. Journal of Magnetic Resonance Imaging, 2022. 56(2): p. 592–604. [DOI] [PMC free article] [PubMed] [Google Scholar]
- 18.Ibrahim A., et al., MaasPenn radiomics reproducibility score: A novel quantitative measure for evaluating the reproducibility of CT-based handcrafted radiomic features. Cancers, 2022. 14(7): p. 1599. doi: 10.3390/cancers14071599 [DOI] [PMC free article] [PubMed] [Google Scholar]
- 19.Hodler, J., R.A. Kubik-Huch, and G.K. von Schulthess, Diseases of the abdomen and pelvis 2018–2021: diagnostic imaging-IDKD book. 2018. [PubMed]
- 20.Li R., et al., Dynamic enhancement patterns of intrahepatic cholangiocarcinoma in cirrhosis on contrast-enhanced computed tomography: risk of misdiagnosis as hepatocellular carcinoma. Scientific Reports, 2016. 6(1): p. 1–8. [DOI] [PMC free article] [PubMed] [Google Scholar]
- 21.Baron R.L., et al., Hepatocellular carcinoma: evaluation with biphasic, contrast-enhanced, helical CT. Radiology, 1996. 199(2): p. 505–511. doi: 10.1148/radiology.199.2.8668803 [DOI] [PubMed] [Google Scholar]
- 22.Chernyak V., et al., Liver Imaging Reporting and Data System (LI-RADS) version 2018: imaging of hepatocellular carcinoma in at-risk patients. Radiology, 2018. 289(3): p. 816–830. doi: 10.1148/radiol.2018181494 [DOI] [PMC free article] [PubMed] [Google Scholar]
- 23.Ibrahim A., et al., The Impact of Image Acquisition Parameters and ComBat Harmonization on the Predictive Performance of Radiomics: A Renal Cell Carcinoma Model. Applied Sciences, 2022. 12(19): p. 9824. doi: 10.3390/app12199824 [DOI] [PMC free article] [PubMed] [Google Scholar]
- 24.Alkhafaji H. and Ibrahim A., Effects of Contrast Enhancement Phase on the Reproducibility and Predictivity of CT-Based Renal Lesions Radiomic Features. Applied Sciences, 2022. 12(24): p. 12599. [Google Scholar]
- 25.Dercle L., et al., Impact of variability in portal venous phase acquisition timing in tumor density measurement and treatment response assessment: metastatic colorectal cancer as a paradigm. JCO clinical cancer informatics, 2017. 1(1): p. 1–8. doi: 10.1200/CCI.17.00108 [DOI] [PMC free article] [PubMed] [Google Scholar]
- 26.Tsunematsu S., et al., Intratumoral artery on contrast-enhanced computed tomography imaging: differentiating intrahepatic cholangiocarcinoma from poorly differentiated hepatocellular carcinoma. Abdominal imaging, 2015. 40: p. 1492–1499. doi: 10.1007/s00261-015-0352-9 [DOI] [PubMed] [Google Scholar]
- 27.He L., et al., Effects of contrast-enhancement, reconstruction slice thickness and convolution kernel on the diagnostic performance of radiomics signature in solitary pulmonary nodule. Scientific reports, 2016. 6(1): p. 34921. doi: 10.1038/srep34921 [DOI] [PMC free article] [PubMed] [Google Scholar]
- 28.Yamashita R., et al., Radiomic feature reproducibility in contrast-enhanced CT of the pancreas is affected by variabilities in scan parameters and manual segmentation. European radiology, 2020. 30: p. 195–205. doi: 10.1007/s00330-019-06381-8 [DOI] [PMC free article] [PubMed] [Google Scholar]
- 29.Yang H., Schwartz L.H., and Zhao B., A Response Assessment Platform for Development and Validation of Imaging Biomarkers in Oncology. Tomography, 2016. 2(4): p. 406–410. doi: 10.18383/j.tom.2016.00223 [DOI] [PMC free article] [PubMed] [Google Scholar]
- 30.Scholtz J.-E. and Ghoshhajra B., Advances in cardiac CT contrast injection and acquisition protocols. Cardiovascular Diagnosis and Therapy, 2017. 7(5): p. 439. doi: 10.21037/cdt.2017.06.07 [DOI] [PMC free article] [PubMed] [Google Scholar]
- 31.Zou K.H., et al., Statistical validation of image segmentation quality based on a spatial overlap index1: scientific reports. Academic radiology, 2004. 11(2): p. 178–189. [DOI] [PMC free article] [PubMed] [Google Scholar]
- 32.Ihaka R. and Gentleman R., R: a language for data analysis and graphics. Journal of computational and graphical statistics, 1996. 5(3): p. 299–314. [Google Scholar]
- 33.Allaire, J., RStudio: integrated development environment for R. Boston, MA, 2012. 770(394): p. 165–171.
- 34.Lawrence I. and Lin K., A concordance correlation coefficient to evaluate reproducibility. Biometrics, 1989: p. 255–268. [PubMed] [Google Scholar]
- 35.McBride G., A proposal for strength-of-agreement criteria for Lin’s concordance correlation coefficient. NIWA client report: HAM2005-062, 2005. 45: p. 307–310. [Google Scholar]
- 36.Pavic M., et al., Influence of inter-observer delineation variability on radiomics stability in different tumor sites. Acta Oncologica, 2018. 57(8): p. 1070–1074. doi: 10.1080/0284186X.2018.1445283 [DOI] [PubMed] [Google Scholar]
- 37.Wong J., et al., Effects of interobserver and interdisciplinary segmentation variabilities on CT-based radiomics for pancreatic cancer. Scientific reports, 2021. 11(1): p. 16328. doi: 10.1038/s41598-021-95152-x [DOI] [PMC free article] [PubMed] [Google Scholar]
- 38.Li Z., Duan H., Zhao K., and Ding Y., Stability of MRI radiomics features of hippocampus: an integrated analysis of test-retest and inter-observer variability. Ieee Access, 2019. 7: p. 97106–97116. [Google Scholar]
- 39.Traverso A., et al., Sensitivity of radiomic features to inter-observer variability and image pre-processing in Apparent Diffusion Coefficient (ADC) maps of cervix cancer patients. Radiotherapy and Oncology, 2020. 143: p. 88–94. doi: 10.1016/j.radonc.2019.08.008 [DOI] [PubMed] [Google Scholar]
- 40.Kakino R., et al., Comparison of radiomic features in diagnostic CT images with and without contrast enhancement in the delayed phase for NSCLC patients. Physica Medica, 2020. 69: p. 176–182. doi: 10.1016/j.ejmp.2019.12.019 [DOI] [PubMed] [Google Scholar]
- 41.Wang Y., et al., Different CT slice thickness and contrast‐enhancement phase in radiomics models on the differential performance of lung adenocarcinoma. Thoracic cancer, 2022. 13(12): p. 1806–1813. doi: 10.1111/1759-7714.14459 [DOI] [PMC free article] [PubMed] [Google Scholar]
- 42.Hu P., et al., Reproducibility with repeat CT in radiomics study for rectal cancer. Oncotarget, 2016. 7(44): p. 71440. doi: 10.18632/oncotarget.12199 [DOI] [PMC free article] [PubMed] [Google Scholar]
- 43.Kelahan L.C., et al., Role of hepatic metastatic lesion size on inter-reader reproducibility of CT-based radiomics features. European Radiology, 2022. 32(6): p. 4025–4033. doi: 10.1007/s00330-021-08526-0 [DOI] [PubMed] [Google Scholar]
- 44.Xue C., et al., Reliability of MRI radiomics features in MR‐guided radiotherapy for prostate cancer: repeatability, reproducibility, and within‐subject agreement. Medical Physics, 2021. 48(11): p. 6976–6986. doi: 10.1002/mp.15232 [DOI] [PubMed] [Google Scholar]
- 45.Gitto S., et al., Effects of interobserver variability on 2D and 3D CT-and MRI-based texture feature reproducibility of cartilaginous bone tumors. Journal of Digital Imaging, 2021. 34(4): p. 820–832. doi: 10.1007/s10278-021-00498-3 [DOI] [PMC free article] [PubMed] [Google Scholar]
- 46.Hosseini S.A., et al., The impact of preprocessing on the PET-CT radiomics features in non-small cell lung cancer. Frontiers in Biomedical Technologies, 2021. 8(4): p. 261–272. [Google Scholar]
- 47.Qiu Q., et al., Reproducibility of radiomic features with GrowCut and GraphCut semiautomatic tumor segmentation in hepatocellular carcinoma. Transl Cancer Res, 2017. 6(5): p. 940–948. [Google Scholar]
- 48.Haniff N.S.M., et al., Stability and reproducibility of radiomic features based various segmentation technique on MR images of hepatocellular carcinoma (HCC). Diagnostics, 2021. 11(9): p. 1573. doi: 10.3390/diagnostics11091573 [DOI] [PMC free article] [PubMed] [Google Scholar]
- 49.Carbonell G., et al., Precision of MRI radiomics features in the liver and hepatocellular carcinoma. European Radiology, 2021: p. 1–11. doi: 10.1007/s00330-021-08282-1 [DOI] [PubMed] [Google Scholar]
- 50.Perrin T., et al., Short-term reproducibility of radiomic features in liver parenchyma and liver malignancies on contrast-enhanced CT imaging. Abdominal Radiology, 2018. 43: p. 3271–3278. doi: 10.1007/s00261-018-1600-6 [DOI] [PMC free article] [PubMed] [Google Scholar]
- 51.Escudero Sanchez L., et al., Robustness of radiomic features in CT images with different slice thickness, comparing liver tumour and muscle. Scientific reports, 2021. 11(1): p. 1–15. [DOI] [PMC free article] [PubMed] [Google Scholar]
Associated Data
This section collects any data citations, data availability statements, or supplementary materials included in this article.
Supplementary Materials
(CSV)
Data Availability Statement
All relevant data are within the manuscript and its Supporting information files.


