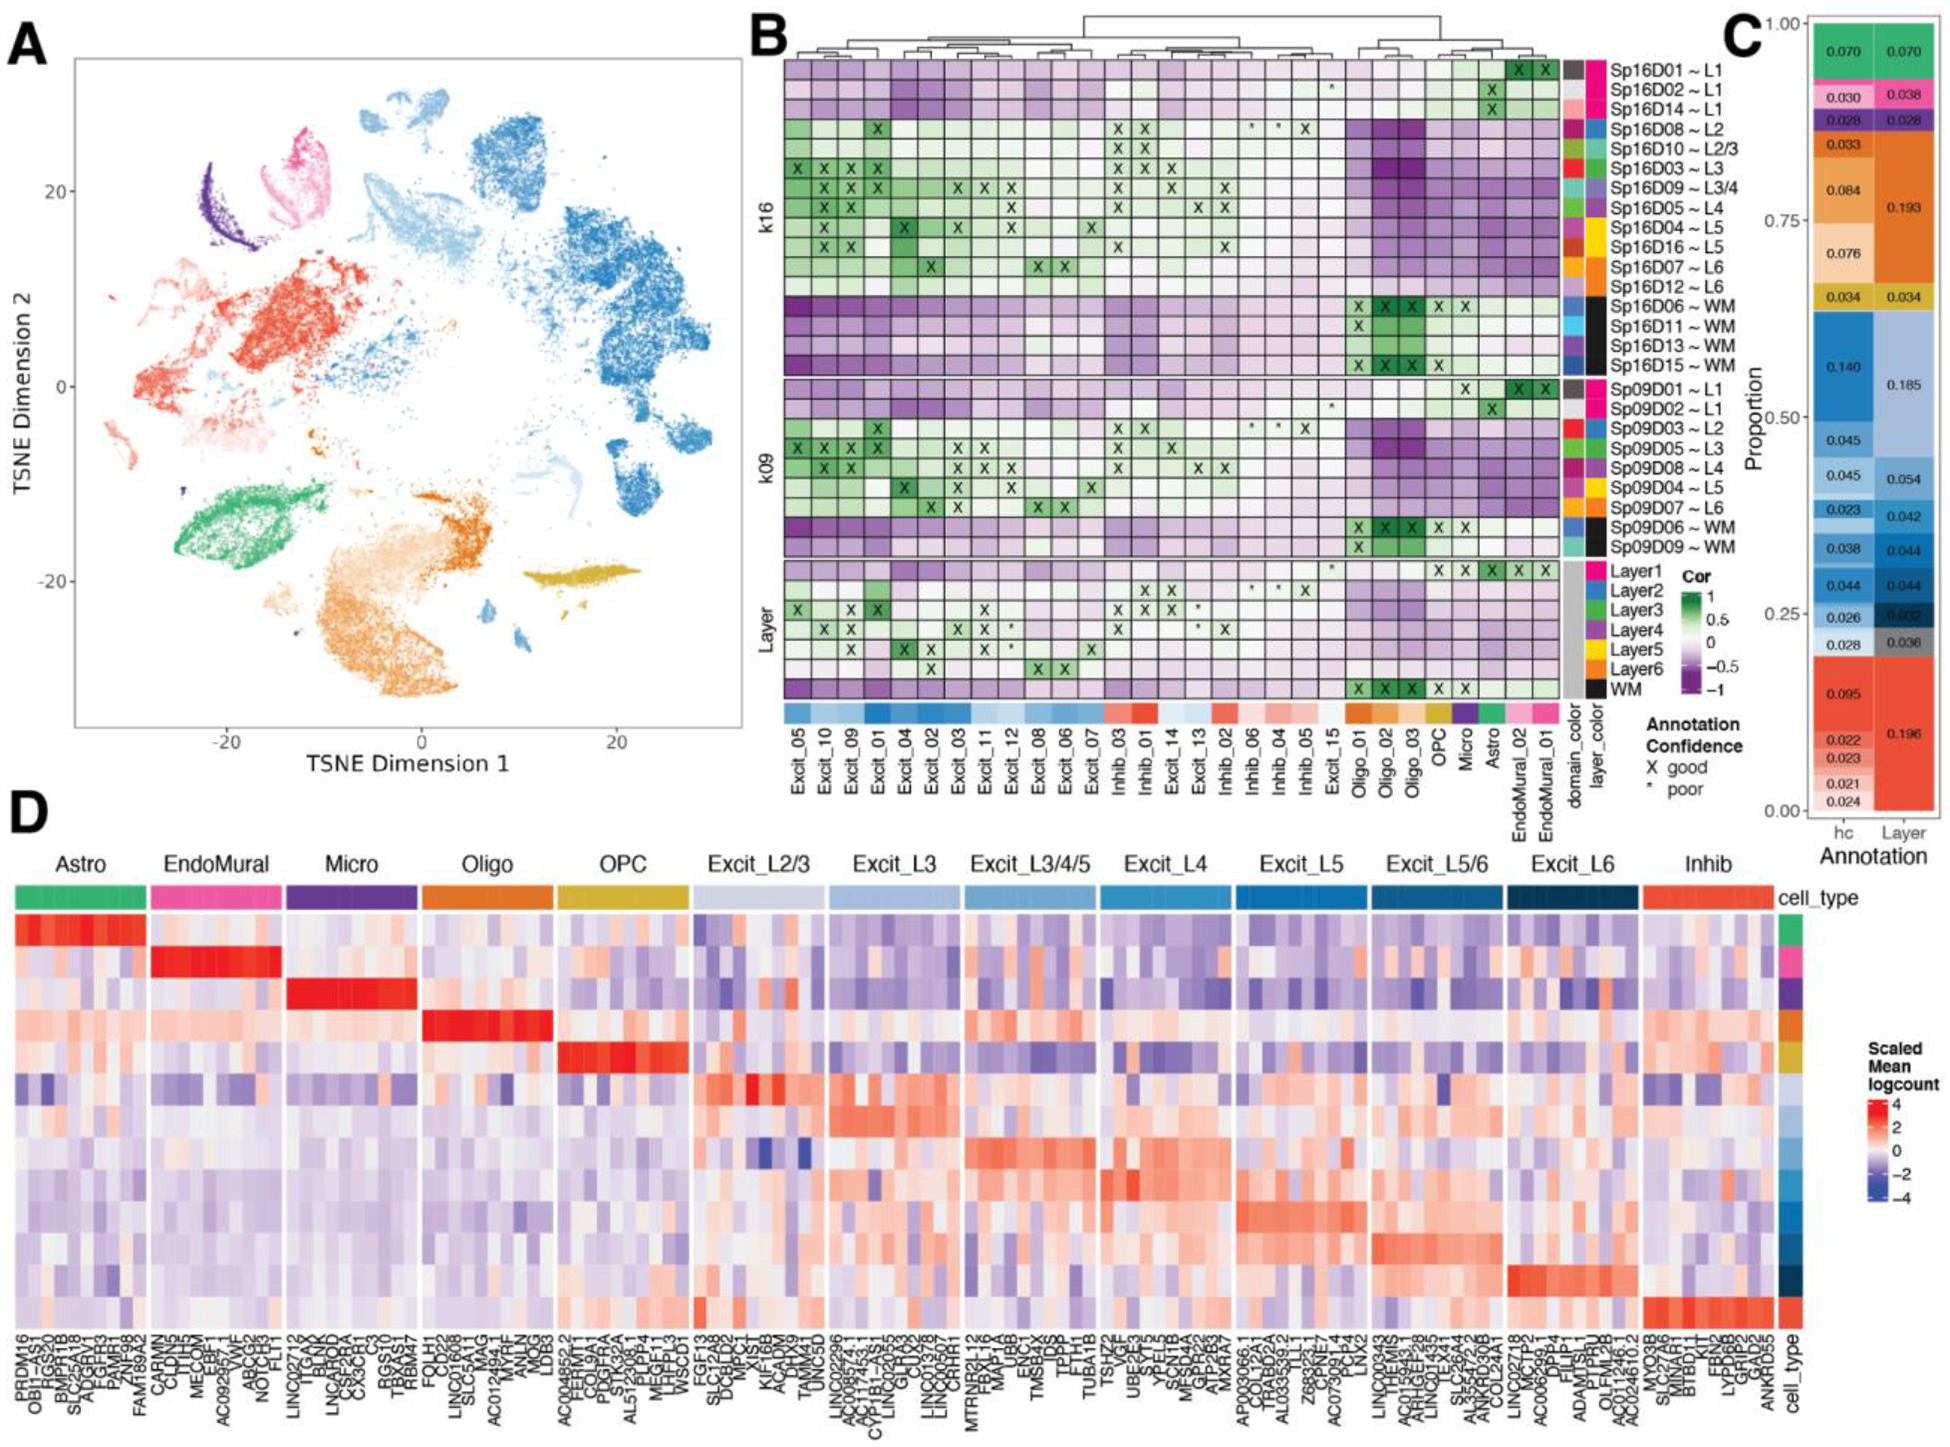
Figure 3. Spatial registration of fine resolution snRNA-seq clusters defining laminar cell types.

(A) t-distributed stochastic neighbor embedding (t-SNE) plot of 56,447 nuclei across 29 cell type-annotated fine resolution hierarchical clusters (hc; related to Fig S25A). (B) Spatial registration heatmap showing correlation between snRNA-seq hierarchical clusters (hc) and manually annotated histological layers from (12) as well as unsupervised BayesSpace clusters at k=9 and 16 (Sp9Ds and Sp16Ds). Hierarchical clusters for excitatory neurons (Excit) were assigned layer-level annotations following spatial registration to histological layers (cor > 0.25, merge ratio = 0.25, see Methods: snRNA-seq spatial registration). For Sp9Ds and Sp16Ds, annotations with good confidence (cor > 0.25, merge ratio = 0.1) are marked with “X” and poor confidence are marked with “*”. (C) Summary barplot of cell type composition for hc and layer level resolutions (related to Fig S25B & Fig S26) (D) Heatmap of the scaled mean pseudo-bulked logcounts for the top 10 marker genes identified for each cell type at layer-level resolution.
