Abstract
The process of chemical exchange saturation transfer (CEST) is quantified by evaluating a Z-spectra, where CEST signal quantification and Z-spectra fitting have been widely used to distinguish the contributions from multiple origins. Based on the exchange-dependent relaxation rate in the rotating frame (Rex), this paper introduces an additional pathway to quantitative separation of CEST effect. The proposed Rex-line-fit method is solved by a multi-pool model and presents the advantage of only being dependent of the specific parameters (solute concentration, solute‐water exchange rate, solute transverse relaxation, and irradiation power). Herein we show that both solute‐water exchange rate and solute concentration monotonously vary with Rex for Amide, Guanidino, NOE and MT, which has the potential to assist in solving quantitative separation of CEST effect. Furthermore, we achieve Rex imaging of Amide, Guanidino, NOE and MT, which may provide direct insight into the dependency of measurable CEST effects on underlying parameters such as the exchange rate and solute concentration, as well as the solute transverse relaxation.
Keywords: Chemical exchange saturation transfer, Quantitative separation, Rex-line-fit, Z-spectra
Subject terms: Medical research, Molecular medicine, Mathematics and computing
Introduction
Chemical exchange saturation transfer (CEST)-magnetic resonance imaging (MRI) is a new contrast enhancement technique that indirectly measures molecules with exchangeable protons and exchange-related properties, providing high detection sensitivity1–4. In practice, the saturation transfer effects of CEST-MRI are often assessed and quantified using a Z-spectra where the water signal is plotted as a function of the applied saturation frequency. For in vivo CEST-MRI, proper parameter quantifications demand careful measurement of the CEST effects (uncontaminated and with sufficient SNR) such as solute concentration and solute‐water exchange rate, thus rendering quantitative CEST a challenging task5.
Theoretically, the CEST parameter quantification through Z-spectra fitting demonstrated by Bloch-McConnell (BM) equations could provide a feasible approach, and yet there are the common problems of slow operation speed and converging to local optimal solution. Nevertheless, scholars spent their efforts and carried on studies of CEST quantification in another way. The symmetric magnetization transfer ratio (MTRasym) that calculated from a Z-spectra is the most used CEST quantification method6–8. However, MTRasym is confounded by several types of contamination, including direct saturation (DS), semisolid macromolecular magnetization transfer (MT) and nuclear Overhauser effect (NOE)9,10.
To further boost CEST specificity, Z-spectra fitting has been successfully applied to differentiate the contributions from multiple origins11, such as multiple‐pool Lorentzian fit12–14, the Lorentzian difference (LD) analysis15,16, and three‐point method11,12. For a specific solute along with overlapping signals from nearby pools, the LD analysis that employs a single Lorentzian line may not provide an accurate reference signal10,16. The same problem would still occur for a three‐point method that relies on two nearby signals as a reference. The multiple‐pool Lorentzian fit strongly relies on assumption that each CEST signal can be approximated as a Lorentzian lineshape17.
Recent advancements in the quantification methods of CEST and NOE techniques have significantly improved their application in biomedical imaging, particularly in the context of brain tumors detection18–22. For example, Glang et al. proposed a deep neural network with uncertainty quantification that can efficiently and accurately predict Lorentzian parameters from CEST MRI spectra, providing fast and reliable CEST contrast image reconstruction while indicating prediction trustworthiness18. Cui et al. proposed a new method termed as 2π-CEST to reduce the contribution from APT in detecting NOE, offering a more accurate strategy than the conventional asymmetric analysis20. The study concludes that NOE (− 3.5 ppm) serves as a highly sensitive MRI contrast for imaging membrane lipids in the brain, with lipids being the primary contributor to NOE (− 3.5 ppm) signals, rather than proteins, explaining variations in signals between tumors, gray matter, and white matter21.
Theoretically, the CEST specificity through Z-spectra rely on the pool size, exchange rate and relaxation time, as described by BM equations. Particularly, the exchange-dependent relaxation rate in the rotating frame (Rex) that solved from the BM equations by an eigenspace approach, operates independently of non‐specific tissue parameters and depends on specific parameters (solute concentration, solute‐water exchange rate, solute transverse relaxation and irradiation power), therefore it is able to make the CEST more specific2,4,16.
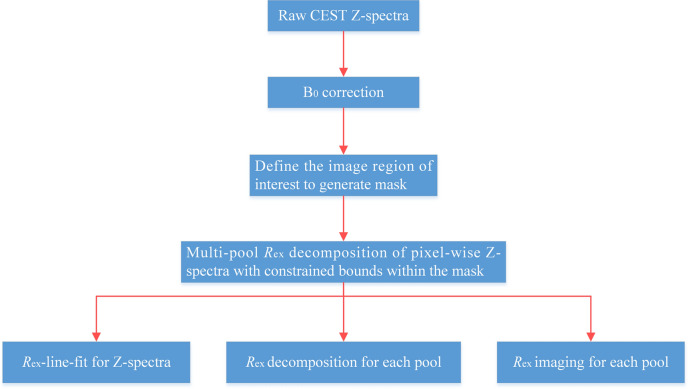
In this paper, a voxel-wise Rex-line-fit method is developed to improve the reliability of Z-spectra fitting and investigate the potential of quantitative separation (Fig. 1), in which the simulation of a 5-pool model is used to complement the program capabilities. Our study first elucidates the relationship between Rex and parameters such as solute concentration, solute‐water exchange rate and T2,s. Then the Rex imaging of Amide, NOE (− 3.5 ppm), Guanidino and MT is achieved by our method. Finally, we apply the Rex-line-fit to study CEST effect in a brain tumor model, and the performance of this method in fitting quality is evaluated.
Fig. 1.
Flow chart of data processing steps of Rex based approach.
Materials and methods
Exchange-dependent relaxation rate in the rotating frame (Rex)
The resulting solution for the Z-spectra can be described by the monoexponential decay of the z-magnetization as a function of time with the rate R1ρ2
| 1 |
where Pzeff is the projection factor on z-axis of the effective frame, tsat is saturation time.
In the case of steady-state, the resulting solution for the Z-spectra at each offset simplifies to23,24
| 2 |
where is the steady-state condition, denotes the longitudinal relaxation rate of water, and where is the amplitude of the RF field. The which describes the relaxation of free water in the rotating frame can be approximated by
| 3 |
Further, the at a particular off-resonant frequency for a general exchanging pool i is2
| 4 |
where is a fraction of the total proton for the ith pool, is its exchange rate with water in Hz, is its transversal relaxation rate, is its frequency offset in Hz, is the difference in Larmor frequency between pool i and water, and the full width half maximum is
| 5 |
Multiple-pool Lorentzian-line-fit
To estimate CEST effects from individual components, we performed the multiple-pool Lorentzian fitting of Z spectra using a non‐linear optimization algorithm25:
| 6 |
where
| 7 |
Equation (7) represents a Lorentzian line with central frequency offset from water (), peak FWHM (), and peak amplitude (). The value of N is the number of fitted pools; S is the measured signal on the Z-spectra; and S0 is the non-irradiation control signal.
In this study, a five-pool model of Lorentzian-line-fit including Amide at 3.5 ppm (L1), Guanidyl/Amine at 2.0 ppm (L2), Water at 0 ppm (L3), MT at − 2.4 ppm (L4), and NOE at − 3.5 ppm (L5) was performed to estimate CEST effects from individual components.
In vivo MR imaging
All animal care and experimental procedures comply with the National Research Council Guide for the Care and Use of Laboratory Animals. All animal experiments were approved by the Ethics Committee of Shantou University Medical College (Approval ID: SUMC2022-204) and conducted in accordance with the ARRIVE guidelines.
For our study, we used 8-week-old male SD rats (Beijing Vital River Laboratory Animal Technology Co., Ltd.) weighing approximately 250 g to establish a tumor-bearing model. In this study, three rats were prepared, where two rats were excluded from the present study due to tumor modeling failure that could not be used during data analysis. To implant the rat glioma C6 cells, a 10 µL suspension containing approximately 2 × 10⁶ cells was injected into the right basal ganglia of the rats using a Hamilton syringe and a 30-gauge needle. After two weeks of tumor cell implantation, the rats underwent MRI. During the MRI procedure, the rats were anesthetized with a mixture of isoflurane and O2 at a rate of 1 L/min. Anesthesia induction was achieved using 4.0% isoflurane, followed by maintenance anesthesia with 2.0–3.0% isoflurane. To monitor the breath rate, a respiratory probe was utilized throughout the MRI experiments. The rats' respiration rate and body temperature during the 7 T scan were maintained at approximately 60–70 breaths per minute and 38.5–39.5 °C, respectively.
MRI was conducted using a 7T horizontal bore small animal MRI scanner (Agilent Technologies, Santa Clara, CA, USA) equipped with a surface coil (Timemedical Technologies, China) for both transmission and reception. The positioning of the rat was carefully done to ensure that the tumor was accurately centered within the magnetic field. Imaging parameters were as follows: B1 = 1 µT, repetition time (TR) = 6000 ms, echo time (TE) = 40 ms, array = frequency offsets, slice thickness = 2 mm, field of view (FOV) = 64 × 64 mm, matrix size = 64 × 64, spatial resolution = 1 × 1 mm, averages = 1. An echo planar imaging (EPI) readout sequence was employed to acquire CEST images, utilizing continuous wave (CW) RF irradiation on the scanners. The saturation time was set to 5.0 s, with 49 frequency offsets evenly distributed from − 6 to 6 ppm relative to the resonance frequency of water.
Results
To assess the performance of the proposed Rex-line-fit, simulated Z-spectra are created using 5-pool system. The Rex fitting is conducted by using a non‐linear least square constrained optimization algorithm and referencing the pool parameters1,26,27 in Table 1. Pseudo-code of our method for Rex imaging and Z-spectra fitting is shown Table 2. The proposed Rex fitting is compared experimentally to AREX28 and multiple-pool Lorentzian fit25. The AREX is a reduced form of Rex and follows a Lorentzian function28, so the same parameters listed in Table 2 is used. Table 3 lists the boundaries of the multiple-pool Lorentzian fit25.
Table 1.
Summary of the parameters for a general exchanging pool i when we conduct Rex and AREX fitting: solute‐water exchange rate (ki), solute concentration (fi), transverse relaxation time (T2,s), and solute resonance frequency offset (Δ).
| Amide | Guanidino | Free water | MT | NOE (− 3.5) | ||
|---|---|---|---|---|---|---|
| ks (s-1) | LB–UB | 1–250 | 1–1000 | – | 1–100 | 1–30 |
| fs (10−3) | 0.1–10 | 1–50 | – | 10–400 | 10–100 | |
| T2,s (10−3 s) | 0.1–10 | 0.1–10 | 20–100 | 0.01–0.3 | 0.1–10 | |
| Δ (ppm) | 3.5 | 2 | 0 | − 2.4 | − 3.5 | |
Table 2.
Pseudo-code of the Rex based method for Z-spectra fitting and decomposition.
| Define a set of LB and UB from Table 1, and start at the point x0 = LB + (UB − LB)/2 |
| The pixel-wise decompositions of Reff and Rex for CEST are solved by nonlinear fitting function (lsqnonlin) in MATLAB |
| Loop for Z-spectra of each pixel |
| { |
| compute Reff and Rex fitting parameters from Eqs. (2) and (3), respectively |
| compute Z-spectra of Rex-line-fit from Eq. (1) |
| } |
| Obtain fitting parameters and reconstruct the Rex imaging from Z-spectra of each pixel |
Table 3.
Summary of the parameters used for Lorentzian fitting: amplitude (A), width (W), and solute resonance frequency offset (Δ).
| Amide | Guanidyl/Amine | Amino | MT | NOE (− 1.6) | NOE (− 3.5) | ||
|---|---|---|---|---|---|---|---|
| A | LB–UB | 0–10 | 0–10 | 0–10 | 0–40 | 0–10 | 0–20 |
| W | 0–3 | 0–3 | 0–3 | 0–35 | 0–3 | 0–10 | |
| Δ (ppm) | 3.6 | 2 | 3 | − 1.5 | − 1.6 | − 3.5 | |
Parameter separation
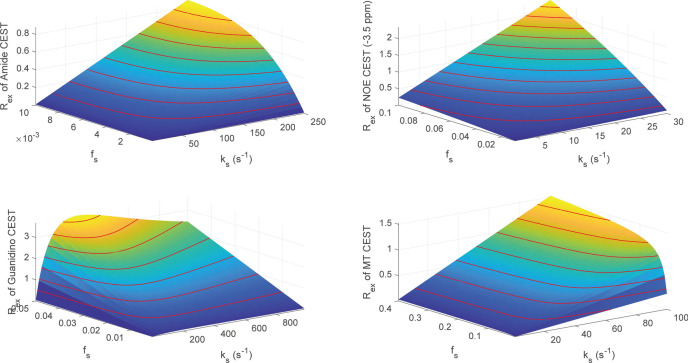
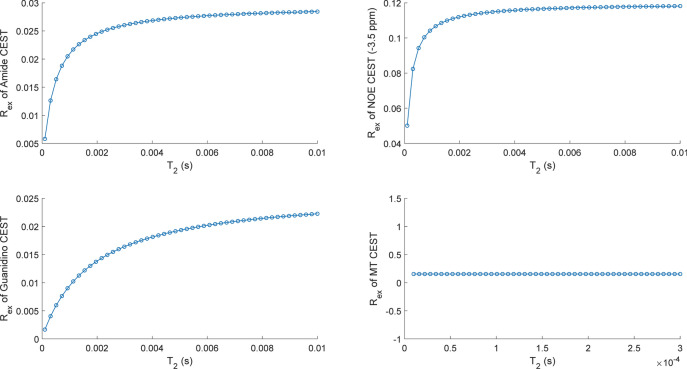
It is worthwhile to evaluate the correlation between Rex and parameters (solute‐water exchange rate ks, solute concentration fs and solute transverse relaxation T2,s), which may assist in elucidating the Rex specificity and separating CEST parameters. For Amide, NOE (− 3.5 ppm), Guanidino and MT, Fig. 2 illustrates the correlations between parameters (ks, fs) and Rex. The surface plots demonstrate the dependence of Rex on ks and fs, where Rex is linear monotonically increasing with parameters (ks, fs) for the Amide, NOE (− 3.5 ppm) and Guanidino. For MT, its Rex is linear monotonically increasing with solute concentration fs, while a nonlinear monotonically increasing relationship between Rex and solute‐water exchange rate ks is observed. It should be noted that the Rex of Guanidino depicts a monotonically increasing trend first and then decrease corresponding to ks, while its Rex follows a monotonically increasing pattern in respect to fs. In addition, Rex is nonlinear monotonically increasing with T2,s for the Amide, NOE (-3.5 ppm) and Guanidino, while Rex shows a trend of slight monotonic decrease corresponding to T2,s for MT, as illustrated in Fig. 3. In addition, Fig. 4 illustrates an example of Rex changing with ks and R2,s (1/T2,s) for Amide, where Rex follows a increasing pattern in respect to R2,s at different ks and Rex shows a trend of decrease corresponding ks at different R2,s.
Fig. 2.
The correlation between Rex and parameters (ks, fs) for Amide, NOE (− 3.5 ppm), Guanidino and MT. For each subplot, the red line denotes the contour.
Fig. 3.
The correlation between Rex and T2,s for Amide, NOE (− 3.5 ppm), Guanidino and MT.
Fig. 4.
An example of Rex changing with ks and R2,s (1/T2,s) for Amide.
Rex, Lorentzian, and AREX imaging
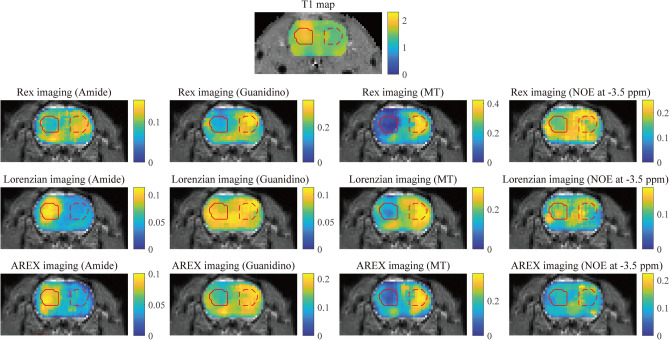
Herein, we conduct an experiment of Rex, Lorentzian and AREX imaging for Amide at 3.5 ppm, Guanidino at 2.0 ppm, MT at − 2.4 ppm and NOE at − 3.5 ppm, where each pixel of imaging is obtained by computing the peaks of Rex and Lorentzian decompositions. Figure 5 illustrates the Rex, Lorentzian and AREX imaging of these CEST effects. The region of pseudo color image overlaid on anatomy image is the region of interest (ROI), where the region of tumor region is marked with solid red contour and the solid red contour denotes the contralateral region. Visually, the Rex shows different structure distributions on the Rex imaging for Amide, Guanidino, MT and NOE, this is different from Lorentzian and AREX.
Fig. 5.
The Rex, Lorentzian and AREX imaging of Amide at 3.5 ppm, Guanidino at 2.0 ppm, MT at − 2.4 ppm and NOE at − 3.5 ppm. The solid red contour denotes the tumor region and the dashed red contour is the contralateral region.
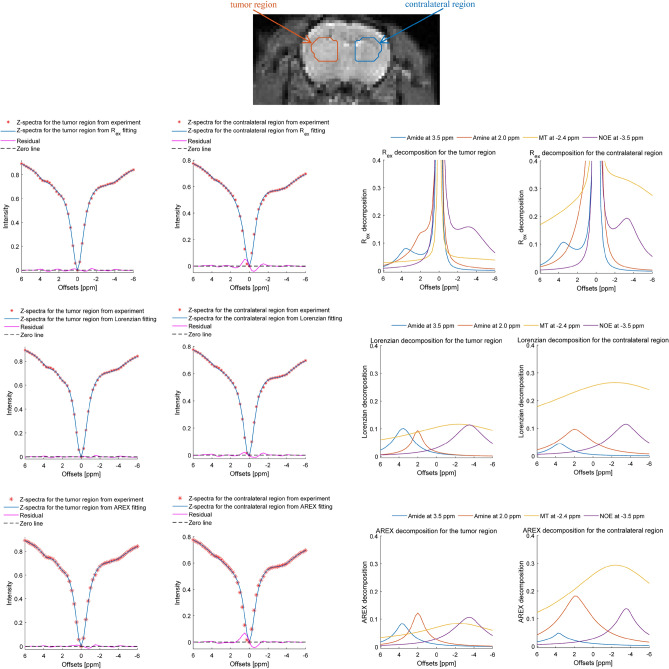
Figure 6 illustrate the Z-spectra fitting from the tumor region and the contralateral region using the Rex, Lorentzian and AREX approach, respectively. The results show that the satisfied accuracy and consistency are obtained by the proposed Rex-line-fit and it displays great agreement and follows the same tendency as the actual measurements. Table 4 lists the mean value and standard deviation of residual between the considered fitting approach and the experimental Z-spectra for the tumor region and its contralateral region.
Fig. 6.
Z-spectra fitting and decomposition from the tumor region and its contralateral region using the Rex, Lorentzian and AREX approaches.
Table 4.
The mean value and standard deviation of residual between the considered fitting approach and the experimental Z-spectra for the tumor region and its contralateral region.
| Residual between Rex fitting and the experimental Z-spectra | Residual between Lorentzian fitting and the experimental Z-spectra | Residual between AREX fitting and the experimental Z-spectra | ||||
|---|---|---|---|---|---|---|
| Mean value | 1.8914 × 10⁻⁴ | 3.8786 × 10⁻⁴ | − 1.3783 × 10⁻⁵ | 1.7531 × 10⁻⁵ | 2.6252 × 10⁻⁵ | 1.2 × 10⁻³ |
| Standard deviation | 0.0054 | 0.0147 | 0.0043 | 0.0070 | 0.0053 | 0.0183 |
| Tumor region | Contralateral region | Tumor region | Contralateral region | Tumor region | Contralateral region | |
We further applied the linear regression analysis29 to assess the general performance of the Rex, Lorentzian and AREX approach using the whole ROI data of CEST images at 49 frequency offsets. Figure 7 displays the Rex, Lorentzian and AREX for fitting CEST signal by plotting the linear regression lines between the experimentally acquired data and the fitting. The excellent performance of our Rex method is confirmed by the scatter and linear regression lines, resulting in a very high coefficient of determination (R2 = 0.9937).
Fig. 7.
Linear regression analysis of the Rex, Lorentzian and AREX fitting when they compared with the experimentally acquired data within the ROI.
Discussion
The exchange-dependent relaxation Rex is an important parameter for CEST effects and can be used to determine the exchange rate ks of the exchangeable protons with concentration fraction fs and transverse relaxation T2,s. In this study, we proposed a method that can support reliable quantitative separation of CEST effect by Rex. This is important because specificity of in vivo CEST effect is challenging due to careful measurement of the CEST effects. Nevertheless, some discussions should be made as follows.
In the Eq. (4) of Rex, the first term named ‘ki-term’ is the dominant factor, which comprises the product of peaks for water pool (‘a-peak’) and CEST pool (‘b-peak’), respectively. The ‘R2,i-term’, together with the ‘’, denotes the exchange dependent relaxation that yields an off-resonant peak in CEST. So the Rex turns into two peaks, but unlike Lorentzian and AREX lineshape that gives only one peak. In fact, the effect of water T1 and T2 relaxation time on Lorentzian shape is described by formula in Ref.17. In contrast, Rex excludes water T1 and T2 contributions, which serves as a tool for calculating the CEST signal, offering a more representative depiction of chemical exchange processes than traditional CEST analysis methods30,31. As a reduced form of Rex, AREX is a Lorentzian function28, excluding the water pool (‘a-peak’), unlike the complete Rex expression2,28. It is interesting to study the ‘a-peak’ imaging, which will be presented in our next work.
In the Rex imaging, the tumor regions marked with solid red contour show reduced values in correspondence with the contralateral regions (Fig. 5). In practice, the exchange rate ki can be determined by analyzing the CEST signal as a function of pH: kamide = 5.57 × 10pH–6.4, kguanidyl = 5.57 × 10pH–6.432. An intuitive explanation is that the reduced exchange rate with lower pH in and around the tumor region causes the lowering of the Rex peak values (Fig. 6). In fact, the mechanism behind tumors is more complex compared with the clear process of stroke. Particularly, the Rex mechanism is considered that many factors (the exchange rate ks, the concentration fraction fs and transverse relaxation T2,s) participated in this process (Eq. 4). To some extent, the Rex imaging shows the specificity for different chemical groups, because different structure distributions on the Rex imaging for Amide, Guanidino, MT and NOE are obtained, this is different from multiple-pool Lorentzian, AREX and T1 map (Fig. 5). Nevertheless, some multi-pool models have been applied to tumor research, such as Refs.33,34.
In this study, we have made some meaningful explorations and obtained promising research results. We first determined whether parameters (solute‐water exchange rate and solute concentration) and Rex have a monotonous relationship for Amide at 3.5 ppm, Guanidino at 2.0 ppm and NOE at − 3.5 ppm (Figs. 2, 3, 4). With this knowledge in mind, this makes it possible to isolate some part parameters by extending previous approaches, where numerical simulations of Rex can be used to obtain saturation parameters for CEST effect.
We further implemented Rex as a novel model to provide high-accuracy CEST fitting and decomposition where multiple CEST saturation transfer pools are present. The proposed Rex-line-fit avoids specific selection of tissue parameters and minimizes operator bias, enabling adaptive fitting and decomposition for reliable estimation of CEST effects. The accuracy of Rex-line-fit was first validated by the test of in vivo mouse, which revealed that Rex method provided a near-perfect approximation to the experimentally acquired Z-spectra (Table 4, Figs. 6 and 7).
Conclusion
As an improvement method that only is dependent of the specific parameters (solute concentration, solute‐water exchange rate, solute transverse relaxation, and irradiation power), our Rex-line-fit can provide a simple, robust and more accurate approach for approximating CEST and further serve for quantitative separation of CEST effect. More in vivo validations and at the clinical field strength will be performed in the future.
Author contributions
GX: Conceptualization, Methodology, Software; X.-L.Z: Methodology, Formal analysis, Investigation, Validation, Visualization, Writing – original draft; S.-Q.W: Formal analysis, Data curation; S.-X.L: Formal analysis, Data curation; T.-T.N: Resources, Data curation; Y.-W.C: Investigation, Supervision; C.-Y.Z: Resources, Data curation; GY: Investigation, Supervision, Writing – review & editing; R.-H.W: Funding acquisition, Project administration, Writing – review & editing.
Funding
The study was supported by the National Natural Science Foundation of China (Grant/Award Number: 82020108016), the Grant for Key Disciplinary Project of Clinical Medicine under the Guangdong High-Level University Development Program (Grant/Award Number: 002-18120302), the Functional Substances in Medicinal Edible Resources and Healthcare Products (Grant/Award Number: 2021B1212040015), the 2021 Medical Research Foundation of Guangdong (Grant/Award Number: 202011102275838), the 2021 Grant for Key Science Technology and Innovation Project under the Guangdong Jieyang Development Program (Grant/Award Number: 210517084612609), and the Medical Health Science and Technology Project of Shantou (Grant/Award Number: 2022-88-16).
Data availability
The datasets used and/or analysed during the current study available from the corresponding author on reasonable request.
Competing interests
The authors declare no competing interests.
Footnotes
Publisher's note
Springer Nature remains neutral with regard to jurisdictional claims in published maps and institutional affiliations.
These authors contributed equally: Gang Xiao and Xiao-Lei Zhang.
Contributor Information
Gen Yan, Email: gyan@stu.edu.cn.
Ren-Hua Wu, Email: cjr.wurenhua@vip.163.com.
References
- 1.Kogan, F., Hariharan, H. & Reddy, R. Chemical exchange saturation transfer (CEST) imaging: Description of technique and potential clinical applications. Curr. Radiol. Rep.1, 102–114 (2013). 10.1007/s40134-013-0010-3 [DOI] [PMC free article] [PubMed] [Google Scholar]
- 2.Zaiss, M. & Bachert, P. Chemical exchange saturation transfer (CEST) and MR Z-spectroscopy in vivo: A review of theoretical approaches and methods. Phys. Med. Biol.58(22), R221 (2013). 10.1088/0031-9155/58/22/R221 [DOI] [PubMed] [Google Scholar]
- 3.El Mamoune, K. et al. Application of chemical exchange saturation transfer (CEST) in neuroimaging. J. Chem. Neuroanat.114, 101944 (2021). 10.1016/j.jchemneu.2021.101944 [DOI] [PubMed] [Google Scholar]
- 4.Zaiss, M. et al. Theory of chemical exchange saturation transfer MRI in the context of different magnetic fields. NMR Biomed.35(11), e4789 (2022). 10.1002/nbm.4789 [DOI] [PubMed] [Google Scholar]
- 5.Van Zijl, P. C. & Yadav, N. N. Chemical exchange saturation transfer (CEST): What is in a name and what isn’t?. Magn. Reson. Med.65(4), 927–948 (2011). 10.1002/mrm.22761 [DOI] [PMC free article] [PubMed] [Google Scholar]
- 6.Song, X. et al. CEST phase mapping using a length and offset varied saturation (LOVARS) scheme. Magn. Reson. Med.68(4), 1074–1086 (2012). 10.1002/mrm.23312 [DOI] [PMC free article] [PubMed] [Google Scholar]
- 7.Liu, G. et al. Nuts and bolts of chemical exchange saturation transfer MRI. NMR Biomed.26(7), 810–828 (2013). 10.1002/nbm.2899 [DOI] [PMC free article] [PubMed] [Google Scholar]
- 8.Pankowska, A. et al. Chemical exchange saturation transfer (CEST) as a new method of signal obtainment in magnetic resonance molecular imaging in clinical and research practice. Pol. J. Radiol.84, e147 (2019). 10.5114/pjr.2019.84242 [DOI] [PMC free article] [PubMed] [Google Scholar]
- 9.Zhang, L. et al. Voxel-wise Optimization of Pseudo Voigt Profile (VOPVP) for Z-spectra fitting in chemical exchange saturation transfer (CEST) MRI. Quant. Imaging Med. Surg.9(10), 1714 (2019). 10.21037/qims.2019.10.01 [DOI] [PMC free article] [PubMed] [Google Scholar]
- 10.Liu, Y. et al. Dual-Peak Lorentzian CEST MRI for antiretroviral drug brain distribution. Neuroimmune Pharmacol. Therap.2(1), 63–69 (2023). [DOI] [PMC free article] [PubMed] [Google Scholar]
- 11.Windschuh, J. et al. Correction of B1-inhomogeneities for relaxation-compensated CEST imaging at 7 T. NMR Biomed.28(5), 529–537 (2015). 10.1002/nbm.3283 [DOI] [PubMed] [Google Scholar]
- 12.Desmond, K. L., Moosvi, F. & Stanisz, G. J. Mapping of amide, amine, and aliphatic peaks in the CEST spectra of murine xenografts at 7 T. Magn. Reson. Med.71(5), 1841–1853 (2014). 10.1002/mrm.24822 [DOI] [PubMed] [Google Scholar]
- 13.Cai, K. et al. CEST signal at 2 ppm (CEST@ 2 ppm) from Z-spectral fitting correlates with creatine distribution in brain tumor. NMR Biomed.28(1), 1–8 (2015). 10.1002/nbm.3216 [DOI] [PMC free article] [PubMed] [Google Scholar]
- 14.Bade, A. N. et al. Chemical exchange saturation transfer for detection of antiretroviral drugs in brain tissue. Aids35(11), 1733–1741 (2021). 10.1097/QAD.0000000000002960 [DOI] [PMC free article] [PubMed] [Google Scholar]
- 15.Tietze, A. et al. Assessment of ischemic penumbra in patients with hyperacute stroke using amide proton transfer (APT) chemical exchange saturation transfer (CEST) MRI. NMR Biomed.27(2), 163–174 (2014). 10.1002/nbm.3048 [DOI] [PMC free article] [PubMed] [Google Scholar]
- 16.Zhang, X. Y. et al. Accuracy in the quantification of chemical exchange saturation transfer (CEST) and relayed nuclear Overhauser enhancement (rNOE) saturation transfer effects. NMR Biomed.30(7), e3716 (2017). 10.1002/nbm.3716 [DOI] [PMC free article] [PubMed] [Google Scholar]
- 17.Zaiß, M., Schmitt, B. & Bachert, P. Quantitative separation of CEST effect from magnetization transfer and spillover effects by Lorentzian-line-fit analysis of z-spectra. J. Magnet. Resonance211(2), 149–155 (2011). 10.1016/j.jmr.2011.05.001 [DOI] [PubMed] [Google Scholar]
- 18.Glang, F. et al. DeepCEST 3T: Robust MRI parameter determination and uncertainty quantification with neural networks—Application to CEST imaging of the human brain at 3T. Magnet. Resonance Med.84(1), 450–466 (2020). 10.1002/mrm.28117 [DOI] [PubMed] [Google Scholar]
- 19.Wu, Y. et al. 3D APT and NOE CEST-MRI of healthy volunteers and patients with non-enhancing glioma at 3 T. Magnet. Resonance Mater. Phys. Biol. Med.35(1), 63–73 (2022). 10.1007/s10334-021-00996-z [DOI] [PMC free article] [PubMed] [Google Scholar]
- 20.Cui, J., Sun, C. & Zu, Z. NOE-weighted imaging in tumors using low-duty-cycle 2π-CEST. Magnet. Resonance Med.89(2), 636–651 (2023). 10.1002/mrm.29475 [DOI] [PMC free article] [PubMed] [Google Scholar]
- 21.Zhao, Y., Sun, C. & Zu, Z. Assignment of molecular origins of NOE signal at − 3.5 ppm in the brain. Magnet. Resonance Med.90(2), 673–685 (2023). 10.1002/mrm.29643 [DOI] [PMC free article] [PubMed] [Google Scholar]
- 22.Cui, J. et al. Evaluation of contributors to amide proton transfer–weighted imaging and nuclear Overhauser enhancement–weighted imaging contrast in tumors at a high magnetic field. Magnet. Resonance Med.90(2), 596–614 (2023). 10.1002/mrm.29675 [DOI] [PMC free article] [PubMed] [Google Scholar]
- 23.Chen, L. et al. Creatine and phosphocreatine mapping of mouse skeletal muscle by a polynomial and Lorentzian line-shape fitting CEST method. Magnet. Resonance Med.81(1), 69–78 (2019). 10.1002/mrm.27514 [DOI] [PMC free article] [PubMed] [Google Scholar]
- 24.Carradus, A. J. et al. Measuring chemical exchange saturation transfer exchange rates in the human brain using a particle swarm optimisation algorithm. NMR Biomed. 36(11), e5001 (2023). 10.1002/nbm.5001 [DOI] [PubMed] [Google Scholar]
- 25.Cui, J., Afzal, A. & Zu, Z. Comparative evaluation of polynomial and Lorentzian lineshape-fitted amine CEST imaging in acute ischemic stroke. Magnet. Resonance Med.87(2), 837–849 (2022). 10.1002/mrm.29030 [DOI] [PMC free article] [PubMed] [Google Scholar]
- 26.Khlebnikov, V. et al. On the transmit field inhomogeneity correction of relaxation-compensated amide and NOE CEST effects at 7 T. NMR Biomed.30(5), e3687 (2017). 10.1002/nbm.3687 [DOI] [PMC free article] [PubMed] [Google Scholar]
- 27.Xiao, G. et al. Deep learning to reconstruct quasi-steady-state chemical exchange saturation transfer from a non-steady-state experiment. NMR Biomed. 36(9), e4940 (2023). 10.1002/nbm.4940 [DOI] [PubMed] [Google Scholar]
- 28.Zhang, X. Y. et al. Increased CEST specificity for amide and fast-exchanging amine protons using exchange-dependent relaxation rate. NMR Biomed.31(2), e3863 (2018). 10.1002/nbm.3863 [DOI] [PMC free article] [PubMed] [Google Scholar]
- 29.Li, Y. et al. Accelerating GluCEST imaging using deep learning for B0 correction. Magnet. Resonance Med.84(4), 1724–1733 (2020). 10.1002/mrm.28289 [DOI] [PMC free article] [PubMed] [Google Scholar]
- 30.Zaiss, M. et al. Inverse Z-spectrum analysis for spillover-, MT-, and T1-corrected steady-state pulsed CEST-MRI-application to pH-weighted MRI of acute stroke. NMR Biomed.27(3), 240–252 (2014). 10.1002/nbm.3054 [DOI] [PMC free article] [PubMed] [Google Scholar]
- 31.Zaiss, M. et al. Relaxation-compensated CEST-MRI of the human brain at 7 T: Unbiased insight into NOE and amide signal changes in human glioblastoma. Neuroimage112, 180–188 (2015). 10.1016/j.neuroimage.2015.02.040 [DOI] [PubMed] [Google Scholar]
- 32.Jin, T. et al. Enhancing sensitivity of pH-weighted MRI with combination of amide and guanidyl CEST. Neuroimage157, 341–350 (2017). 10.1016/j.neuroimage.2017.06.007 [DOI] [PMC free article] [PubMed] [Google Scholar]
- 33.Zhou, I. Y. et al. Quantitative chemical exchange saturation transfer (CEST) MRI of glioma using Image Downsampling Expedited Adaptive Least-squares (IDEAL) fitting. Sci. Rep.7(1), 84 (2017). 10.1038/s41598-017-00167-y [DOI] [PMC free article] [PubMed] [Google Scholar]
- 34.Rivlin, M. et al. Breast cancer imaging with glucosamine CEST (chemical exchange saturation transfer) MRI: First human experience. Eur. Radiol.32(11), 7365–7373 (2022). 10.1007/s00330-022-08772-w [DOI] [PubMed] [Google Scholar]
Associated Data
This section collects any data citations, data availability statements, or supplementary materials included in this article.
Data Availability Statement
The datasets used and/or analysed during the current study available from the corresponding author on reasonable request.


