Abstract
Purpose
The use of nanotechnology in medicine has gained attention in developing drug delivery systems. GO has the potential to deliver microRNA (miRNA) mimics or antisense structures. MiRNAs regulate gene expression and their dysregulation is implicated in diseases, including cancer. This study aims to observe changes in morphology, viability, mRNA expression of mTOR/PI3K/Akt and PTEN genes in U87, U118, U251, A172 and T98 glioblastoma cells and xenograft models after GO self-assembly with mimic miRNA-7.
Methods
Colloidal suspension of graphene oxide (GO) was used for obtaining the GO-mimic miRNA-7 nanosystems by self-assembly method. The ultrastructure, size distribution and ATR-FTIR and UV-Vis spectrum were analyzed. The Zeta potential was measured to verify the stability of obtained nanosystem. The entrapment efficiency, loading capacity and released kinetics of mimic miRNA-7 form GO-mimic miRNA-7 nanosystems were analyzed. The transfection efficiency into the glioblastoma cell lines U87, U118, U251, A172 and T98 of mimic miRNA-7 delivered by GO nanosystems was measure by confocal microscopy and flow cytometry. The changes at mRNA expression level of mTOR, PI3K, AKT1 and PTEN genes was measured by qPCR analysis. The xenograft model of U87 and A172 tumour tissue was performed to analyze the effect at tumor size and volume after GO- mimic miRNA-7 nanosystem administration.
Results
The ultrastructure of GO-mimic miRNA-7 nanosystems showed high affinity of mimic miRNA into the GO. The results of transfection efficiency, cell morphology and viability showed that GO -miRNA-7 effectively deliver mimics miRNA-7 into U87, U118, U251, A172 and T98 glioblastoma cells. This approach can reverse miRNA-7 expression’s downstream effects and target the mTOR PI3K/Akt pathway observed at gene expression level, reducing xenograft tumour size and volume.
Conclusion
The findings of the study could have significant implications for the development of advanced and precise GO based nanosystems specifically designed for miRNA therapy in cancer treatment.
Keywords: GO, micro-RNA, cancer, mTOR/PI3K/Akt
Introduction
Graphene oxide (GO) has garnered significant attention in recent years, owing to its unique properties such as high mechanical strength, electrical conductivity, and surface area, which make it a promising material for various applications in electronic, biomedical, and environmental fields. As a nanomaterial, GO is a monolayer of graphite sheet characterized by sp2 hybridization of carbons and the presence of oxygenated functional groups resulting from the processes of oxygenation and exfoliation.1 The colloidal stability of GO is affected by the percentage of C-O and C = O bonds in its structure. The presence of carboxylic groups located on the edges and basal-located epoxide and hydroxyl groups of GO flakes increased its hydrophilicity. Additionally, GO has exceptional properties such as a 2D planar structure, a large surface area, easy modification, and chemical stability.2,3 GO via π-π stacking can interact with chemical compounds or biomolecules, but also it can be the result of electrostatic forces, and covalent or hydrogen bonding. The GO 2D structure and large surface area affect its high loading capacity which increases the effectiveness of miRNA carrying and its stability. This unique physicochemical and mechanical properties of GO point out its potential as a miRNA delivery system.
MiRNAs are a class of small RNA molecules that play a crucial role in the post-transcriptional repressors of gene expression in eukaryote cells. These molecules are typically around 21–25 nucleotides in length and are considered non-coding RNAs because they do not encode proteins.4 The biogenesis of miRNA is a multi-step process that involves enzyme activation within the cell nucleus. Once produced, the miRNA is transported to the cytoplasm by Exportin-5 and undergoes processing by Dicers, transforming into a short double-stranded RNA molecule referred to as the guide strand. The RISC complex, or RNA-induced silencing complex, then utilizes the guide strand to target mRNA by pairing it with the mRNA’s 3’ untranslated region. This interaction can ultimately lead to the degradation of the mRNA or the inhibition of its translation, ultimately resulting in the downregulation of gene expression. Depending on its sequence miRNAs play a crucial role in various biological processes, including development, cell differentiation, apoptosis, and immune responses. Their dysregulation has been implicated in a wide range of diseases, including cancer, where they can act as oncogenes or tumour suppressors.
At glioma one of dysregulated miRNAs is miRNA-7. MiRNA-7, or hsa-miRNA-7, is a small RNA molecule found in various species, including humans. It is derived from three precursors encoded by genes located on chromosomes 9q21, 15q26, and 19q13. MiR-7-5p was thought to be the only biologically relevant mature miRNA from these precursors, other significant miRNAs, including miR-7-1-3p and miRNA-7-2-3p, have also been identified. MiR-7 is known to play a critical role in the development of the central nervous system (CNS), and recent research has also highlighted its significance in the progression of glioblastoma (GB). Multiple studies have reported a significant decrease in the levels of miR-7 in GB tissues.5 The results provided by Jia et al, showed not only a reduction in miR-7 levels in a temozolomide (TMZ)-resistant cell line but also the correlation between the miR-7 and GB resistance to TMZ.6 The exposition of GB cells also TMZ-resistant type of GB cells to miR-7 caused decreased tumour proliferation and partly confirmed that this miRNA sequence acts as a critical regulator of gene expression and signalling pathways involved in GB pathogenesis.7
One of the initial targets of miR-7 that has been extensively studied is the Epidermal Growth Factor Receptor (EGFR). The activity of miR-7 causes a reduction in the expression of EGFR protein. EGFR plays a vital role in various pathways that stimulate cell growth, including PI3K/Akt and MAPK. The downregulation of these pathways leads to a decrease in the activation of Akt and ERK1/2. MiR-7 targets various other proteins that are involved in downstream signalling pathways. For instance, in the PI3K/Akt pathway, miR-7 targets Akt pathway regulators IRS-1 and IRS-2, PI3K subunits PIK3R3 and PIK3CD, mTOR, and PAK1 (p21/Cdc42/Rac1-activated kinase).8 Abnormal activation of the PI3K/Akt pathway has been linked to tumorigenesis, cell proliferation, growth, apoptosis evasion, invasion, metastasis, epithelial-mesenchymal transition (EMT), acquisition of stem-like characteristics, modulation of the immune microenvironment, and development of drug resistance.9 The PI3K/Akt pathway found in cancer cells is responsible for promoting cell survival, growth, and proliferation by activating downstream signalling cascades that are involved in protein synthesis, glucose metabolism and cell cycle progression. The PI3K/Akt pathway also plays a role in regulating the expression of genes involved in angiogenesis, which is essential for tumour growth and metastasis.10 Moreover, the PI3K/Akt pathway has been implicated in the regulation of apoptosis. Akt activation can suppress apoptosis by inhibiting pro-apoptotic proteins and promoting the expression of anti-apoptotic proteins. Furthermore, the PI3K/AKT/mTOR pathway, a critical downstream pathway of EGFR, is closely associated with cell proliferation, survival, and motility/metastasis.11 Understanding the role of the PI3K/Akt pathway in cancer is crucial for developing targeted therapeutic strategies. One of the negative PI3K/AKT signalling pathway regulators is the Phosphatase and Tensin Homolog (PTEN) gene. Its expression is regulated by transcription factors and is responsible for encoding a tumour suppressor protein, which is known to be altered in various types of cancer.12 PTEN primarily acts as a lipid phosphatase against the phospholipid product of PI3Ks, making it a crucial tumour suppressor. Additionally, PTEN plays an important role in various cellular compartments, such as the nucleus, cytoplasmic organelles, and extracellular compartment. The expression of the PTEN gene is regulated through multiple mechanisms, including transcriptional, post-transcriptional, and post-translational levels.13 Epigenetic marks such as methylation and histone modifications and several microRNAs (miRNAs) can regulate PTEN expression post-transcriptionally. Upregulated miR-7 inhibited proliferation, cell cycle progression, invasion, migration and PCNA expression while inducing apoptosis of cancer cells and tumour growth.14
However, there are several limitations of mimic miRNA usage in the treatment of cancer patients. One major challenge is effectively delivering miRNA antagonists or mimics to the target tumour tissue. Tumours have a leaky structure and compress abnormal blood vessels, resulting in poor blood perfusion. One of the major limitations is the susceptibility of miRNA delivery systems to immune activation. Studies in animals and human patients have noted immune responses against miRNA delivery systems. The MRX32, a mimic microRNA-34a encapsulated in liposomes was the first microRNA cancer therapy that reach the Phase I clinical trials with positive outcomes, but because of immune reaction the trial was terminated.15 Thus, the choice of delivery system plays a critical role in the success of miRNA delivery. Various delivery systems such as liposomes, polymer nanoparticles, and viral vectors, have been explored. However, each system has its limitations, including potential toxicity, limited stability, and immunogenicity. To overcome these limitations, ongoing research aims to develop more efficient and targeted delivery systems for miRNA therapy. The results published by Kutwin et al16 showed that GO can be used as an efficient miRNA delivery nanosystem into GB cells with limited immune reactivity. Strategies such as GO-based nanosystems for improving the stability, targeting capabilities, enhancing the penetration of miRNAs into tumour tissue and minimizing immune activation are intensively investigated to optimize miRNA delivery into cancer cells and tissue. Every delivery system must display a high level of biocompatibility. This not only ensures the safety of the patient but also guarantees that the gene therapy is effective. The biocompatibility of GO depends on various physical properties such as lateral dimensions, thickness, stiffness, and surface characteristics. These factors play a crucial role in determining the safety and effectiveness of GO, especially in biomedical applications. According to Castagnola et al,17 GO showed good biocompatibility in vitro and did not negatively affect the integrity and functionality of the blood-brain barrier. Furthermore, long-term retention of GO after i.p. administration in mice did not cause general toxicity or abnormalities in biochemistry and whole blood parameters.18 Compared to other carbon allotropes like multi-walled carbon nanotubes (MWNTs), GO did not cause, in mice, the formation of granulomas, which is a clusters of white blood cells and other tissues that form in response to infection, inflammation, irritation, or the presence of foreign objects.18 Multiple intraperitoneal injections of GO in rats did not show increased levels of inflammation, necrosis, or tissue reaction in the injection area. The rats’ excised organs, feed intake, and body gain after GO administration did not exhibit any abnormalities.19 These findings suggest that the in vivo behaviour and toxicological effects of GO depend on factors like their surface coatings, size, administration routes, and, most importantly, their intended use. Based on previous studies indicating that overexpression of miR-7 inhibits the Akt pathway in GB, we tested whether miR-7 could regulate GB cell activity through interactions with the PI3K/AKT/mTOR pathway and suppress tumour growth. We hypothesize that GO-based nanosystems can effectively deliver miRNA-7 mimics into GB cancer cells and tissue to reverse the downstream effects of miRNA-7 expression and target the mTOR/PI3K/Akt pathway and PTEN gene expression level, ultimately reducing cancer cell viability. Therefore, a key question arises regarding how GO-based nanosystems mimic- miRNA-7 can influence the biological structure of GB and target the PI3K/Akt pathway but PTEN activity The aim of this studies is to observe changes in GB macrostructure, cell morphology and viability, mRNA expression levels of PI3K/Akt and PTEN genes, as well as the physicochemical features of GO after self-assembly with mimic miRNA-7.
Materials and Methods
Nanosystems
Graphene Oxide
Graphene oxide (GO) (purity 99.99%) suspension was purchased from Nanopoz (Poznan, Poland) and dispersed in ultrapure water to prepare a final concentration of stock solution: 1.0 mg/mL.
For in vitro investigation, the GO stock solution was diluted to different concentrations with 1× Dulbecco’s modified Eagle’s culture medium (Sigma-Aldrich, St Louis, MO, USA) immediately before exposure to cells.
Synthesis of Graphene Oxide - Mimics miRNA-7 nanosystems
Hydrocolloid of GO at a concentration of 100 μg/mL and sequence of mimic hsa-miRNA-7-5p (UGGAAGACUAGUGAUUUUGUUGU; MI0000264, Sigma-Aldrich, USA) at a concentration of 5 pmol/mL was used to prepare the GO-mimic miRNA-7 nanosystem. To obtain the GO-mimic miRNA-7 nanosystem, 50 mL of GO was sonicated for 30 minutes before usage in glass flask. Next, the mimic miRNA-7 sequence was added to the GO hydrocolloids to obtain the 5 pmol/mL final concentration of mimic miRNA-7. GO hydrocolloid mixed with mimic miRNA-7 was sonicated for 30 minutes in 50 mL glass flask for self-assembly coating GO nanosheets with mimic has-miRNA-7. The mixture was incubated on ice for 1 h and centrifuged at 10,000 x g; then, the supernatant was removed. After shaking at 200 rpm and overnight incubation at 4°C, the GO-mimic miRNA-7 nanosystem was used to evaluate its physicochemical and biological properties.
Ultrastructure Observation of GO, Mimic miRNA-7 and GO-Mimic miRNA-7 Nanosystem by Transmission Electron Microscopy, Scanning Transmission Electron Microscopy and Scanning Electron Microscopy
The ultrastructure including the size and shape observations of the GO, mimic miRNA-7, and GO-miRNA-7 were inspected using a transmission electron microscope (TEM), scanning transmission electron microscopy (STEM) and scanning electron microscopy (SEM). The ultrastructure of GO and GO-miRNA-7 was inspected using a transmission electron microscopy (TEM; JEOL JEM-1220, JEOL Ltd., Tokyo, Japan) at 80 KeV equipped with an 11-megapixel camera (Morada TEM, Olympus Corporation, Tokyo, Japan) and scanning transmission electron microscope (Quanta 250 FEG, STEM, FEI, Hillsboro, OR, USA) at 10KeV equipped with camera. The hydrocolloids of GO and GO-mimic miRNA-7 were prepared by placing droplets of it onto Formvar-coated copper grids (Agar Scientific Ltd., Stansted, UK) and air drying before TEM or STEM imaging. The same procedures were followed for SEM observation, except that the Formvar-coated copper grids were deposited onto the SEM aluminum tubes for SEM observations.
Attenuated Total Reflectance–Fourier Transform Infrared (ATR–FTIR) Spectrometry
GO, GO-mimic miRNA-7 nanosystems were analysed by FTIR spectroscopy (Nicolet IS50, FTIR, ThermoFisher SCIENTIFIC, Waltham, MA, USA. Each side of samples were measured using ATR (total internal reflection) in a range of 400–4000 cm-1, with a resolution of 4 cm-1 and 64 scans in number. This spectrum allowed the observation of the functional groups of GO. The measurements were taken three times.
Dynamic Light Scattering and ZEA (ζ) Potentials
For analysis of particle sizes and electrokinetic potential the particle size analyser (Zetasizer ZSP, Malvern Instrument Ltd., Worcestershire, UK) was used. Before conducting the DLS and ζ-potential measurement, the GO, GO-mimic miRNA, and mimic miRNA-7 were subjected to ultrasonication for 30 minutes. All measurements were performed in triplicate.
The laser Doppler velocimetry and dynamic light scattering (DLS) techniques was used for obtained the size distribution results.
The Smoluchowski approximation was employed to evaluate the electrokinetic potential (ζ-potential) of hydrocolloid of GO, mimic miRNA-7, and GO- mimic miRNA-7 nanosystem. Each sample was measured after stabilization at 25°C for 120 s. All measurements were performed in triplicate.
UV-Visible GO, Mimic miRNA-7 and GO-Mimic miRNA-7 Nanosystem Analysis
UV-Vis spectroscopy is a commonly employed technique to non-destructively characterize nanomaterials. In a hydrocolloid sample, the transmittance of electromagnetic radiation with a wavelength between 180 and 1100 nm was measured using UV-Vis analysis. The measured light transmittance was then converted to an absorbance measurement using the Beer-Lambert law equation:
C=A/(ε × b)
Abbreviation: A -concentration of miRNA; ε - extinction coefficient; b- path length of the cuvette. The NanoDrop 2000 spectrophotometry instrument manufactured by Thermo Scientific in Wilmington, DE, USA, was used to measure the UV-Vis of the samples. The samples were measured three times to ensure accuracy. The absorbance was calculated by dividing the intensity of the evaluated sample of GO, mimic miRNA-7, or GO-mimic miRNA-7 nanosystem by the intensity of a reference sample (RNA-free water).
Mimic miRNA-7 Concentration in GO Nanosystems
The Entrapment Efficiency (EE)
The entrapment efficiency (EE) of miRNA in GO nanosystems was calculated using the following equation (1):
 |
The measurement of mimic miRNA-7 concentration in GO- mimic miRNA-7 nanosystem was established using a spectrophotometry instrument (NanoDrop 2000, Thermo Scientific, Wilmington, DE, USA). Next, for the calculation of mimic miRNA-7 concentration according to the Beer’s Law was established based on equation:
C=A/(ε × b)
Abbreviation: A -concentration of miRNA; ε - extinction coefficient; b- path length of the cuvette. The sample was measured in triplicate.
Loading Capacity
For determination of the loading capacity of GO-mimic miRNA-7 nanosystem the gel electrophoresis method was used. GO-mimic miRNA-7 before and after centrifuged for 30 minutes (3000 x g), as well as free mimic miRNA-7 were investigated for loading capacity. 10 μL of each inspected samples were mixed with 5 μL of 2 × RNA loading buffer (R0641, Thermo Scientific, Wilmington, DE, USA). The RNA ladder (SM1833, Thermo Scientific, Wilmington, DE, USA) was used as marker. Samples were applied to ethidium bromide-containing agarose gel (2%) electrophoresis for 40 minutes at 80 V to determine the mimic miRNA-7 loading by GO. The gel images were visualized using Azure Biosystem C400 (Azure, USA) after UV exposure and the pixel density were analyzed using the ImageJ software.
Mimic miRNA-7 Release Kinetics from GO- Mimic miRNA-7 Nanosystem
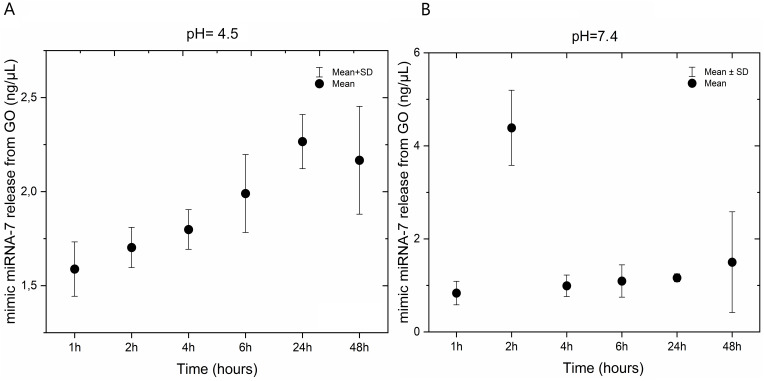
PBS pH 7.4 and PBS pH 4.5 was added to air dried in sterile conditions nanofilm of GO- mimic miRNA-7 nanosystem, were shaken at 300 rpm at 37°C. The concentration of mimic miRNA-7 released form GO- mimic miRNA-7 nanosystem was measured by Nanodrop One (Thermo Fisher Scientific, Waltham, MA) at 260nm wavenumber. Each measurement was done at 100 μL mixture of PBS (pH 7.4 or pH 4.5). Fresh PBS with different pH levels was added to the collected samples in order to obtain equal volumes of each sample. The samples were then subjected to rotary shaking before the next measurement was taken. After incubating the samples at 37°C for 1, 2, 4, 6, 24, and 48 hours, the percentage cumulative release was plotted against time.
Cell Cultures and Treatments
Cell Culture
Glioblastoma GB cell lines U87 (HTB-14), U118 (HTB-15), U251, A172 (CRL-1620) and T98 (CRL-1690) used in this study were obtained from the American Type Culture Collection (Manassas, VA, USA) and maintained in Dulbecco’s Modified Eagle’s Medium supplemented with 10% foetal bovine serum (Sigma-Aldrich) and 1% penicillin and streptomycin (Sigma-Aldrich) at 37°C in a humidified atmosphere of 5% CO2 / 95% air in an air-jacketed CO2 incubator (NuAire DH AutoFlow, Plymouth, MN, USA).
Cell Morphology
A morphology investigation of U87, U118, U251, A172 and T98 GB after treatment with GO at concentrations 5.0, 10.0, 25.0, 50.0 and 100.0 µg/mL was conducted. Cells were seeded onto 6-well plates at a density of 1×10⁵ cells per well. After 24 hours of incubation with different concentrations of GO, cells were stained using the May Grünwald-Giemsa method (MGG). MGG staining protocol was followed: Cell fixation with 4% paraformaldehyde for 20 minutes, and then May-Grunwald (MG80, Sigma-Aldrich) solution was added to the cell for 5 minutes. Next, the PBS buffer solution (Sigma-Aldrich) with a pH of 6.8 was added for 1 minute. The samples were washed with PBS triplicated and then the Giemsa (GS500, Sigma-Aldrich) solution was added for 10 minutes, followed by a 10-second wash with pH-neutral water. For the detection of cell morphology, the optical microscope (DM750; Leica Microsystems GmbH, Wetzlar, Germany) using the software package LAS EZ version 2.0 was used. The number of repetitions was three for each sample.
Cell Viability Assay
The U87, U118, U251, A172, and T98 glioblastoma cell lines viability was detected by using a 2.3-bis-(2-methoxy-4-nitro-5-sulfophenyl)-2H-tetrazolium-5-carboxyanilide salt (XXT)-based cell viability assay kit (Life Technologies, Taastrup, Denmark). Before the viability assessment, the investigated cell lines were cultured in 96-well plates at a density of 5×10³ cells/well. Next the hydrocolloids of GO were added to each well at 5.0, 10.0, 25.0, 50.0 and 100.0 µg/mL concentrations. Following a 24-hour incubation period with GO, a 100 µL volume of XTT solution was added individually to each well. The plate contained cells that were treated with GO and after the addition of XTT salt, it was incubated for 3 hours at 37°C. Next the optical density (OD) of each well was measured at 450 nm using spectrophotometer (Infinite M200, Tecan, Durham, NC, USA). Cell viability was expressed as a percentage (ODtest - ODblank)/ (ODcontrol - ODblank), where “ODtest” is the OD of cells exposed to GO, “ODcontrol” is the OD of the control sample and “ODblank” is the OD of wells without cancer cells.
GO-Mimic miRNA-7 Nanosystems Treatment of Glioblastoma Cell Lines
To obtain the GO-mimic miRNA-7 nanosystems, the 100 µg/mL concentration of GO was carefully chosen by observing the morphology and viability of U87, U118, U251, A172 and T98 GB cell lines.
The process for observing cell morphology and cell viability was explained in detail in section “cell morphology” and “cell viability assay” of the manuscript.
The Evaluation of Mimic miRNA-7 and GO-Mimic miRNA-7 Nanosystem Transfection Efficiency
To verify the transfection efficiency, we labeled GO, mimic miRNA-7 and GO + mimic miRNA-7 sequences with 0.1 mg of FITC (F143, Thermo Fischer Scientific) and incubated them overnight at 4°C while keeping them protected from light. Next, we introduced GO, mimic miRNA-7 and GO-mimic miRNA-7 to the U87, U118, U251, A172 and T98 cell lines using electroporation or graphene oxide methods, as described in the following sections.
Electroporation with Mimic miRNA-7
The electroporation was chosen as a reference method for GO-mimic miRNA-7 nanosystem transfection. The U87, U118, U251, A172, and T98 glioblastoma cell lines were cultured in a 75 cm3 flask at a density of 9×10⁶ cells before electroporation. First, the cells were collected and centrifuged at 300 x g to obtain the cell culture pellet. Next, the cell pellets were resuspended in Gene Pulser® electroporation buffer (1652676, BioRad Hercules, CA, USA) at a final cell density: 1×10⁶ cells/mL.
A mimic miRNA-7 conjugated with FITC was added to U87, U118, U251, A172 and T98 cells (1 x 10⁶) at a final concentration of 5.0 pmol/mL. Once mimic miRNA-7 was added to cells, the suspension was mixed gently, and 150 μL of the mixture was added into the appropriate transfection sterile electroporation cuvettes (0.2 cm gap, BioRad Hercules, CA, USA). Cells were electroporated using the Gene Pulser electroporation system (BioRad Hercules, CA, USA) with the following conditions: 20 ms square-wave pulse of 200 V and 2,000 μF. The electroporation protocol (20 ms square-wave pulse of 200 V and 2,000 μF) was adapted from previously published data by Kutwin et al 16 Next, the medium volume was increased to 1 mL for cells electroporated at a density of 3 x 10⁵/mL.
Confocal Microscopy
FITC conjugated GO, mimic miRNA-7, and GO-mimic miRNA-7 nanosystems were introduced to the U87, U118, U251, A172 and T98 cell lines (1 x10⁵/ well a 6-well plates) and incubated for 24 hours. Cells after being transfected and electroporated with GO-conjugated with FITC, GO–mimic miRNA-7 conjugated with FITC, or mimic miRNA-7 conjugated with FITC were placed on glass slides on 6-well plates (1 × 10⁵ cells per well). After 24 h, the FITC positive cell observed as a green fluorescent was recorded under a confocal microscope (IX 81 FV-1000, Olympus Corporation, Tokyo, Japan) with FVIO-ASW ver. 1.7c software (Olympus Corporation, Tokyo, Japan).
Flow Cytometry
The flow cytometer (FACSCalibur, Becton Dickinson, Franklin Lakes, NJ, USA) was used for detection of transfection efficiency. For the evaluation of GO-FITC, mimic miRNA-7-FITC and GO-mimic miRNA-7-FITC positive U87, U118, U251, A172 and T98 cell lines, cells at density 1x10⁶/mL (in 6-well plates) were incubated at standard condition for 24h before administration. After the incubation time the GO-FITC, mimic miRNA-7-FITC and GO-mimic miRNA-7-FITC were introduced into the cell and incubated for next 24h. Next, cells were collected into the flow cytometry tubes and suspended at PBS. During the investigation the experiment was done triplite and 8,000 cell were taken into the investigation. Fluorescence emission intensity was measured using FL1 channels for FITC at Em = 530 nm using excitation at 488 nm. Histograms were generated using Flowing Software 2.5.1 (Perttu Terho, Turku, Finland).
Cell Viability Assay After GO-Mimic miRNA-7 Administration
GO-mimic miRNA-7 nanosystem containing GO at 100.0 µg/mL concentration and mimic miRNA-7 at 5.0 pmol/mL was used for cell viability assessment. Cell viability was evaluated using a 2.3-bis-(2-methoxy-4-nitro-5-sulfophenyl)-2H-tetrazolium-5-carboxyanilide salt (XXT)-based cell viability assay kit (Life Technologies, Taastrup, Denmark). Glioblastoma Cell Lines: U87, U118, U251, A172 and T98 GB were incubated in 96-well plates (5 × 10³ cells per well). Next GO - mimic miRNA-7 (GO 100.0 µg/mL: miRNA 5.0 pmol/mL), GO (GO 100.0 µg/mL) and mimic miRNA-7 (5.0 pmol/mL) were added directly into the cell culture medium or added by electroporation to the cells and incubated for an additional 24h. After the incubation time the XTT solution was added to every well at 25.0 µL/well. The mixture was then incubated for an additional 3 hours at 37°C. The optical density (OD) of each well was measured at 450 nm using a scanning multiwell spectrophotometer (Infinite M200, Tecan, Durham, NC, USA).
Isolation of Total RNA
U87, U118, U251, A172 and T98 GB cell line (1 × 10⁵ cells/well) were seeded on a 6-well plate and incubated for 24 hours before total RNA isolation. Subsequently, the medium was removed, and GO - mimic miRNA- 7 (GO 100 µg/mL: miRNA 5.0 pmol/mL), GO (GO 100 µg/mL) and mimic miRNA-7 (5 pmol/mL) were added or added directly to into the medium or added by electroporation to the cells and incubated for an additional 24h. Total RNA was isolated using a PureLink® RNA Mini Kit (Ambion™ Life Technologies, Foster City, CA, USA). The resuspended cell pellets in a lysis buffer with addition of 1% 2-mercaptoethanol and the pellet were homogenized in a TissueLyser ball mill (Qiagen, Germantown, MD, USA) for 2×5 min at 50 Hz. The probes centrifuged at 12000 × g, and the pellets were discarded. The supernatant with total RNA was transferred into a new clean tube and underwent the manufacturer’s instructions. The RNA samples were eluted in 50 µL RNase-free water and stored until usage at −80°C. The RNA concentration was measured using a NanoDrop 2000 spectrophotometer (Thermo Scientific, Wilmington, DE, USA). The cDNA was synthesized with a cDNA High-Capacity Reverse Transcription Kit (AppliedBio-systems, Foster City, CA, USA) to reverse-transcript the mRNA to cDNA using 2200 ng per reaction. The concentration of obtained cDNA was measured using a NanoDrop 2000 spectrophotometer and stored for further analysis at −20°C.
Real-Time PCR
The ∆∆Ct method was used to determine the expression of mRNA using real-time PCR (2):
∆∆Ct = ∆Ct test sample - ∆Ct calibrator sample
The qPCR reaction was carried out using 48-well plates and the Luminaris Color HiGreen reagents qPCR Master Mix (Thermo Fisher Scientific). The cDNA at concentration of 100 ng of was used for the qPCR reaction. The following genes were examined: Pi3KCA, Akt1, mTOR. The primers used for this procedure are presented in Table 1. Glyceraldehyde-3-phosphate dehydrogenase (GAPDH) was used as the reference housekeeping gene. The reaction conditions were set as specified by the manufacturer, and each sample was analyzed in triplicate. The procedure was conducted using a StepOnePlus™ Real-Time PCR System.
Table 1.
Primer Sequences Used for Real-Time Quantitative Reverse Transcriptase Polymerase Chain Reaction (qRT-PCR)
| Target Gene | Forward Primer | Reverse Primer |
|---|---|---|
| PI3KCA | GAAGCACCTGAATAGGCAAGTCG | GAGCATCCATGAAATCTGGTCGC |
| AKT1 | TGGACTACCTGCACTCGGAGAA | GTGCCGCAAAAGGTCTTCATGG |
| mTOR | AGCATCGGATGCTTAGGAGTGG | CAGCCAGTCATCTTTGGAGACC |
| GAPDH | TGCACCACCAACTGCTTAGC | GGCATGGACTGTGGTCATGAG |
Abbreviations: PIK3CA, Phosphatidylinositol 3-kinase catalytic subunit alpha; AKT1, Protein kinase B; PKB, mTOR, Mammalian target of rapamycin; GAPDH, glyceraldehyde-3-phosphate dehydrogenase.
Culture of GB on Chorioallantoic Membrane
Ethics statement: The Ethics review board II Local Committee for Ethics in Animal Research of Warsaw University of Life Sciences - SGGW considers that this type of project does not fall under the legislation for the protection of animals used for scientific purposes, nation-al decree-law (Dz. U. 2015 poz. 266 and 2010–63-EU directive).
Commercially available fertilized eggs (Gallus gallus) (n = 60) were incubated for 6 days at standard conditions (37°C, 60% of humidity). Next, the silicone ring with the deposited 3–4 × 10⁶ U87, U118, U251, A172 and T98 GB cells lines suspended in 30μL of culture medium was placed on the chorioallantoic membrane according to the procedure described by Grodzik et al.20 The eggs were incubated for the next 7 days; then 36 eggs with visible tumour development were chosen. Eggs were divided into three groups of 12: the control group and GO-mimic miRNA-7 nanosystem. Intratumorally administration of 200 μL of GO 100.0 µg/mL: miRNA 5.0 pmol/mL nanosystems was done under the sterile conditions by injection with an insulin syringe (Ø = 29 mm) in a laminar cabinet. Next the tumours were incubated for 3 days. Next, the tumours were resected for further analysis.
Calculation of Tumour Volume
The morphology of tumour tissue was recorded by a stereomicroscope (SZX10, CellD software version 3.1; Olympus Corporation, Tokyo, Japan). The measurements of diameter were taken with CellSens Dimension Desktop version 1.3 (Olympus). The tumours volume was calculated with the equation (3):
V=4/3πr3, where  , π=3,1415.
Statistical Analysis
The data were analyzed using GraphPad Prism 5 (GraphPad Software Inc., La Jolla, CA, USA), with multifactorial analysis of variance. Differences between groups were compared using Tukey’s honestly significant difference post hoc test. Mean and standard deviation or standard error of the mean were used to show results. A significance level of p≤ 0.05 was used.
Results
Nanosystems
Transmission, Scanning Transmission and Scanning Electron Microscopy and Fourier Transform Infrared (FTIR) Spectrum
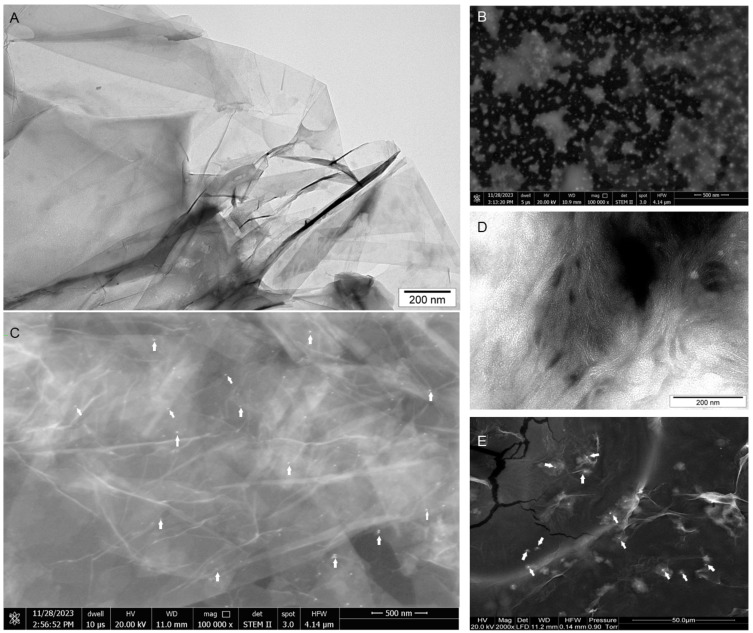
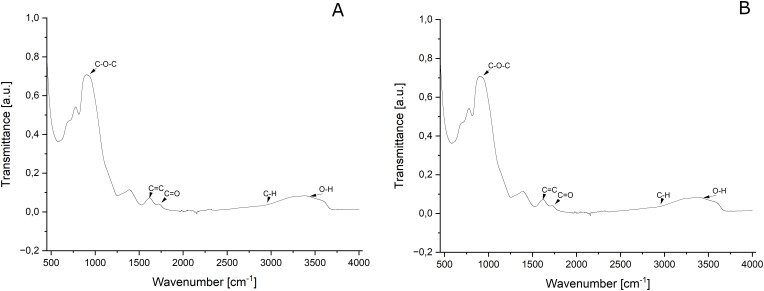
The ultrastructure of GO (Figure 1A) after self-assembly by mimic miRNA-7 (Figure 1B) observed by transmission electron microscopy (Figure 1A,D) and scanning transmission electron microscopy (Figure 1B,E) and scanning electron microscopy showed a high affinity of mimic miRNA-7 into flake surfaces (Figure 1C,E, white arrows) and did not show significant agglomeration of miRNA sequences or GO. The analysis of the Fourier transforms infrared (FTIR) spectrum (Figure 2A and B) showed that the self-assembly of GO involved in the attachment of the mimic miRNA-7 oligonucleotide to the oxygen functional groups on the surface of the GO by non-covalent bonding. The FTIR spectrum (Figure 2A) analysis of GO resulted the characteristic peaks associated with the surface functional groups like: hydroxyl (-OH), carboxyl (-COOH), and epoxy (-C-O-) groups. A characteristic band was observed at approximately 3400 cm-1 and generated by the OH group. Additionally, the vibrations of C–H groups were observed in the 3000–2600 cm-1 range, and a highly intense band at 1600 cm-1 was generated by carbon–carbon double bond vibrations. Bands in the 1410–1300 cm-1 range were generated by C–O and C–C vibrations as well as C–H deformations. The presence of P-O bonds of PO4 tetrahedra was detected at 575 and 1021 cm−1 and it was observed only at FTIR ATR spectrum of GO-mimic miRNA-7 (Figure 2B). Additionally, the infrared bands between 1080–1300 cm−1 were observed and attributed to the stretching vibration of PO4 (Figure 2B).
Figure 1.
Ultrastructure of graphene oxide (A), mimic miRNA-7 (B) and graphene oxide – mimic miRNA-7 nanosystems (C) observed by transmission electron microscopy (A, D) and scanning electron microscopy (B, C, E). White arrows point to mimic miRNA-7. Scale bars: 200nm −50µm. Abbreviations: GO-graphene oxide.
Figure 2.
The attenuated total reflectance–Fourier transform infrared (ATR–FTIR) spectrum of graphene oxide (A) and graphene oxide – mimic miRNA-7 nanosystems (B). Graphene oxide at concentration 100.0 µg/mL, graphene oxide -mimic miRNA-7 nanosystems miRNA at concentration 100.0 µg/mL of graphene oxide and 5 pmol/mL of mimic miRNA-7.
Dynamic Light Scattering, ζ-Potentials and UV-Vis
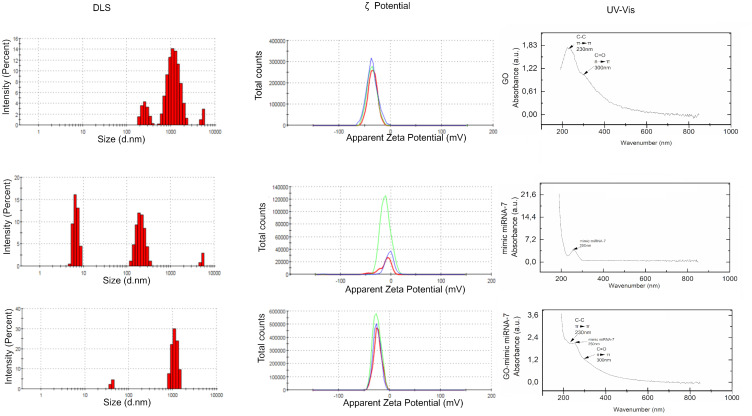
The size distribution (Figure 3) measured by the DLS method showed a high affinity of mimic miRNA-7 to GO structure and performed as a stabile hydrocolloid with a polydispersity index (PDI) = 0.597±0.05. The polydispersity indexes were 0. 517 ±0.08 and 0.338±0.1 for GO and mimic miRNA-7 nanosystems respectively. The electrostatic potential called the ζ-potential indicated the surface charge and stability of obtained nanosystems. ζ-potential of GO, mimic miRNA-7 and GO-mimic miRNA-7 were −35.6±10.9 mV, −11.9±2,78 mV, and −24.8±7.25mV respectively. The UV-Vis spectrum analysis revealed some important features. There were peaks at 230 nm which correspond to C-C bonds, and at 300 nm which are characteristic of C=O bonds. Additionally, the UV-Vis spectrum of graphene oxide - which mimics miRNA-7 nanosystems showed a characteristic peak at 250 nm which is dedicated to miRNA.
Figure 3.
Dynamic Light Scattering, ζ-Potentials and UV-Vis of graphene oxide, mimic miRNA-7 and graphene oxide – mimic miRNA-7 nanosystems.
Abbreviations: GO, graphene oxide; DLS, dynamic light scattering.
Entrapment Efficiency and Loading Capacity
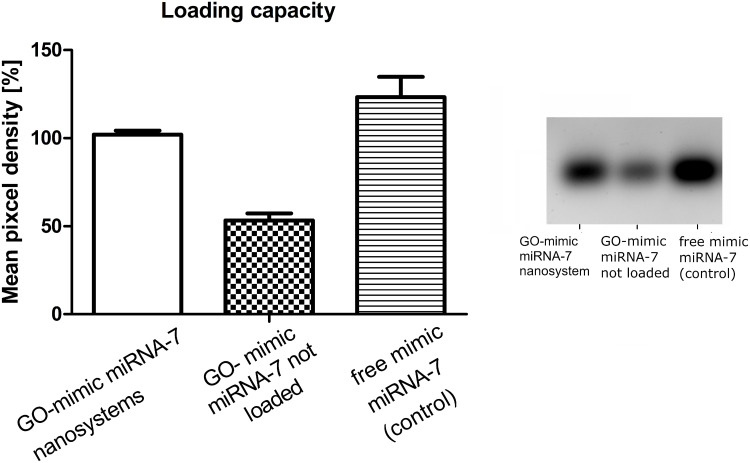
The Entrapment Efficiency results showed that the GO-mimic miRNA-7 nanosystems had EE = 80.20% ± 2.45%. According to the loading capacity investigation, the mimic miRNA-7 was effectively loaded into the GO nanosystems, as shown in Figure 4B. Gel electrophoresis revealed that the amount of mimic miRNA-7 untrapped and unloaded in GO nanosystems was significantly lower compared to the amount of mimic miRNA-7 efficiently loaded into GO nanosystems (Figure 4A).
Figure 4.
Mimic miRNA-7 loading capacity of the graphene oxide evaluated through agarose gel electrophoresis. A-statistic summary, B- gel electrophoresis. a,b,c, indicate significant differences between the concentrations (p ≤ 0.05).
Abbreviation: GO, graphene oxide.
Mimic miRNA-7 Release Kinetics from GO- Mimic miRNA-7 Nanosystem
The kinetics of the release of mimic miRNA-7 from GO nanosystems were studied at two different pH levels (4.5 and 7.4) and at varying incubation times. The results showed that at pH 4.5 (Figure 5A), the concentration of miRNA-7 increased monotonically with incubation time (hours). However, at pH 7.4, the highest concentration of miRNA-7 was observed after 2 hours of incubation (Figure 5B).
Figure 5.
Mimic miRNA-7 release kinetics from GO- mimic miRNA-7 nanosystem at pH=4.5 (A) and pH=7.0 (B).
Abbreviation: GO, graphene oxide.
Cell Treatment
Cell Morphology
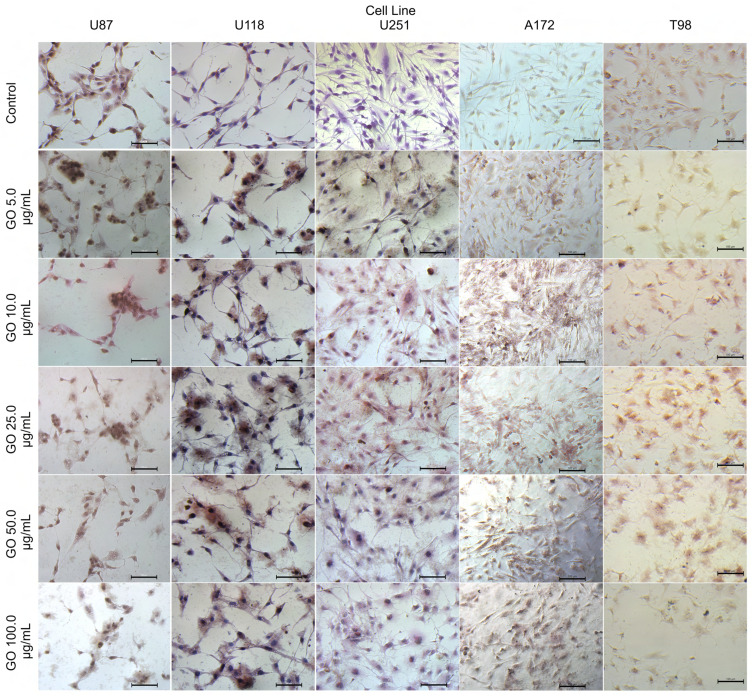
The GO treatment against the U87, U118, U251, A172 and T98 GB cell lines showed a high affinity of GO to the cell membranes without agglomeration at extracellular localization. The cell morphology of U87, U118, U251, A172 and T98 GB cell lines after GO administration at all inspected concentrations, showed shortened cytoplasmic tentacles of cells, and reduced density of cells in the area of observations comparing to the control non treated cells (Figure 6).
Figure 6.
The morphology of U87, U118, U251, A172 and T98 glioblastoma cell lines after treatment of graphene oxide at concentration: 5.0–100.0 µg/mL. Light Optical microscopy; May-Grünwald-Giemsa staining method. Scale bars: 100 µm.
Abbreviation: GO, graphene oxide.
Cell Viability Assay
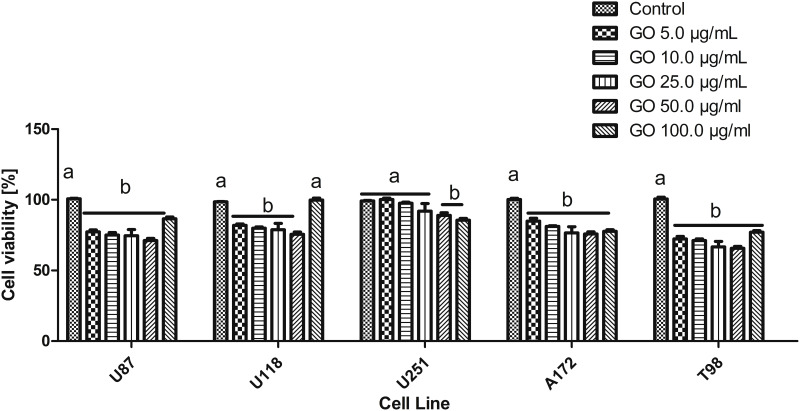
The results of cell viability after GO treatment of U87, U188, U251, A172 and T98 GB cell lines showed that the lower concentration did not significantly affect the viability of the cells. However, the viability of investigated cell lines was significantly reduced after GO 100.0 μg/mL treatment (Figure 7).
Figure 7.
U87, U118, U251, A172 and T98 glioma cell lines viability after the 5.00–100.0 µg/mL treatment with graphene oxide. a,b,c, indicate significant differences between the concentrations (p < 0.05).
Abbreviation: GO, graphene oxide.
Electroporation
Transfection Efficiency Evaluation
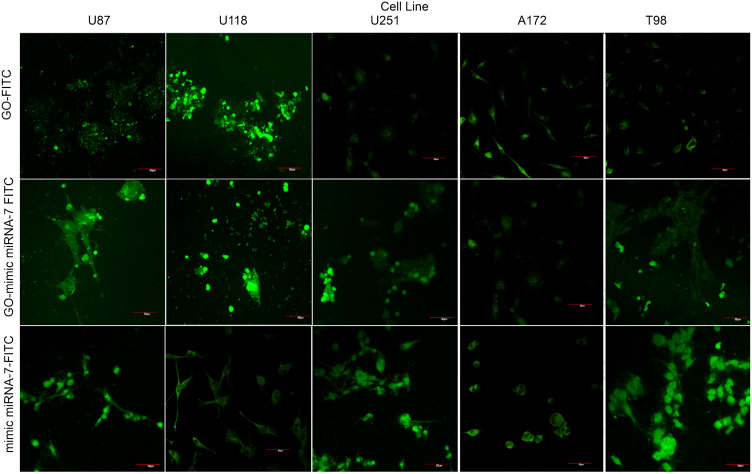
The evaluation of transfection efficiency by confocal microscopy visualization showed that GO was conjugated by self-assembly with fluorescein isothiocyanate (FITC) and had a strong affinity to the cell membranes at all investigated GB cell lines. Figure 8 shows the cell morphology as well as cellular localization of GO, mimic miRNA-7 and GO-- mimic miRNA-7 nanosystems conjugated with FITC particles. The electroporation with mimic miRNA-7 was an effective method to deliver the structure of miRNA-7 into cancer cells, but the mimic miRNA-7 conjugated with FITC was also observed extracellular without the connection with cell structure. The GO – mimic miRNA-7 nanosystems conjugated with FITC showed higher affinity to the cell membranes, than the mimic miRNA-7 conjugated with FITC.
Figure 8.
Transfection efficiency evaluation by confocal microscopy at U87, U118, U251, A172 and T98 glioblastoma cell lines. Green dye indicated the FITC positive cells- transfected cells. Scale bars: 50µm.
Abbreviations: GO, graphene oxide; FITC, fluorescein isothiocyanate.
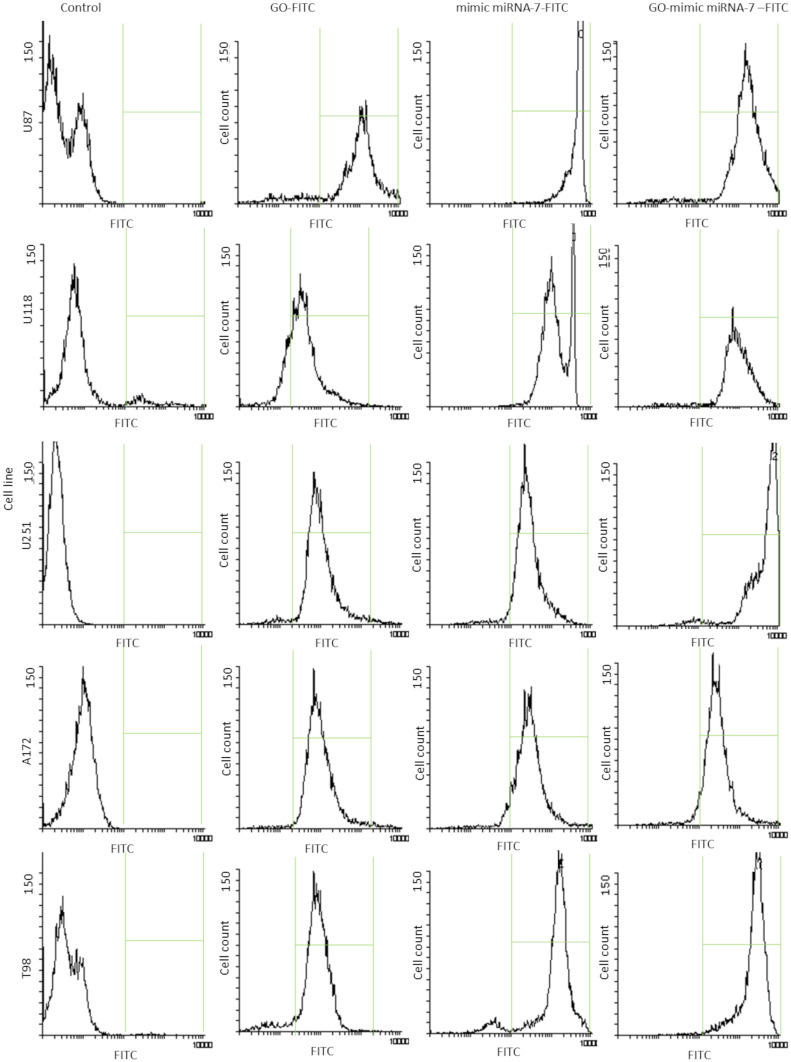
The transfection efficiency evaluated by confocal microscopy was confirmed by flow cytometry analysis. Figure 9 shows the cytograms obtained after U87, U118, U251, A172 and T98 GB cells treated by GO, mimic miRNA-7 and GO- mimic miRNA-7 nanosystems conjugated with FITC (Figure 9). The histograms analysis confirmed the cellular localization of GO-mimic miRNA-7 nanosystems at all investigated GB cell lines. The results show that the GO – mimic miRNA-7 sequence had similar transfection effectivity to electroporation. These findings confirm that transfection by GO conjugated with selected miRNA sequences can be an efficient complex for gene sequence delivery.
Figure 9.
Transfection efficiency evaluation by flow cytometry at U87, U118, U251, A172 and T98 glioblastoma cell lines. Green frame- FITC positive cells.
Abbreviations: GO, graphene oxide; FITC, fluorescein isothiocyanate.
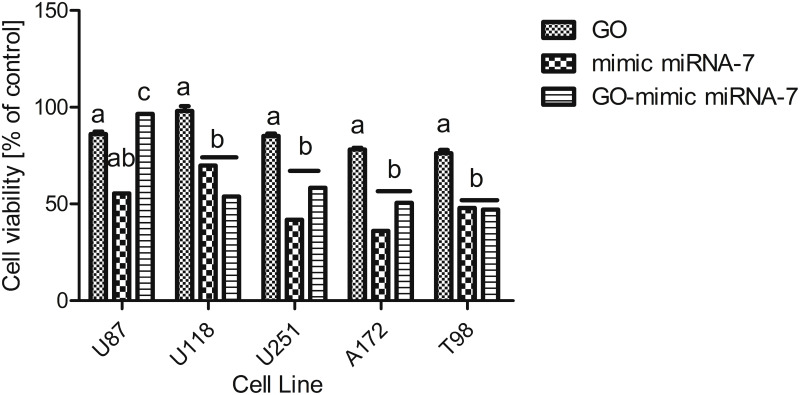
The concentration of GO-mimic miRNA-7 was estimated based on the cell morphology observation after GO administration but also based on the assessment of the viability of U87, U118, U251, A172 and T98 GB cell lines. The cell viability after the electroporation was significantly decreased and showed the cell lines specific effect (Figure 10). The electroporation caused a significant reduction of cell viability at each cell line, but the most significant effect of transfection was observed at the A172 glioma cell line.
Figure 10.
U87, U118, U251, A172 and T98 glioblastoma cell lines viability after exposition to graphene oxide (GO), graphene oxide (GO)-mimic miRNA-7 nanosystems, and mimic miRNA-7. a,b,c, indicate significant differences between the treatment (p < 0.05).
Abbreviation: GO, graphene oxide.
Real-Time PCR
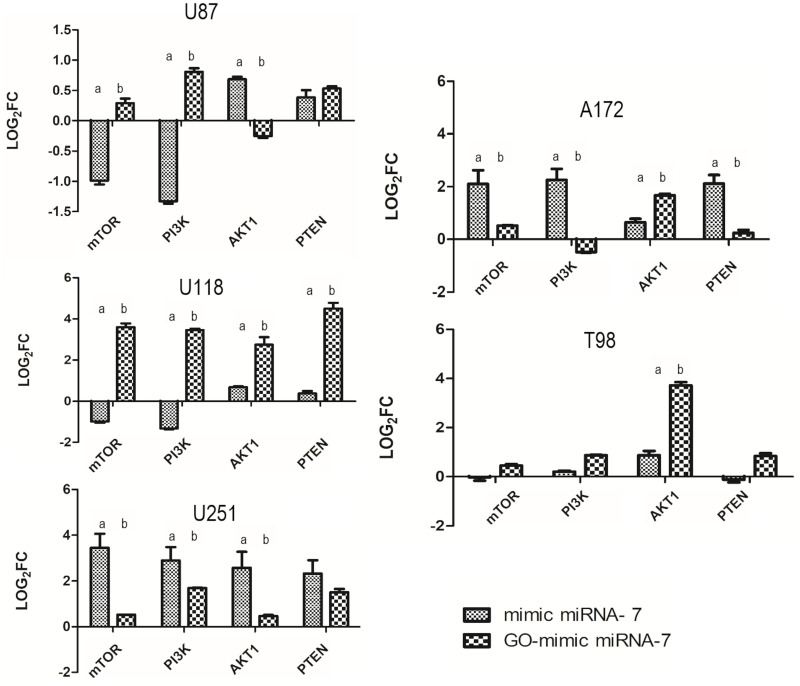
The impact of GO-mimic miRNA-7 treatment on selected gene expression levels varied among different GB cell lines (Figure 11). The study found that the downregulation of the mTOR gene was observed only in the U87 cell line after GO-mimic miRNA-7 nanosystems treatment. However, the downregulation of the PI3K gene was found only in the A172 cell line, compared to the control. When compared to electroporation with mimic miRNA- 7, it was also downregulated in the U251 glioma cell line. The expression level of AKT1 was significantly downregulated at the U87 cell line after GO-mimic miRNA-7 nanosystem exposition. Similarly, the downregulation of AKT1 was observed in the U87 and U251 cell lines when treated with mimic miRNA-7, like the PI3K gene expression level. Furthermore, PTEN gene expression was significantly upregulated in all investigated cell lines after exposure to the mimic miRNA-7 through electroporation. However, the delivery of mimic miRNA-7 via GO-based nanosystems was more effective in the U118 and T98 cell lines.
Figure 11.
mTOR, PI3K, AKT1, PTEN gene expression profile in U87, U118, U251, A172 and T98 glioblastoma cell lines following mimic miRNA-7 or GO-mimic miRNA-7 nanosystems treatment. a,b values within bars with different superscripts are significantly different, p ≤ 0.05. Values were normalized to the housekeeping gene GAPDH.
Abbreviation: GO, graphene oxide.
Culture of GB on Chorioallantoic Membrane (CAM)
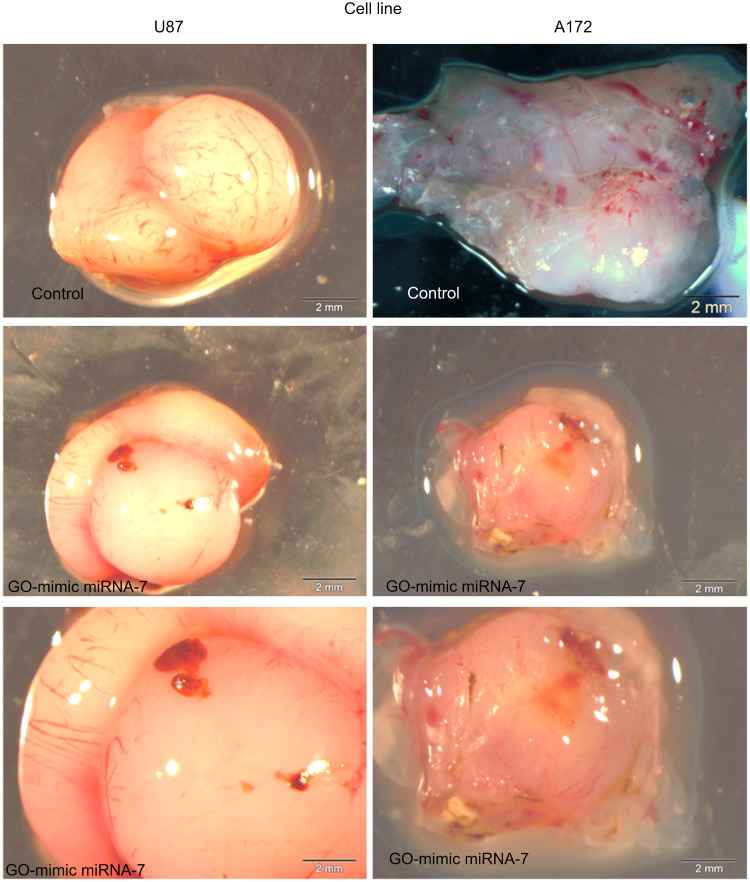
In this study, U87 and U172 glioma tumour tissues were subjected to treatment with GO-mimic miRNA-7 nanosystems. The selection of these cells was based on viability, morphology, and qPCR outcomes. Analysis of the macrostructure of U87 and A172 tumours after treatment with GO-mimic miRNA-7 nanosystems revealed a significant decrease in tumours size and volume (Table 2), and visible number of blood vessels compared to the control group that did not receive treatment (Figure 12).
Table 2.
Mass and Volume of U87 and A172 Tumour Tissue
| Cell Line | Group | Mass [mg] | Volume [cm3] |
|---|---|---|---|
| U87 | Control | 104,4a±4,37 | 119,48a±45,21 |
| GO-mimic miRNA-7 | 81,89b±7,54 | 56,38b±28,58 | |
| A172 | Control | 97,65a±5,96 | 67,84a±18,69 |
| GO-mimic miRNA-7 | 73,90b±5,22 | 34,96b±14,74 |
Notes: a,b Values within rows with different superscripts are significantly different. U87 and A172 glioma tumors treated with GO mimic miRNA-7, and control (untreated tumor).
Abbreviation: GO-graphene oxide.
Figure 12.
The morphology of U87 and A172 glioma tumour tissue cultured on an in ovo model. Scale bar: 2 mm.
Abbreviation: GO, graphene oxide.
Discussion
Glioblastoma (GB) is the most common and aggressive form of primary brain cancer which arises from glial cells. This type of cancer is characterized by rapid, invasive growth with not fully understood development mechanisms. The treatment of GB is challenging and complex and with a five-year survival rate for GB patients, only 6.9% become one of the deadliest types of cancer.21 Surgery is a primary treatment option for GB, aiming to remove as much of the tumour as possible. However, due to the infiltrative nature of GB cells, it is often difficult to completely eradicate the tumour through surgery alone, so chemotherapy and radiotherapy can be implemented. The targeted therapies, immunotherapies, and gene therapy using the various targeted drugs, genes or molecules are being investigated for their potential efficacy in GB treatment. The gene therapy using microRNA mimic or antisense sequences showed a positive outcomes at cancer therapy to modulate gene expression.22 MicroRNAs are small RNA molecules that can regulate gene expression by targeting messenger RNA (mRNA) transcripts and suppressing their translation or promoting their degradation.23 In cancer therapy, miRNAs can potentially modulate the activity of various cancer-related genes and pathways by acting as tumour suppressors or oncogenes, affecting the expression of genes involved in cell proliferation, apoptosis, invasion, and other key processes. Research has shown that dysregulation of specific miRNAs is associated with GB progression and therapeutic resistance.24 Therefore, using miRNA-based therapeutics to modify the expression of these miRNAs holds promise in the treatment of GB.25 Several strategies are being explored in miRNA therapy for GB. One approach is the use of synthetic miRNA mimics or oligonucleotides to restore the expression of tumor-suppressive miRNAs that are downregulated in GB.26 The Cancer Genome Atlas (TCGA) and miRNA microarray analysis of bulk RNA sequencing dataset revealed that miRNAs are highly dysregulated at GB and participate in all hallmarks of cancer.15 These synthetic miRNAs can be delivered to the tumour cells using various delivery systems, such as viral vectors or non-viral vectors like nanoparticles.27 Another strategy is the inhibition of oncogenic miRNAs that are upregulated in GB. This can be achieved by using anti-miRNA oligonucleotides or other inhibitors to block the activity of these oncogenic miRNAs.28 An efficient mimic or anti-miRNA delivery system should be able to transport a large amount of therapeutic nucleotides or bioactive molecules to cross the cell membrane easily, protect the agent from cytoplasmic enzymes, and deliver it to the nucleus. Lipids are the pioneer natural compounds in drug delivery, the commercial form of which is presented as Lipofectamine™ (Life Technologies, Taastrup, Denmark). Polysaccharides, collagen-based like atelocollagen (ATCOL) are also used in miRNA delivery systems, because of lower immunogenic activity than lipofection and high cellular uptake of nucleotides at in vitro and in vivo investigations.29–31 However, recently GO paid more attention as a gene delivery system because of its loading capacity, stability, slow degradation and release of the therapeutic agents in the target site.32 GO offers several advantages as a miRNA delivery system.33 GO exhibits a 2D structure, high surface-to-volume ratio, and strong absorption ability, which make it an ideal candidate for loading miRNA due to its excellent physicochemical properties. Moreover, it has high stability in biological environments that can protect loaded miRNA from degradation and premature release.34 This stability is essential for maintaining the therapeutic efficacy of the delivered miRNA. Surface functionalization of GO can improve its dispersibility, biocompatibility, and targeting ability, facilitating the specific delivery of miRNA to desired cells or tissues.35 Comparing the efficiency of GO as a delivery with lipofectamine or ATCOL, it presents high biocompatibility at in vitro and in vivo models, but also demonstrated similar miRNA delivery efficiency.16,36 Moreover, GO presents high stability after functionalization with miRNAs, thus it can effectively protect them from degradation by endonucleases and increase their cellular uptake.37 The targeting capability of GO and lipofectamine, as well as ATCOL can be modified by functionalized or conjugated with targeting moieties or ligands. The highly efficient transfection by using GO as a delivery system for nucleotides, bioactive molecules or drugs was reported at in vitro and in vivo research.38,39 However, lipofection is generally known for its higher transfection efficiency, especially in cell lines, although it may vary depending on the lipofection reagent used.39 In our studies, the GO – miRNA-7 nanosystem presented high entrapment efficiency and effective transfection. The GO at high concentrations (100.0 µg/mL) still has a high biocompatibility with cancer cells, but this effect was also the cell line-dependent effect. The self-assembly of GO by mimic miRNA-7 demonstrated in this study is a promising approach for the delivery of miRNA molecules and it is an essential characteristic for an effective delivery system. The confirmation of this attachment through transmission electron microscopy (TEM) images (Figure 1A) without significant agglomeration further supports the efficacy of this self-assembly strategy. The TEM images clearly show the presence of miRNA-7 on the surface of GO flakes, indicating successful attachment without clumping or clustering. The ability of GO to bind and carry miRNA molecules is attributed to its unique properties including a large surface area and strong electrostatic interaction with biomolecules. Liu et al28 showed that the PEGylated GO sheets were functionalized with aromatic drug (SN38) by Van der Waals interaction, which has demonstrated the high potential of GO as a delivery system. In our studies, the surface of GO flakes contains oxygen functional groups that can interact with miRNA through non-covalent bonding. This minimizes the risk of miRNA degradation or premature release, enhancing the chances of successful and targeted delivery. The absence of agglomeration or clustering of miRNA-7 on the GO flakes suggests that the self-assembly process is well-controlled and provides a uniform distribution of miRNA-7. The Fourier transform infrared (FTIR) spectrum (Figure 2A and B) analysis further supported this observation by showing that the attachment of the miRNA-7 to the GO involved non-covalent bonding with the oxygen functional groups on the surface of the GO. This was evident from the characteristic peaks associated with the functional groups present on the GO surface. The dynamic light scattering (DLS) results showed that the GO-mimic miRNA-7 nanosystems had a high affinity and stability, as indicated by a polydispersity index (PDI) of 0.597±0.05. DLS results for GO, mimic miRNA-7 and GO-mimic miRNA-7 nanosystems colloids showed similar trends with subtle differences. It must be mentioned here that we do not attempt to estimate the average particle size of GO, mimic miRNA-7 and GO-mimic miRNA-7. DLS is a technique that is well suited for estimating the size of spherical shaped particles. GO and GO-mimic miRNA-7 hydrocolloids, on the contrary, are particulate systems that possess extremely large ratios of length or breadth (microns) to thickness (nanometers). Therefore, the DLS pattern of such a system could provide a convoluted result, which is expected to be close to the lateral dimensions of the GO and GO-mimic miRNA-7 platelets. Therefore, size assessment is always carried out using two methods: DLS and TEM, STEM of SEM microscopy. However, the objective in our studies was to compare the relative change in the platelet size as a function self-assembly functionalization. Additionally, it is worth to mentioned that Lee et al compare the results of large, micron-sized GO, and small, nano-sized GO functionalization with DNA.40 The adsorption and desorption profiles of DNA were similar for both these surfaces. However, there was an optimal GO concentration for DNA attachment. The zeta potential (ζ) is an important factor for characterizing the stability of colloidal dispersions. It is a measure of the negative charge around the double layer associated with the colloidal particle because of the ionization of different functional groups.41 Generally, particles with zeta potential in the range −30 mV to +30 mV are considered stable due to electrostatic repulsion. Our measurements show that zeta potential for the GO and GO-mimic miRNA-7 was similar and reflect the good stability of hydrocolloids. Similar results were presented by Ou et al42 where GO with PEI was a delivery platform for antisense miRNA-214 for oral squamous cell carcinoma cell treatment. The ζ-potential measurements indicated that the GO-mimic miRNA-7 nanosystems had an intermediate surface charge compared to the GO and mimic miRNA-7 alone. This suggests that the attachment of the miRNA-7 to the GO surface influenced the surface charge of the nanosystems. The entrapment efficiency (EE) results showed the successful attachment of miRNA-7 to GO suggesting that the GO-mimic miRNA-7 nanosystems can effectively deliver miRNA molecules to specific target cells or tissues. The entrapment efficiency in terms of miRNA delivery refers to the percentage of miRNA molecules that are successfully encapsulated within the delivery system, in ours the EE was high and indicated that mimic miRNA-7 was efficiently localized at cancer cells. The high affinity and stable self-assembly of GO with mimic miRNA-7 has several advantages in our results. As expected, the released kinetics studies showed a significant increase in the concentration of mimic miRNA-7 at time dependent manner released from GO-mimic miRNA-7 at a 4.5 pH level (Figure 5). This was important information because the 4.5 pH level stimulated the intratumoral tissue conditions. It is important to note that the choice of the most efficient delivery system depends on the specific experimental requirements and target cells. The GB cell develops either from glial cells, such as astrocytes, oligodendrocytes, microglia, and ependymal cells or from a subpopulation of cancer stem cells residing in the tissue. In our previous experiments24 GB cell lines showed cell cell-dependent effect on the antisense miRNA-21 exposition. Our recent cell treatment experiments showed that the GO had a high affinity for the cell membranes of GB cell lines (Figure 6), as observed from the cell morphology observations. The GO treatment resulted in shortened cytoplasmic tentacles of the cells and reduced cell density. The cell viability assay results (Figure 7) indicated that the lower concentrations of GO did not significantly affect cell viability, but the viability of U87, U251, A172 and T98 cell lines was significantly reduced at higher concentrations (100.0 μg/mL).
EE results were confirmed by observation of localization of GO or mimic miRNA-7, or mimic miRNA-7 conjugated with FITC by confocal microscopy (Figure 8) and flow cytometry (Figure 9) analysis. However, the EE can vary depending on the type of delivery system used but still protects miRNA from degradation and facilitates its entry into target cells.29 Moreover, the confocal microscopy and flow cytometry analysis confirmed the efficient cellular localization of the GO-mimic miRNA-7 nanosystems in the cells. The transfection efficiency of the GO-mimic miRNA-7 nanosystems was similar to that of electroporation, which was used as a reference method for mimic miRNA-7 delivery, suggesting that the GO conjugated with miRNA sequences can be an efficient complex for gene sequence delivery. It was also observed that a concentration of 100 µg/mL of graphene oxide can result in a minor level of agglomeration, which in turn leads to a lower uptake of graphene sheet by cells. Paulmurugan et al evaluated the release of antisense miRNA-21 from GO-PEI complexes in the investigated cells.43 The results showed that transfection efficacy was high, and the release kinetics of antisense miRNA-21 was slow with maximum fluorescence at 24 h post transfection GO-mimic miRNA-7 nanosystems caused a slow release of miRNA-7 into the cell, which may contribute in the long run to increasing the effectiveness of the GO-mimic miRNA-7 nanosystem in cancer treatment. The GB cells viability after the administration of GO-mimic miRNA-7 at final formulation caused significant degrees at U118, U251, A172 and T98 cell line. Moreover, the results showed that electroporation caused significant decreased at cell viability at all investigated glioblastoma cell lines. The obtained results were similar to the published data by Alamdari-Palangi et al44 where the mimic miRNA-7 decreased the glioblastoma cell viability and increased the sensitivity to erlotinib. However, in our results the effect was cell dependent.
The real-time PCR analysis revealed that the impact of GO-mimic miRNA-7 treatment on gene expression varied among different GB cell lines. Results of our studies have shown the downregulation of the mTOR gene only in the U87 cell line after treatment with the nanosystems, while the downregulation of the PI3K gene was found only in the A172 cell line. The targeting mTOR pathway in U87 GB cells can have therapeutic implications. The mTOR (mechanistic target of rapamycin) signalling pathway is involved in key cellular processes such as cell growth, protein synthesis, and metabolism and plays a significant role in the regulation of the U87 GB cell line.45 The mTOR complex, which is downstream of the PI3K-Akt signalling pathway, plays a crucial role in regulating protein synthesis, metabolism, and angiogenesis. Dysregulation of mTOR has been implicated in the development of GB, suggesting that targeting the mTOR pathway could have therapeutic potential. Combinatorial approaches, such as dual inhibition of the PI3K/mTOR pathway, have been investigated as potential strategies for treating GB.46,47 Recent studies have shown that mTOR and PI3K inhibitors are being explored as therapeutic candidates in clinical studies for solid tumours and preclinical mouse models. Inhibitors of mTOR, such as rapamycin and rapamycin analogues, have demonstrated potent effects in suppressing the growth and proliferation of cancer cells.48 Therapies targeting both the EGFR-mTOR kinase and PI3K pathways have been found to suppress tumour growth and increase cell death in PTEN-deficient tumour cells.12 These findings indicate that targeting the mTOR pathway and combining it with other therapeutic strategies holds potential for the treatment of GB. In U87 GB cells, the mTOR signalling pathway has been implicated in the regulation of stemness and proliferation. It has been reported that the combined inhibition of PI3Kα (phosphoinositide 3-kinase alpha) and mTOR in U87 cells has affected the glioma stem cells, which are considered a key population driving tumour growth and resistance.49 After treatment with the GO-mimic miRNA-7 nanosystems, the gene expres-sion level of AKT1 was significantly downregulated in the U87 and expressed at a lower level in the U251 cell line. The mRNA expression levels of mTOR, PI3K, and AKT1 indicate that the GO-mimic miRNA-7 nanosystems act in a cell-dependent manner. Our results demonstrate that the cell morphometric parameters affect the efficiency of treatment by the mimic miRNA-7 in GB cell lines. However, the most optimistic result for cancer therapy was the upregulation of PTEN expression level at the GB cell line after the GO-mimic miRNA-7 treatment. The nanosystems GO-mimic miRNA-7 after introduction into the U118 and T98 cell line caused significant upregulation of PTEN expression level compared with the electroporation. PTEN gene encodes a tumor suppressor protein which is altered in several malignancies. As a negative regulator of PI3K/Akt/mTOR signalling, PTEN acts as a tumour suppressor. It was also reported that the downregulation of PTEN expression can increase tumour growth and malignancy.12,49 The recent data showed that the resistance to CDK4/6 inhibitors via Akt was dedicated by PTEN loss.50,51 Moreover, increased proliferation and cancer cell viability were observed after the decreased expression level for PTEN. The stimulation of cancer cells growth was observed after the inhibition of glycolysis by PTEN.51 The upregulation of PTEN expression level can active the programmed cell death by apoptosis and inhibit the PI3K/Akt/mTOR and nuclear factor-kappaB (NF-ĸB) pathways.37 EMT is associated with the metastasis of cancer cells and can be also inhibited by PTEN activity, thus PTEN down-regulation is associated with an undesirable prognosis, as it possesses anti-tumour activity.51 Since miR-7 plays an important role in GB tumour progression, we further examined the effects of miR-7 on GB tumour growth in the in-ovo model. Our studies showed that in the in-ovo model, the treatment of U87 and A172 glioma tumours with the GO-mimic miRNA-7 nanosystems caused a significant reduction in both tumour volume and weight compared with tumours growing in control non-treated groups. A similar observation was reported when xenograft tumours performed activation of apoptosis and decreased cell proliferation observed by Ki-67 protein expression in the miR-7 group compared with control tumours.52 These findings confirm that miR-7 targets PI3K at the GB xenograft model. Our results suggest that self-assembling GO with mimic miRNA-7 can effectively deliver miRNA into GB cells. This can modulate the mTOR/PI3K/AKT pathway and upregulate PTEN gene expression levels in a cell-dependent manner. The GO-mimic miRNA-7 nanosystems show promise as a potential therapeutic strategy for GB treatment. Further studies are warranted to investigate the mechanism of action and optimize the treatment conditions for better clinical applicability.
Conclusion
The analysis of the ultrastructure and FTIR-ATR spectrum of graphene oxide (GO) as a nanosystem for delivering mimic miRNA-7 showed its ability to entrap the mimic miRNA-7 through non-covalent bonding. The size, ζ potential, and UV-Vis measurements indicated the good stability of the obtained GO-mimic miRNA-7 hydrocolloids. Our newly synthesized GO-mimic miRNA-7 nanosystems exhibited high entrapment efficiency and loading capacity, as well as a time-dependent release kinetics of mimic miRNA-7 from its surface. The mimic miRNA-7 delivered by GO nanosystems targets the mTOR pathway and upregulates the tumour suppressor gene PTEN. PTEN inhibits the PI3K/Akt/mTOR signalling pathway, which regulates cancer growth in a cell-dependent manner. The GO-mimic miRNA-7 nanosystems have shown potential for glioblastoma treatment by regulating pathways and boosting tumour suppressor genes. Further re-search is necessary to optimize treatment conditions for clinical use.
Acknowledgments
This report is part of Marta Kutwin’s habilitation thesis.
Disclosure
The authors report no conflicts of interest in this work.
References
- 1.Geim AK, Novoselov KS. The rise of graphene. Nat Mater. 2007;6(3):183–191. doi: 10.1038/nmat1849 [DOI] [PubMed] [Google Scholar]
- 2.Nasiłowska B, Bogdanowicz Z, Hińcza K, et al. Graphene oxide aerosol deposition and its influence on cancer cells. preliminary results. Materials. 2020;13(19):4464. doi: 10.3390/ma13194464 [DOI] [PMC free article] [PubMed] [Google Scholar]
- 3.Jaworski S, Strojny-Cieślak B, Wierzbicki M, et al. Comparison of the toxicity of pristine graphene and graphene oxide, using four biological models. Materials. 2021;14(15):4250. doi: 10.3390/ma14154250 [DOI] [PMC free article] [PubMed] [Google Scholar]
- 4.Mohr AM, Mott JL. Overview of microRNA biology. Semin Liver Dis. 2015;35(1):3–11. doi: 10.1055/s-0034-1397344 [DOI] [PMC free article] [PubMed] [Google Scholar]
- 5.Gajda E, Grzanka M, Godlewska M, Gawel D. The role of miRNA-7 in the biology of cancer and modulation of drug resistance. Pharmaceuticals. 2021;14(2):149. doi: 10.3390/ph14020149 [DOI] [PMC free article] [PubMed] [Google Scholar]
- 6.Jia B, Liu W, Gu J, et al. MiR-7-5p suppresses stemness and enhances temozolomide sensitivity of drug-resistant glioblastoma cells by targeting Yin Yang 1. Exp Cell Res. 2019;375(1):73–81. doi: 10.1016/j.yexcr.2018.12.016 [DOI] [PubMed] [Google Scholar]
- 7.Morales-Martínez M, Vega MI. Role of microRNA-7 (mir-7) in cancer physiopathology. Int J Mol Sci. 2022;23(16):9091. doi: 10.3390/ijms23169091 [DOI] [PMC free article] [PubMed] [Google Scholar]
- 8.Higuchi T, Todaka H, Sugiyama Y, et al. Suppression of microRNA-7 (miR-7) biogenesis by nuclear factor 90-nuclear factor 45 complex (nf90-nf45) controls cell proliferation in hepatocellular carcinoma. J Biol Chem. 2010;291(40):21074–21084. doi: 10.1074/jbc.M116.748210.] [DOI] [PMC free article] [PubMed] [Google Scholar]
- 9.Xu W, Yang Z, Lu N. A new role for the PI3K/Akt signaling pathway in the epithelial-mesenchymal transition. Cell Adh Migr. 2015;9(4):317–324. doi: 10.1080/19336918.2015.1016686 [DOI] [PMC free article] [PubMed] [Google Scholar]
- 10.Zhao JG, Men WF, Tang J. MicroRNA-7 enhances cytotoxicity induced by gefitinib in non-small cell lung cancer via inhibiting the EGFR and IGF1R signalling pathways. Wspólczesna Onkol. 2015;3:201–206. doi: 10.5114/wo.2015.52655 [DOI] [PMC free article] [PubMed] [Google Scholar]
- 11.Peng Y, Wang Y, Zhou C, Mei W, Zeng C. PI3K/Akt/mTOR pathway and its role in cancer therapeutics: are we making headway? Front Oncol. 2022;12:819128. doi: 10.3389/fonc.2022.819128 [DOI] [PMC free article] [PubMed] [Google Scholar]
- 12.Fusco N, Sajjadi E, Venetis K, et al. PTEN alterations and their role in cancer management: are we making headway on precision medicine? Genes. 2020;11(7):719. doi: 10.3390/genes11070719 [DOI] [PMC free article] [PubMed] [Google Scholar]
- 13.Bermúdez Brito M, Goulielmaki E, Papakonstanti EA. Focus on PTEN regulation. Front Oncol. 2015;5:166. doi: 10.3389/fonc.2015.00166 [DOI] [PMC free article] [PubMed] [Google Scholar]
- 14.Zhang Z, Zhao M, Wang G. Upregulation of microRNA-7 contributes to inhibition of the growth and metastasis of osteosarcoma cells through the inhibition of IGF1R. J Cell Physiol. 2019;234(12):22195–22206. doi: 10.1002/jcp.28787 [DOI] [PubMed] [Google Scholar]
- 15.Available from: https://clinicaltrials.gov/show/NCT01829971. Accessed September 04, 2024.
- 16.Kutwin M, Sosnowska ME, Strojny-Cieślak B, et al. MicroRNA delivery by graphene-based complexes into glioblastoma cells. Molecules. 2021;26(19):5804. doi: 10.3390/molecules26195804 [DOI] [PMC free article] [PubMed] [Google Scholar]
- 17.Castagnola V, Deleye L, Podestà A, et al. Interactions of graphene oxide and few-layer graphene with the blood-brain barrier. Nano Lett. 2023;23(7):2981–2990. doi: 10.1021/acs.nanolett.3c00377 [DOI] [PMC free article] [PubMed] [Google Scholar]
- 18.Yang K, Gong H, Shi X, Wan J, Zhang Y, Liu Z. In vivo biodistribution and toxicology of functionalized nano-graphene oxide in mice after oral and intraperitoneal administration. Biomaterials. 2013;34(11):2787–2795. doi: 10.1016/j.biomaterials.2013.01.001 [DOI] [PubMed] [Google Scholar]
- 19.Kurantowicz N, Strojny B, Sawosz E, et al. Biodistribution of a high dose of diamond, graphite, and graphene oxide nanoparticles after multiple intraperitoneal injections in rats. Nanoscale Res Lett. 2015;10(1):398. doi: 10.1186/s11671-015-1107-9 [DOI] [PMC free article] [PubMed] [Google Scholar]
- 20.Grodzik M, Sawosz E, Wierzbicki M, et al. Nanoparticles of carbon allotropes inhibit glioblastoma multiforme angiogenesis in ovo. Int J Nanomed. 2011;6:3041–3048. doi: 10.2147/IJN.S25528 [DOI] [PMC free article] [PubMed] [Google Scholar]
- 21.Inoue J, Inazawa J. Cancer-associated miRNAs and their therapeutic potential. J Hum Genet. 2021;66(9):937–945. doi: 10.1038/s10038-021-00938-6 [DOI] [PubMed] [Google Scholar]
- 22.Banelli B, Forlanim A, Allemanni G, Morabito A, Pistillo MP, Romani M. MicroRNA in glioblastoma: an overview. Int J Genomics. 2017;2017:7639084. doi: 10.1155/2017/7639084 [DOI] [PMC free article] [PubMed] [Google Scholar]
- 23.Tluli O, Al-Maadhadi M, Al-Khulaifi AA, et al. Exploring the role of microRNAs in glioma progression, prognosis, and therapeutic strategies. Cancers. 2023;15(17):4213. doi: 10.3390/cancers15174213 [DOI] [PMC free article] [PubMed] [Google Scholar]
- 24.Lei Q, Yang Y, Zhou W, et al. MicroRNA-based therapy for glioblastoma: opportunities and challenges. Eur J Pharmacol. 2023;938:175388. doi: 10.1016/j.ejphar.2022.175388 [DOI] [PubMed] [Google Scholar]
- 25.Kutwin M, Sosnowska M, Ostrowska A, et al. Influence of GO-antisense miRNA-21 on the expression of selected cytokines at glioblastoma cell lines. Int J Nanomed. 2023;18:4839–4855. doi: 10.2147/IJN.S419957 [DOI] [PMC free article] [PubMed] [Google Scholar]
- 26.Chen M, Medarova Z, Moore A. Role of microRNAs in glioblastoma. Oncotarget. 2021;12(17):1707–1723. doi: 10.18632/oncotarget.28039 [DOI] [PMC free article] [PubMed] [Google Scholar]
- 27.Yang N. An overview of viral and nonviral delivery systems for microRNA. Int J Pharm Investig. 2015;5(4):179–181. doi: 10.4103/2230-973X.167646 [DOI] [PMC free article] [PubMed] [Google Scholar]
- 28.Hao Z, Fan W, Hao J, et al. Efficient delivery of micro RNA to bone-metastatic prostate tumors by using aptamer-conjugated atelocollagen in vitro and in vivo. Drug Deliv. 2016;23(3):874–881. doi: 10.3109/10717544.2014.920059 [DOI] [PubMed] [Google Scholar]
- 29.Yuan Y, Makita N, Cao D, Mihara K, Kadomatsu K, Takei Y. Atelocollagen-mediated intravenous siRNA delivery specific to tumor tissues orthotopically xenografted in prostates of nude mice and its anticancer effects. Nucleic Acid Ther. 2015;25(2):85–94. doi: 10.1089/nat.2014.0526 [DOI] [PubMed] [Google Scholar]
- 30.Takeshita F, Patrawala L, Osaki M, et al. Systemic delivery of synthetic microRNA-16 inhibits the growth of metastatic prostate tumors via downregulation of multiple cell-cycle genes. Mol Ther. 2010;18(1):181–187. doi: 10.1038/mt.2009.207 [DOI] [PMC free article] [PubMed] [Google Scholar]
- 31.Hoseini-Ghahfarokhi M, Mirkiani S, Mozaffari N, et al. Applications of graphene and graphene oxide in smart drug/gene delivery: is the world still flat? Int J Nanomed. 2020;15:9469–9496. doi: 10.2147/IJN.S265876 [DOI] [PMC free article] [PubMed] [Google Scholar]
- 32.Costinas C, Salagean CA, Cotet LC, et al. Insights into the stability of graphene oxide aqueous dispersions. Nanomaterials. 2022;12(24):4489. doi: 10.3390/nano12244489 [DOI] [PMC free article] [PubMed] [Google Scholar]
- 33.Liu Z, Robinson JT, Sun X, Dai H. PEGylated nanographene oxide for delivery of water-insoluble cancer drugs. J Am Chem Soc. 2008;130(33):10876–10877. doi: 10.1021/ja803688x [DOI] [PMC free article] [PubMed] [Google Scholar]
- 34.Lee SWL, Paoletti C, Campisi M, et al. MicroRNA delivery through nanoparticles. J Control Release. 2019;313:80–95. doi: 10.1016/j.jconrel.2019.10.007 [DOI] [PMC free article] [PubMed] [Google Scholar]
- 35.Choi HY, Lee TJ, Yang GM, et al. Efficient mRNA delivery with graphene oxide-polyethylenimine for generation of footprint-free human induced pluripotent stem cells. J Control Release. 2016;235:222–235. doi: 10.1016/j.jconrel.2016.06.007 [DOI] [PubMed] [Google Scholar]
- 36.Niccolini B, Palmieri V, De Spirito M, Papi M. Opportunities offered by graphene nanoparticles for microRNAs delivery for amyotrophic lateral sclerosis treatment. Materials. 2021;15(1):126. doi: 10.3390/ma15010126 [DOI] [PMC free article] [PubMed] [Google Scholar]
- 37.Liu J, Cui L, Losic D. Graphene and graphene oxide as new nanocarriers for drug delivery applications. Acta Biomater. 2013;9(12):9243–9257. doi: 10.1016/j.actbio.2013.08.016 [DOI] [PubMed] [Google Scholar]
- 38.Chong ZX, Yeap SK, Ho WY. Transfection types, methods and strategies: a technical review. PeerJ. 2021;9:e11165. doi: 10.7717/peerj.11165 [DOI] [PMC free article] [PubMed] [Google Scholar]
- 39.Jhanwar-Uniyal M, Gellerson O, Bree J, Das M, Kleinman G, Gandhi CD. Defining the role of mTOR pathway in the regulation of stem cells of glioblastoma. Adv Biol Regul. 2023;88:100946. doi: 10.1016/j.jbior.2022.100946 [DOI] [PubMed] [Google Scholar]
- 40.Lee J, Yim Y, Kim S, et al. HIn-depth investigation of the interaction between DNA and nano-sized graphene oxide. Carbon. 2016;97:92–98. doi: 10.1016/j.carbon.2015.07.093 [DOI] [Google Scholar]
- 41.H RJ. Electro kinetics and zeta potential. In: Foundations of Colloid Science. Oxford University Press. 2001;2:376–377. [Google Scholar]
- 42.Ou L, Lin H, Song Y, Tan G, Gui X, Li EA. Efficient miRNA inhibitor with GO-PEI nanosheets for osteosarcoma suppression by targeting PTEN. Internat J Nanomed. 2020;5131–5146. doi: 10.2147/IJN.S257084 [DOI] [PMC free article] [PubMed] [Google Scholar] [Retracted]
- 43.Paulmurugan R, Ajayan PM, Liepmann D, Renugopalakrishnan V. Intracellular microRNA quantification in intact cells: a novel strategy based on reduced graphene oxide based fluorescence quenching. MRS Commun. 2018;3(3):642–651. doi: 10.1557/mrc.2018.120 [DOI] [PMC free article] [PubMed] [Google Scholar]
- 44.Alamdari-Palangi V, Amini R, Karami H. MiRNA-7 enhances erlotinib sensitivity of glioblastoma cells by blocking the IRS-1 and IRS-2 expression. J Pharm Pharmacol. 2020;72(4):531–538. doi: 10.1111/jphp.13226 [DOI] [PubMed] [Google Scholar]
- 45.Prasad G, Sottero T, Yang X, et al. Inhibition of PI3K/mTOR pathways in glioblastoma and implications for combination therapy with temozolomide. Neuro Oncol. 2011;13(4):384–392. doi: 10.1093/neuonc/noq193 [DOI] [PMC free article] [PubMed] [Google Scholar]
- 46.Lamming DW. Inhibition of the mechanistic target of rapamycin (mTOR)-rapamycin and beyond. Cold Spring Harb Perspect Med. 2016;6(5):a025924. doi: 10.1101/cshperspect.a025924 [DOI] [PMC free article] [PubMed] [Google Scholar]
- 47.Jimeno A, Kulesza P, Wheelhouse J, et al. Dual EGFR and mTOR targeting in squamous cell carcinoma models, and development of early markers of efficacy. Br J Cancer. 2007;96(6):952–959. doi: 10.1038/sj.bjc.6603656 [DOI] [PMC free article] [PubMed] [Google Scholar]
- 48.Eckerdt FD, Bell JB, Gonzalez C, et al. Combined PI3Kα-mTOR Targeting of glioma stem cells. Sci Rep. 2020;10(1):21873. doi: 10.1038/s41598-020-78788-z [DOI] [PMC free article] [PubMed] [Google Scholar]
- 49.Carnero A, Blanco-Aparicio C, Renner O, Link W, Leal JF. The PTEN/PI3K/AKT signalling pathway in cancer, therapeutic implications. Curr Cancer Drug Targets. 2008;8(3):187–198. doi: 10.2174/156800908784293659 [DOI] [PubMed] [Google Scholar]
- 50.Qian X, Li X, Shi Z, et al. PTEN suppresses glycolysis by dephosphorylating and inhibiting autophosphorylated PGK1. Mol Cell. 2019;76(3):516–527. doi: 10.1016/j.molcel.2019.08.006 [DOI] [PubMed] [Google Scholar]
- 51.Abadi AJ, Zarrabi A, Gholami MH, et al. small in size, but large in action: microRNAs as potential modulators of PTEN in breast and lung cancers. Biomolecules. 2021;11(2):304. doi: 10.3390/biom11020304 [DOI] [PMC free article] [PubMed] [Google Scholar]
- 52.Liu Z, Jiang Z, Huang J, et al. miR-7 inhibits glioblastoma growth by simultaneously interfering with the PI3K/ATK and Raf/MEK/ERK pathways. Int J Oncol. 2014;44(5):1571–1580. doi: 10.3892/ijo.2014.2322 [DOI] [PubMed] [Google Scholar]


