

Abstract
Purpose
To image vascular features of retinitis pigmentosa (RP) using optical coherence tomography angiography (OCTA).
Methods
Patients with RP were imaged by spectral domain optical coherence tomography based angiography (OCTA). The optical microangiography (OMAG) algorithm was applied to scanned datasets to generate 3D OCTA retinal angiograms, i.e., OMAG angiograms. Motion tracking was used to minimize artifacts due to eye movement, and large field of view OMAG angiograms were achieved through a montage scanning protocol. For better visualization, depth volumes were segmented to separate the superficial retinal layers from deep outer retinal layers. The choriocapillaris and other choroidal layers were also segmented. To investigate the changes in retinal architecture, the inner segment/outer segment (IS/OS) junction to RPE layer was segmented to generate en face structural images through averaging intensity projection. Color fundus images and/or Goldmann visual fields were available for comparison of the findings to OMAG images.
Results
A total of 25 eyes (13 patients, seven women and six men) diagnosed with RP at various stages were enrolled in this study from October 2014 to January 2016 and imaged by OCTA. The resulting OMAG angiograms provided detailed visualization of retinal and choroidal vascular networks presented within the retina and choroid in a large field of view (FOV) (~6.7 mm × 6.7 mm). All patients with a severity score greater than 3 showed abnormal microvasculature in both deep retinal and choroidal layers on OMAG images. Images of patients with a score of 4 indicating only peripheral abnormalities demonstrated relatively normal vasculature networks. Microvascular changes in the retinal and choroidal vasculature correlate with structural changes in the slab from IS/OS junction to RPE layer.
Conclusions
OCTA is useful in evaluating the microvascular changes in a large FOV encompassing the maculae of patients with RP. The large FOV of OMAG angiograms, enabled by the motion tracking, provides visualization of high definition and high resolution microvascular networks at varying stages of RP. Microvascular imaging may have significant utility in the diagnosis and monitoring of disease progression in RP patients.
Keywords: OCT-angiography, Ocular imaging, Retinitis pigmentosa, Retinal and choroidal vascular map
Introduction
Retinitis pigmentosa (RP) is characterized by the progressive loss of photoreceptors, which eventually results in blindness [1–3]. RP affects over 1.5 million people worldwide and can be inherited in numerous ways. Patients with RP typically present with nyctalopia followed by progressive constriction of their visual field, leading to tunnel vision and eventual loss of central vision. Many patients are legally blind by about age 40 years due to severely constricted visual fields. On clinical examination, the fundus typically shows bone-spicule deposits in the periphery of the retina, a pale optic nerve and attenuation of retinal vessels. ERG shows reduced rod and cone response amplitudes coupled with a delay in their timing [4]. Histopathologic studies of eyes from RP patients have revealed degeneration of photoreceptors and retinal pigment epithelium, as well as extensive vascular remodeling in the retina and choroid [5–7].
Fluoroscein angiography (FA) demonstrates abnormal retinal and choroidal vasculature in patients with RP, including prolonged transit time, narrowed vessels and lower concentrations of dye [8]. Fundus autofluorescence is also useful in evaluating the retinal function in the RP patients. Photoreceptor loss corresponds to hypoautofluorescence in the peripheral fundus. Additionally, areas of hyperautofluorescence, corresponding to increased lipofuscin in the RPE, have the lowest ERG amplitudes in RP patients [9, 10].
Optical coherence tomography (OCT) has been used to evaluate retinitis pigmentosa to reveal decreased foveal thickness, interruption of the IS/OS junction, and significantly reduced choroidal thickness [4]. The OCT structural changes are shown to correlate with the deterioration of sight. While these measurements are useful, OCT does not possess the ability to visualize microvascular changes during RP progression.
OCT angiography (OCTA) is a recent advance that has become increasingly important in ophthalmic imaging used to visualize retinal vascular networks without the need for contrasting dyes [11, 12]. Optical microangiography (OMAG) is one of the leading algorithms of OCTA, which uses both the amplitude and phase information in the OCT signal, i.e. complex signal, to extract the functional blood vessel networks within microcirculatory tissue beds [13, 14]. OMAG has been used successfully to map the vascular networks in both retina and choroid, comparable to and with higher depth resolution than FA images [15–20]. In this study, we explore the application of OMAG to visualize the vascular involvement in RP and to assess the relationship between vascular abnormalities and visual field changes.
Methods
Patients with a clinical diagnosis of RP were enrolled in this prospective, observational study at University of Washington Eye Institute from October 2014 to January 2016. All the patients received comprehensive ocular examinations, including visual acuity (VA), intraocular pressure (IOP) measurement, slit lamp and fundus examination, Goldmann visual field (GVF), color fundus imaging, fluorescein angiography, ERG and spectral domain OCT (SD-OCT, Heidelberg Engineering GmbH, Heidelberg, Germany).
The RP was clinically diagnosed with the presence of nyctalopia, characteristic fundus appearance, and corresponding peripheral visual field loss with central and often inferotemporal sparing on GVF testing. Patients with ocular diseases other than RP and any history of ocular surgery, ocular trauma, microvascular disease (diabetes mellitus, hypertension, vein occlusion) were excluded. The OCTA imaging was approved by the Institutional Review Board of the University of Washington and adhered to the tenets of the Declaration of Helsinki. Informed consent was obtained from all study subjects before OCTA imaging.
All RP patients underwent OCTA imaging with an SD-OCT angiography prototype system [a modified CIRRUS 5000 HD-OCT system provided by Carl Zeiss Meditec Inc., (Dublin, CA, USA)]. The system worked at an 840 nm central wavelength with an imaging speed of 68,000 A-scans/s. The axial and lateral resolutions were ~5 μm and ~15 μm in tissue, respectively. A repeated B-mode scanning protocol (four repeats) was adopted to acquire 3D datasets for extracting vascular networks by the OMAG algorithm [13, 14]. To obtain a wide field of view vascular images, we employed a montage scanning protocol (M × M cubes) in this study as described previously in elsewhere [15, 16]. The FOV for each cube was 2.4 × 2.4 mm2. One of the important features of the system is that it is equipped by a FastTrac™ technique, which is essential to minimize the artifacts induced by involuntary eye movement.
Because outer retinal degeneration can be dramatic in RP, we chose to examine the microvasculature between the outer and inner retina separately. In doing so, semi-automatic software was used to segment the resulting 3D data into the depth layers (or volumes) [21]. We segmented the retina into a superficial retinal layer (SRL), from inner limiting membrane (ILM) to the outer border of inner plexiform layer (IPL), and a deep outer retinal layer (DRL), from the inner border of outer plexiform layer (OPL) to the inner border of retina pigment epithelium (RPE). We also segmented the choriocapillaris (CC, 20 μm slab below the RPE) and choroidal layers. The definition of each layer was similar to that in our previous publication [17]. The maximum intensity projection (MIP) was applied to generate the en face vascular image of each segmented layer. Before MIP, a 3 × 3 × 3 pixel-kernel Gaussian filter was applied to enhance the quality of the images. One additional layer based on structural images for analyzing the RP progression was also segmented from the IS/OS junction to the RPE layer, which is a thin layer demonstrated to be useful in the investigation of RP [4]. The average intensity projection (AIP) was applied for this structural slab to generate the en face structural image in order to emphasize the loss of photoreceptors as well as the change in thickness.
Visual fields were scored according to Goldmann perimetry similar to what as previously described by Oishi et al. [5] The isopter used was III/4e. We defined a central 30-degree circle as the central visual field and outside the 40-degree circle as the peripheral visual field. The scoring system was as follows: Score 1 (central visual field not more than 10 degrees in diameter); Score 2 (central visual field no more than 20 degrees plus peripheral visual field); Score 3 (central visual field <30 degrees in diameter with or without a peripheral visual field); and Score 4 (remaining central visual field >30 degrees plus a peripheral visual field).
Results
A total of 25 eyes (13 patients, seven women and six men) were enrolled in this study. Patient ages ranged between 22 and 66 years with an average of 50.3 years. Six eyes were diagnosed with score 1, two eyes with score 2, three eyes with score 3, and 14 eyes with score 4. One eye was unable to be scored, as the vision was too poor to fixate reliably for visual field test testing. OCTA scans were performed on all the patients to generate 3D OMAG angiograms. Five cases with retinitis pigmentosa at different stages of the disease progression with characteristic features are presented below.
Case #1 (Score 4)
A 23-year-old woman with decreased peripheral vision in both eyes for 2 years had a best corrected visual acuity of 20/20 in right eye (OD) and 20/25 in her left eye (OS). A full field ERG was performed and revealed mildly decreased rod and cone amplitudes OD and absent or trace responses OS. SD-OCT images of the left eye showed a central macular thickness at 232 microns with blunted foveal contour and striking loss of outer retina layers throughout macula with mild preservation sub-foveally.
Examination of the more mildly affected right eye showed a fairly normal appearance of macula (Fig. 1a), but constriction in Goldmann visual field testing. The 3 × 3 montage OCTA imaging was performed at one routine clinical visit to produce OMAG angiograms with a FOV of 6.7 mm × 6.7 mm. The results are shown in Fig. 1b, c, and d; f, g, and h). The cross-sectional OCT image (Fig. 1 h) depicted no obvious retinal structure changes in all layers. In the meantime, OMAG images demonstrated similar vascular network appearance to the normal eyes both in the SRL and DRL layers in the field of imaging. During imaging, the scanning cube in the top-right corner was not focused well due to the z-direction movements of the patient as shown in the image. The same findings were observed in the choroid with a dense choriocapillaris (Fig. 1f) present. The color images presented the composited images with different layers. The color-coding information is shown in Fig. 1h.
Fig. 1.
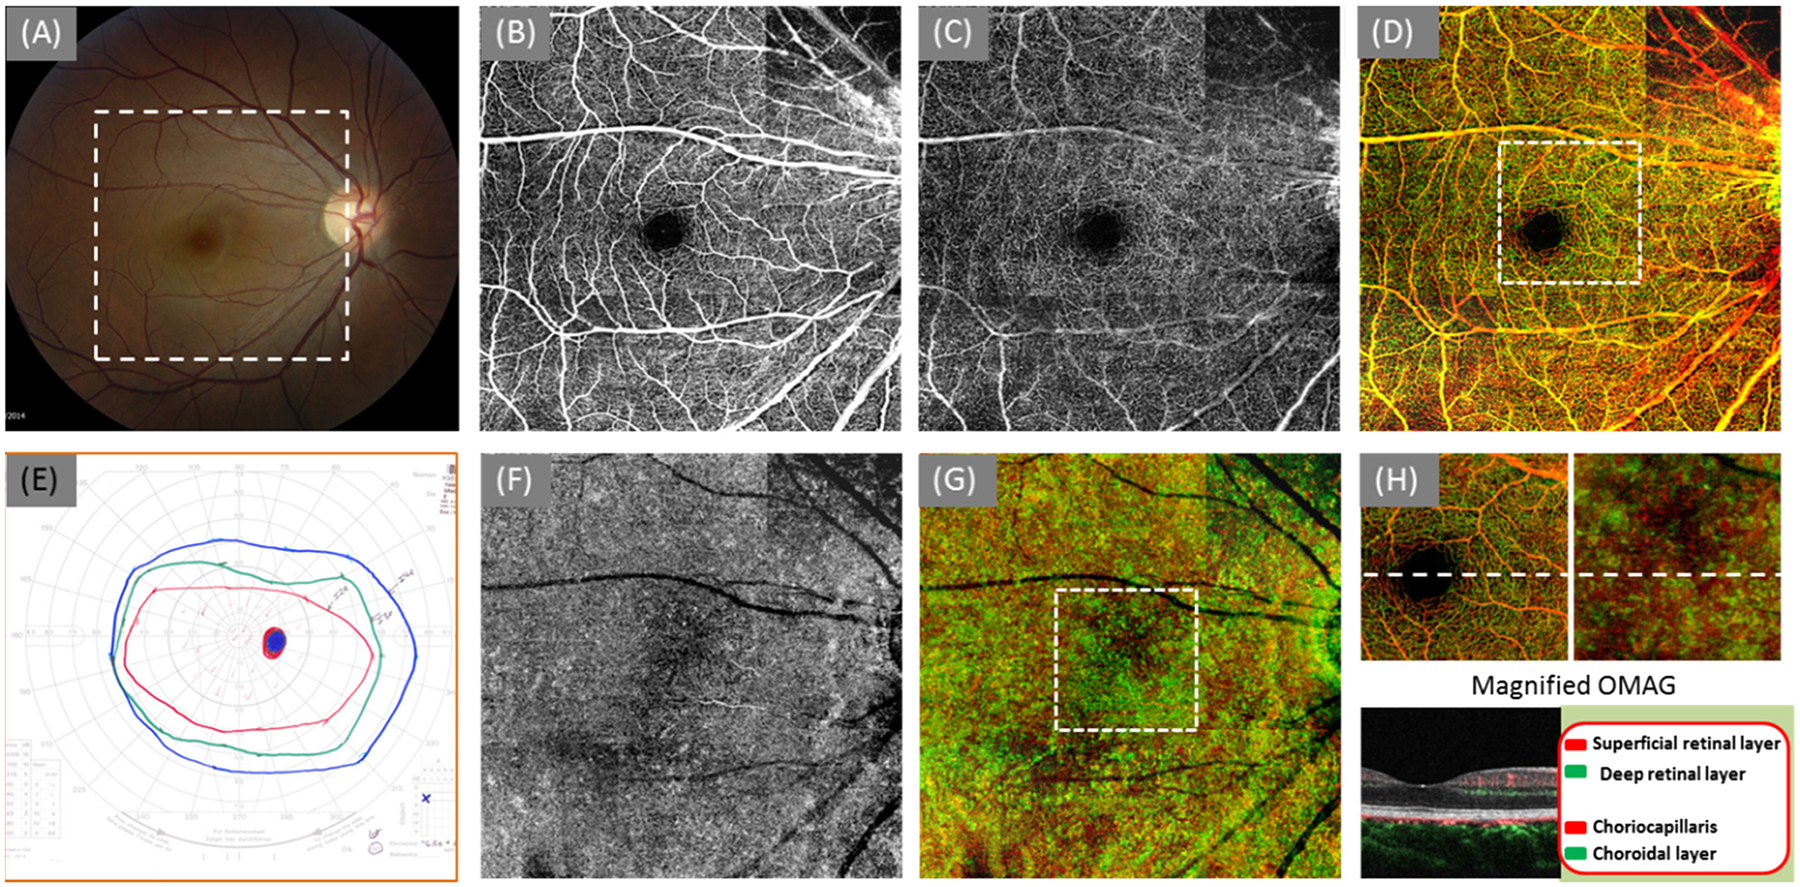
OMAG angiograms of a 22-year-old woman with RP score 4 (OD). (a) Color fundus image; (b) OMAG angiogram of the SRL layer; (c) OMAG angiogram of the DRL layer; (d) the whole retinal layer coded with colors coding scheme shown in the bottom right corner; (e) Goldman visual field; (f) OMAG angiogram of the CC layer (20 μm slab beneath the RPE layer); (g) OMAG result of the whole choroid coded with colors including choriocapillaris and choroid; (h) the magnified OMAG angiogram (2.4 mm × 2.4 mm) at the region marked by the dash square in (d) and (g). The cross-sectional image located at the dash line showing the segmentation layer and color-coding information. The size of the OMAG angiograms in (b), (c), (d), (f), and (g) is ~6.7 mm × 6.7 mm
Case #2 (Score 3)
A 66-year-old woman with a family history of RP presented for a routine eye examination. The visual acuity was 20/20 (OD) and 20/30 (OS). The dilated fundus exam was consistent with typical RP findings: pale optic nerves, attenuated vessels and bone spicules in the periphery in both eyes (OU). Full-field ERGs revealed absence to near absence of photopic and scotopic responses in both eyes. GVF testing demonstrated markedly diminished visual field in both eyes. OCTA imaging was performed at this visit to generate OMAG angiograms. The cross-sectional OCT image showed disturbances of the ELM, IS/OS and OS/RPE layers in the peripheral macular (Fig. 2h, which is located at the temporal region). While the vascular appearance in the SRL layer is relatively normal (Fig. 2b), the loss of capillaries in the DRL layer in the peripheral macula (Fig. 2c and d) is apparent. Switching to the choroid, due to the loss of ELM, IS/OS, and OS/RPE layers, the penetration of OCT light in the peripheral macula is increased. As a result, the choriocapillaris were observed in a greater detail in the peripheral region compared to the central macular region (the dark region in the color image of Fig. 2g). The relatively intact ring-shaped capillary network in the DRL layer (Fig. 2c) corresponds to the intact choriocapillaris in the central macula. This OMAG finding agrees with the GVF showing III4e isopter in the central macular in Fig. 2e. The clear observation of choriocapillaris by OMAG in the peripheral macular region was most likely caused by the loss of photoreceptors, thinning of retinal layers, and loss of the pigment, leading to increased light penetration into choroid.
Fig. 2.
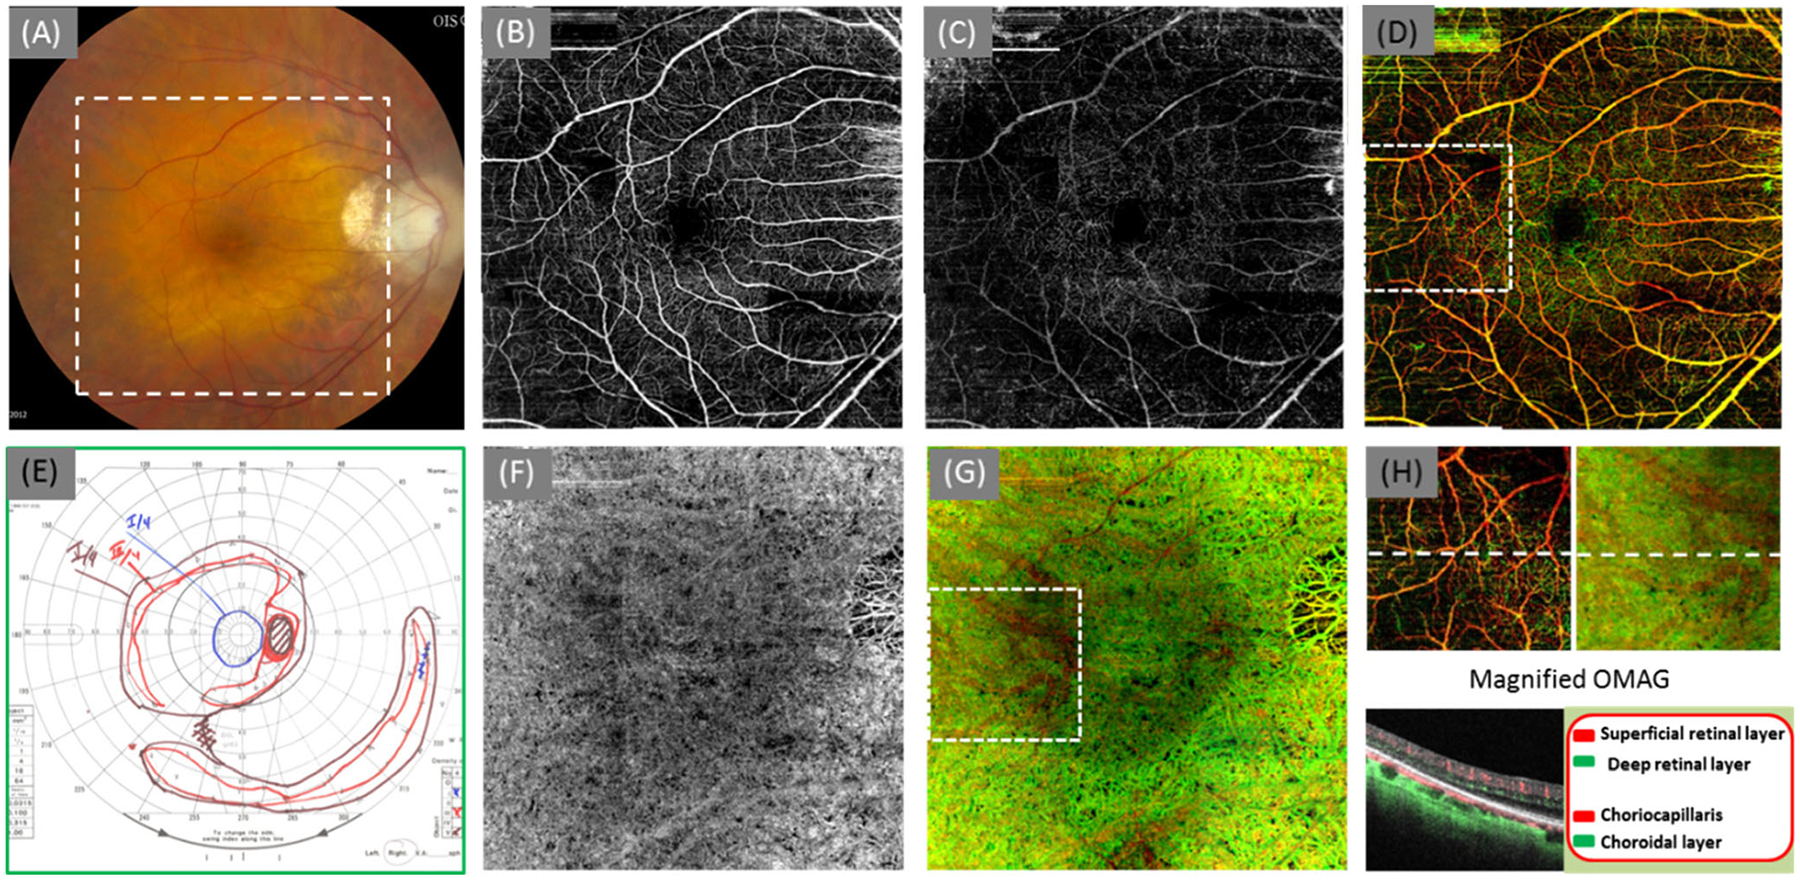
OMAG angiograms of a 65-year-old woman with RP score 3 (OD). (a) Color fundus image; (b) OMAG angiogram of the SRL layer; (c) OMAG angiogram of the DRL layer, where the capillaries in the peripheral region were lost. (d) the whole retinal layer coded with colors coding scheme shown in the bottom right corner; (e) Goldman visual field ; (f) OMAG angiogram of the CC layer (20 μm slab beneath the RPE layer); (g) OMAG result of the whole choroid coded with colors including choriocapillaris and choroid; (h) the magnified OMAG angiograms (2.4 mm × 2.4 mm) at the region marked by the dash square in (d) and (g). The cross-sectional image located at the dash line showing the segmentation layer and color-coding information. The size of the OMAG angiograms in (b), (c), (d), (f), and (g) is ~6.7 mm × 6.7 mm
To investigate further the correspondence between OMAG angiograms and OCT structural image, the en face structural image from the IS/OS junction to the RPE layer was generated (Fig. 3a). Because of the loss of IS/OS junction and the pigmentary changes in the peripheral regions, the layer becomes thinner in the periphery compared to the central macula. The average intensity projection (AIP) of this slab gives an opportunity to display the thickness variations across the field of view, where the darker appearance in (A) indicates the thinning of this slab. By delineating the outline of the brightness in the structural AIP image, the relatively intact IS/OS junction was demonstrated within the region marked by the white dashed line. In addition, the relatively intact vascular distribution both in retinal (Fig. 3b) and choroid (Fig. 3c) corresponds very well with the structural image (Fig. 3a).
Fig. 3.
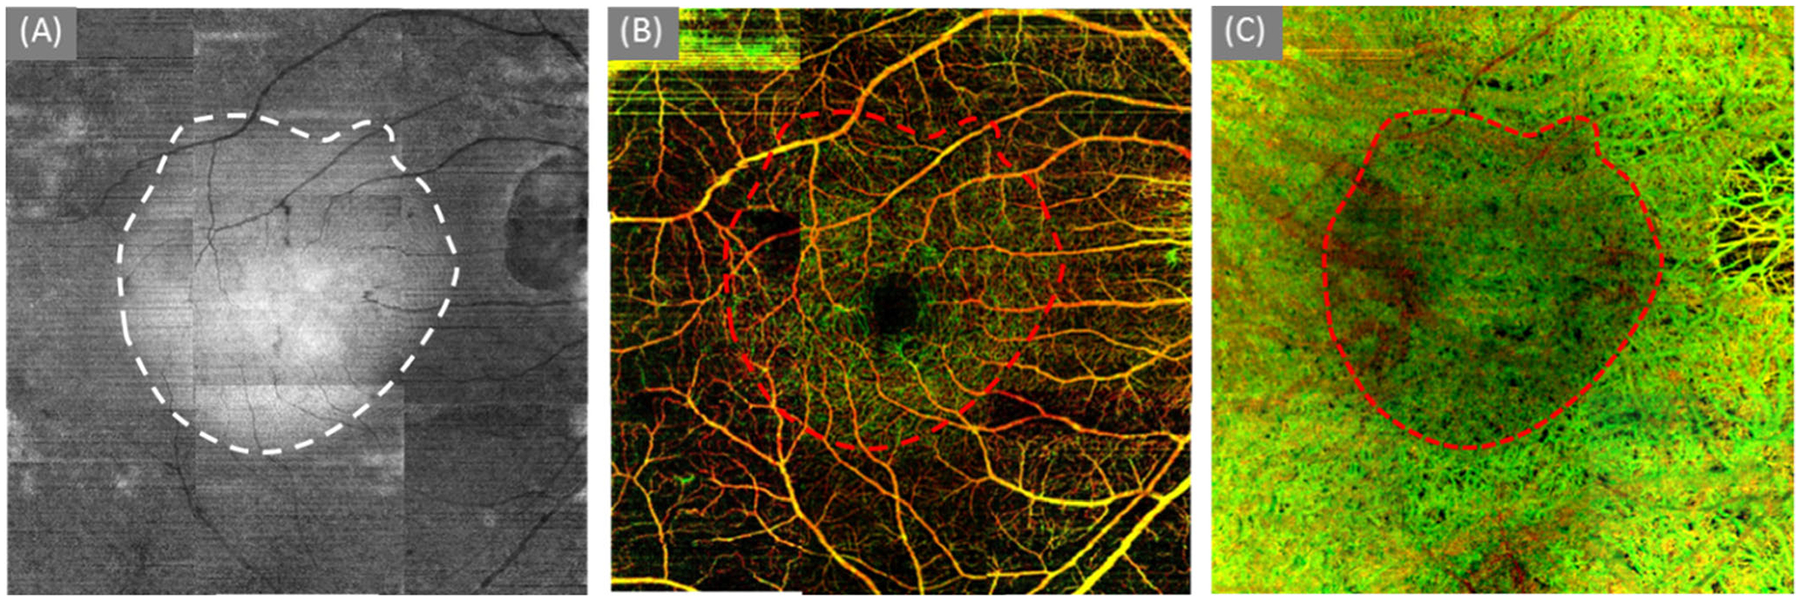
The delineation of the relatively intact region. (a) the en face structural image of a slab from IS/OS junction to RPE layer; (b) color-coded retinal layer (Fig. 2d); and (c) the color-coded choroidal layer (Fig. 2g)
Case #3 (Score 2)
A 44-year-old woman with a strong family history of RP presents for follow-up examination. She was diagnosed with RP in 2008. Her visual acuity was 20/20 OU. The dilated fundus exam (Fig. 4a) was consistent with RP with attenuated vessels and bone spicule in the periphery in both eyes. GVF testing (Fig. 4b) revealed partial ring scotoma with sparing of central 20 degrees OS. Her right eye also showed scotoma with sparing of central 10–15 degrees. The en face OMAG angiograms OS (Fig. 4d, e, and f; g, h, and i) showed good agreement with the GVF of ring-shaped vision. The cross-sectional OCT image located at the temporal region with the white box in Fig. 4f demonstrated thinning of the outer retinal layer and loss of the IS/OS and OS/ RPE junction (Fig. 4c, white arrow). Capillary loss was observed in the peripheral macular region of the DRL layer (Fig. 4e) and formed a ring-shape. The map of the choriocapillaris shown in Fig. 4g appears to be a compact pattern in the peripheral macular region, where a similar ring-shape in Fig. 4e was demonstrated. The thinning of the outer retina layer and the pigment loss in the RPE in the peripheral region allows greater penetration into the choroid, and the OMAG images contrast the choroidal vessels more clearly compared to the central region (Fig. 4h). The relatively intact ring-shaped vascular network in the central macula corresponds well to the GVF (Fig. 4b).
Fig. 4.

OMAG angiograms of a 43-year-old woman with RP score 2 (OS). (a) color fundus image; (b) Goldman visual field test; (c) the magnified OMAG angiograms (2.4 mm × 2.4 mm) at the region marked by the dashed square in (f). The cross-sectional image located at the dash line showing the segmentation layer and color-coding information. (d) OMAG angiogram of the SRL layer; (e) OMAG angiogram of the DRL layer, where the capillaries in the peripheral region were lost. (f) the whole retinal layer coded with colors coding scheme shown in the bottom right corner; (g) OMAG angiogram of the CC layer (20 μm slab beneath the RPE layer); (h) OMAG angiogram of the choroid layer; (i) OMAG angiogram of the whole choroid coded with colors including choriocapillaris and choroid. The size of the OMAG angiograms in (d), (e), (f), (g), (h), and (i) is ~6.7 mm × 8.6 mm
The en face structural image shown in Fig. 5a demonstrates a dome-shape region that is most likely caused by the peripheral thinning of outer retina layer and loss of pigment in the RPE. The shape is outlined both on structural (Fig. 5a) and vascular images (Fig. 5b and c). Comparing among the three shaped regions, the same conclusion was made as Case #2 (Score 3).
Fig. 5.
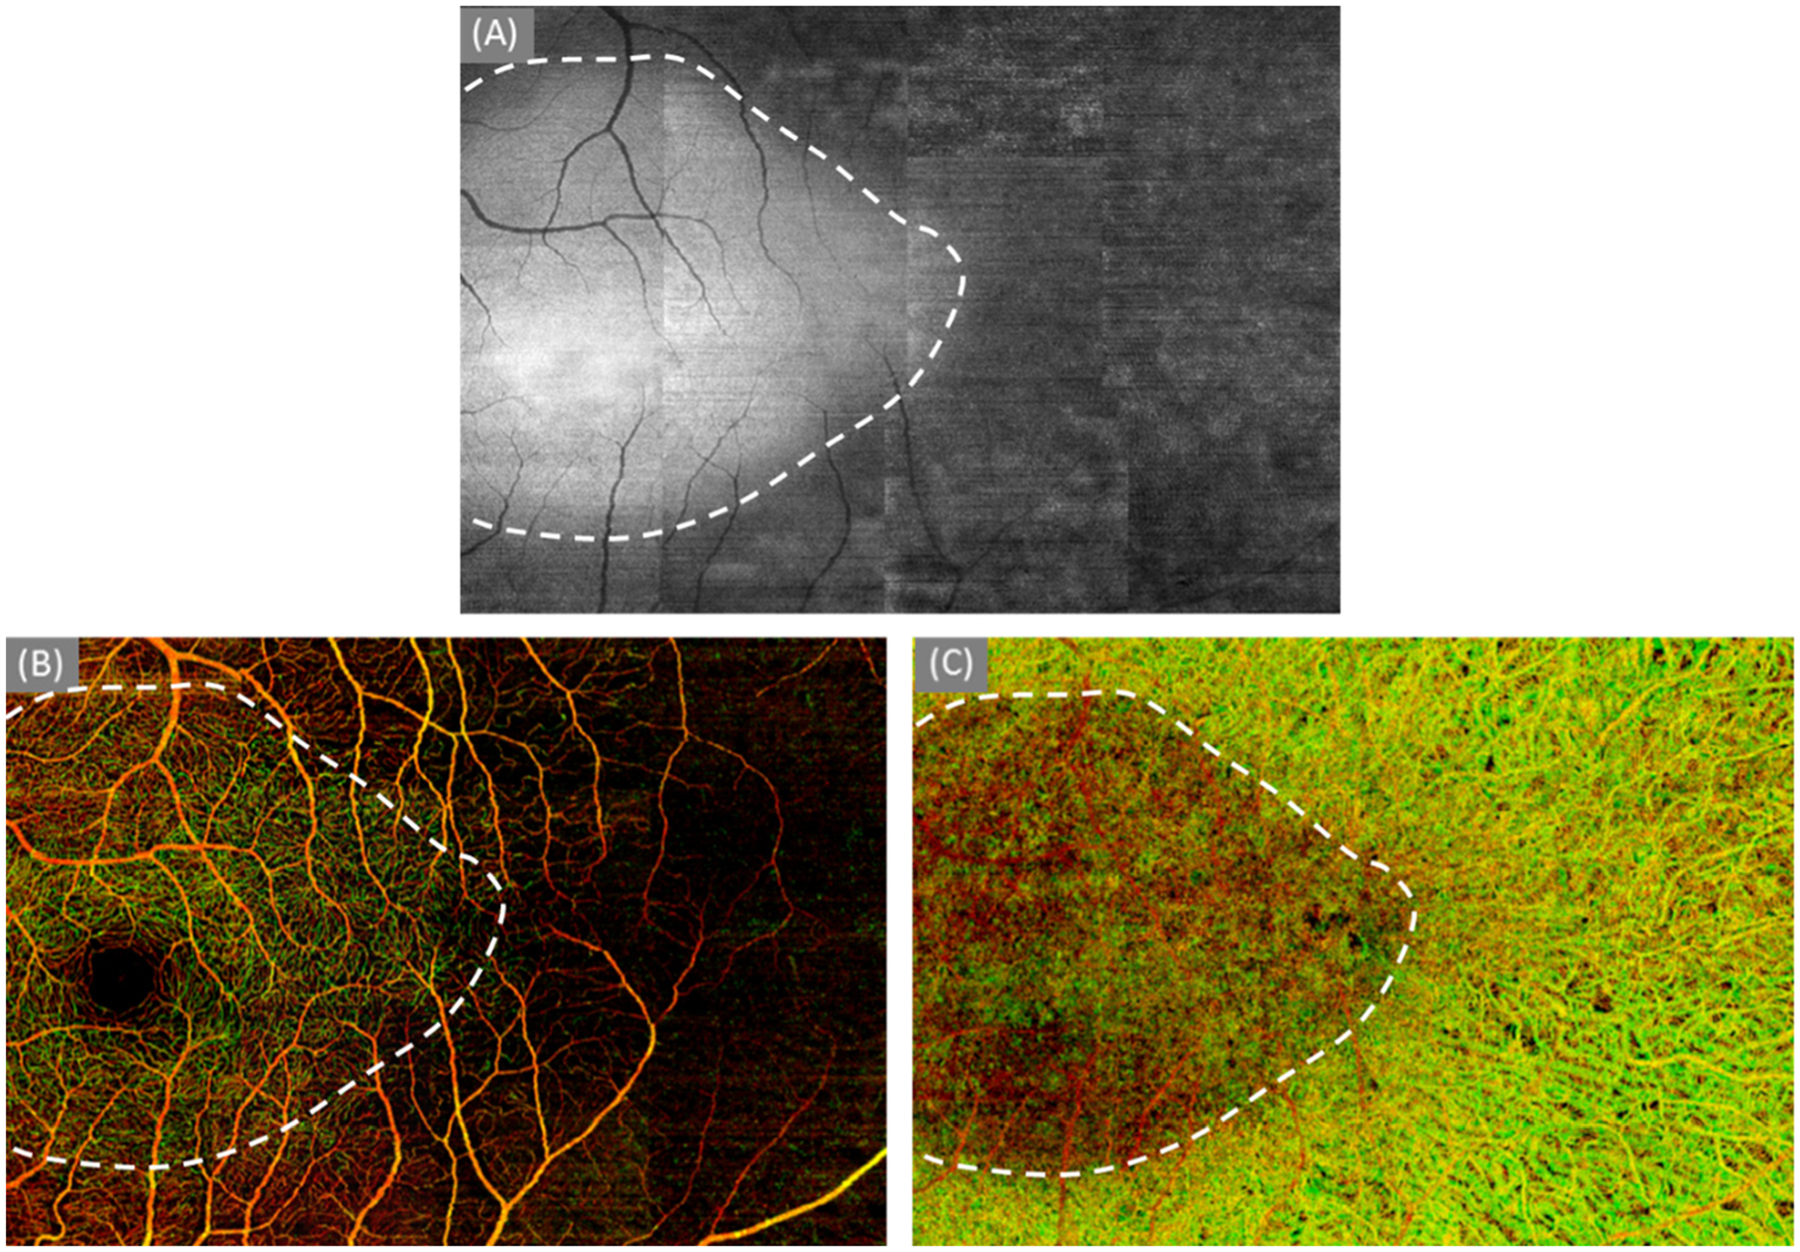
The delineation of the relatively intact region. (a) the en face structural image of a slab from IS/OS junction to RPE layer; (b) color-coded retinal layer (Fig. 3f); and (c) the color-coded choroidal layer (Fig. 3i)
Case #4 (Score 1)
A 34-year-old man was diagnosed with RP at the age of 16 years. He has experienced progressive loss of peripheral vision, worsening night vision, and prolonged dark adaptation. His visual acuity was 20/50 OD and 20/40 OS. The dilated fundus exam showed attenuated vessels and bone spicules in the periphery of both eyes. The GVF testing in the right eye (Fig. 6a) revealed 5–7 degrees of central vision remaining on either side of fixation with a large absolute scotoma with sparing of small crescents 50 degrees from fixation both nasally and temporally. Left eye testing revealed 7–10 degrees of central vision remaining on either side of fixation, large absolute scotoma with sparing of small crescents (relatively larger than in the right eye) 40+ degrees from fixation nasally and 70+ degrees temporally. OCTA imaging was performed on the patient to produce OMAG angiograms, which showed almost complete loss of functional vascular networks in the DRL layer (Fig. 6c). However, relatively normal vessel network remained in the SRL layer (Fig. 6b). The choroidal images were similar to the Case #3 (Score 2), but with a much smaller ring-shape region, demonstrating the severe loss of photoreceptors in the outer retina. The sparse large choroidal vessels (Fig. 6g) were highlighted temporally and inferiorly indicating a severe loss of pigment in the RPE layer and a total loss of photoreceptors therein. The dense choroidal vessels appearing in the central macula indicate a partial loss of pigment associated with partial loss of photoreceptors. The color retinal image (Fig. 6d) demonstrates that functional vessels remain only within the DRL layer of a small region central to the fovea.
Fig. 6.

OMAG angiograms of a 33-year-old man with RP score 1 (OD). (a) Goldman visual field; (b) OMAG angiogram of the SRL layer; (c) OMAG angiogram of the DRL layer; (D) the whole retinal layer coded with colors coding scheme shown in the bottom left; (e) the magnified OMAG angiograms (2.4 mm × 2.4 mm) at the region marked by the dashed square in (d) and (h). The cross-sectional image located at the dash line showing the segmentation layer and color-coded information. (f) OMAG angiogram of choriocapillaris layer (20 μm beneath the RPE layer); (g) OMAG angiogram of choroidal layer, (h) OMAG angiogram of the whole choroid coded with colors; The size of the OMAG angiograms in (b), (c), (d), (f), (g), and (h) is ~6.7 mm × 6.7 mm
Case #5 (End stage)
A 66-year-old man with advanced RP presented for follow-up examination. He was diagnosed with RP when he was 41 years old. The visual acuity was 20/500 OD and 20/300 OS. The dilated fundus exam showed attenuated vessels and bone spicules in the periphery of both eyes. GVF testing OS revealed extensive central field loss between 20–30 degrees of fixation and central field sparing directly in area of fixation. The OMAG angiograms showed a total loss of capillaries in the DRL layer (Fig. 7b) and partial loss of capillaries in the temporal region in the SRL layer (Fig. 7a). Note that the signal appearing in the OMAG angiogram of the DRL layer was due to the tailing artifacts originated from the SRL layer. The severe loss of the pigment in the RPE in the peripheral region was observed from the choroidal OMAG angiograms (Fig. 7d and e) indicated by the sparse large choroidal vessels. In addition, the loss of the choroicapillaris (Fig. 7d) is more severe in the peripheral region than the central macular region. The absence of capillaries in the deep retina and choriocapillaris contributes to the poor vision of the patient.
Fig. 7.

OMAG angiograms of a 65-year-old man with end stage RP (OD). (a) OMAG angiogram of the SRL layer; (b) OMAG angiogram of the DRL layer where the capillaries were totally lost. (c) OMAG angiogram of the whole retinal layer coded with colors; (d) OMAG angiogram of choriocapillaris layer (20 μm beneath the RPE layer); (e) OMAG angiogram of the whole choroid coded with colors. Because of the loss of pigment in the RPE, the choriocapillaris and large choroidal vessels were distinctly shown in OMAG images. (f) Magnified OMAG angiograms (2.4 mm × 2.4 mm) for the region marked by the dashed square in (c) and (e). The cross-sectional image is located at the dashed line showing the segmentation layer and color-coded information. The size of the OMAG angiograms in (a), (b), (c), (d), and (e) is ~6.7 mm × 6.7 mm
Discussion
The mechanisms underlying vascular attenuation in the diseased retina remain unclear. One hypothesis is that after photoreceptor death, the oxygen requirement of the outer retina decreases and excessive oxygen reaches the inner retina causing a hyperoxic state, which in turn results in vasoconstriction. Another hypothesis suggests that primary photoreceptor death sequentially causes thinning of the outer retina [22–24]. Murakami et al. showed that decreased macular blood flow is associated with the reduction in macular visual sensitivity in patients with RP [25]. Alteration of retinal and choroidal vessels and their micro-circulation has been investigated in patients with RP. Many experimental and clinical studies, using laser Doppler flowmetry, magnetic resonance imaging, and/or ocular pulse amplitude, showed choroidal and retinal blood flow reductions in patients with RP and/or in animal models of RP [26]. Unfortunately, these changes are clinically difficult to follow because measurement of blood flow velocity and vessel tortuosity require specific devices and/or analyses that are not easily performed in the clinical settings.
In this study, we investigated the retina and choroidal vascular features in the RP patients using a ZEISS 840 nm SD-OCT angiography prototype system with a scanning speed of 68 kHz. To visualize the microvascular architecture of the depth-resolved layer of the retina and choroid, we employed an OMAG algorithm based on a complex intensity differentiation method to provide vascular details from the acquired OCT datasets. Compared to the traditional clinical imaging, OMAG images provide 3D vascular networks, as well as corresponding structural images. Detailed information about the microvascular networks in the retina and choroid can be segmented into superficial retinal, deep retinal, choriocapillaris, and choroidal layers to generate the en face images. Twenty-five eyes from 13 patients were enrolled, including six eyes diagnosed with score 1, two eyes with score 2, three eyes with score 3, and 14 eyes with score 4. OMAG en face images of all the 14 eyes with score 4 demonstrated similar vascular network appearance to the normal eyes both in the SRL and DRL layers in the field of imaging like that demonstrated case #1. Patients with RP with the severity more than score 3, had similarly abnormal microvasculature in both deep retinal layer and choroidal layer in OMAG angiograms as demonstrated above (score 3: case #2, score 2: case #3, score 1: case #4, and end stage: case #5). Because of the limited field of view (6.7 × 6.7 mm2), patients of score 4 with far peripheral abnormality was demonstrated relatively normal vascular appearance in OMAG angiograms (Fig. 1), indicating the current prototype system may not be particularly useful in this cohort of patients. In order to mitigate this problem, a wider field of view is required in future to investigate the vascular features in the early stage of RPs.
In addition, the OCTA imaging system provides detailed images with a short capture time without a need for contrasting dyes, which would give an opportunity to analyze the correlation between scotomas seen on Goldmann perimetry and OMAG. The current study showed that the OMAG angiograms were co-localized with the VF seen on Goldmann perimetry in patients with RP. The maps of retina and choroidal microvasculature were consistent with the remaining VF. Thus, OMAG may be useful to assess objectively the remaining VF. Further improvement of wide-field imaging technology and the development of analysis software may enable an accurate point-to-point comparison of OMAG imaging and retinal function.
In conclusion, OCTA is a new, non-invasive imaging technique that is capable of evaluating the microvascular network changes in the retina and choroid. OMAG angiograms provided detailed, depth-resolved information about the microvascular changes and can be used to monitor the vascular changes in the RP patients. OMAG shows loss of normal vessel architecture in the choroid and outer retinal layers that may reflect current scotoma and remaining VF, and provide findings preceding enlargement of VF defects. Thus, OMAG may provide objective information complementary to Goldmann perimetry when examining patients with RP.
Funding
NEI R01EY024158, Carl Zeiss Meditec Inc, and Research to Prevent Blindness provided financial support in the form of grant funding.
The sponsor had no role in the design or conduct of this research.
Conflict of interest
Dr. Ruikang K. Wang, Carl Zeiss Meditec (Financial support, patent, and consultant), Kowa ltd (Consultant).
Dr. Rezaei, Dr Zhang, and Dr. Chao have no disclosures.
Footnotes
Ethical approval All procedures performed in studies involving human participants were in accordance with the ethical standards of the institutional and/or national research committee and with the 1964 Helsinki declaration and its later amendments or comparable ethical standards.
Informed consent Informed consent was obtained from all individual participants included in the study.
References
- 1.Ayton LN, Guymer RH, Luu CD (2013) Choroidal thickness profiles in retinitis pigmentosa. Clin Exp Ophthalmol 41:396–403 [DOI] [PubMed] [Google Scholar]
- 2.Verhoeff FH (1931) Microscopic observations in a case of retinitis pigmentosa. Arch Ophthalmol 5:392–407 [PMC free article] [PubMed] [Google Scholar]
- 3.Cogan DG (1951) Pathology of retinitis pigmentosa. Trans Am Acad Ophthalmol Otolaryngol 54:629–661 [PubMed] [Google Scholar]
- 4.Dhoot DS, Huo S, Yuan A et al. (2012) Evaluation of choroidal thickness in retinitis pigmentosa using enhanced depth imaging optical coherence tomography. Br J Ophthalmol 97:66–69 [DOI] [PubMed] [Google Scholar]
- 5.Oishi A, Otani A, Sasahara M, Kurimoto M, Nakamura H, Kohima H, Yoshimura N (2009) Retinal nerve fiber layer thickness in patients with retinitis pigmentosa. Eye 23:561–566 [DOI] [PubMed] [Google Scholar]
- 6.Zhang Y, Harrison JM, San Emeterio Nateras O, Chalfin S, Duong TQ (2013) Decreased retinal-choroidal blood flow in retinitis pigmentosa as measured by MRI. Ophthalmology 126:187–197 [DOI] [PMC free article] [PubMed] [Google Scholar]
- 7.Marc RE, Jones BW, Watt CB, Strettoi E (2003) Neural remodeling in retinal degeneration. Prog Retin Eye Res 22:607–655 [DOI] [PubMed] [Google Scholar]
- 8.Merin S, Auerbach E (1976) Retinitis pigmentosa. Surv Ophthalmol 122:502–508 [DOI] [PubMed] [Google Scholar]
- 9.Robson AG, Saihan Z, Jenkins SA et al. (2006) Functional characterization and serial imaging of abnormal fundus autofluorescence in patients with retinitis pigmentosa and normal visual acuity. Br J Ophthalmol 90:472–479 [DOI] [PMC free article] [PubMed] [Google Scholar]
- 10.Popovic P, Jarc-Vidmar M, Hawlina M (2005) Abnormal fundus autofluorescence in relation to retinal function in patients with retinitis pigmenotsa. Graefes Arch Clin Exp Ophthalmol 243:1018–1027 [DOI] [PubMed] [Google Scholar]
- 11.Zhang A, Zhang QQ, Chen C-L, Wang RK (2015) Methods and algorithms for optical coherence tomography based angiography: a review and comparison. J Biomed Opt 20(10):100901. [DOI] [PMC free article] [PubMed] [Google Scholar]
- 12.Wei E, Jia Y, Tan O et al. (2013) Parafoveal retinal vascular response to pattern visual stimulation assessed with OCTAngiography. PLoS One 8(12), e81343. [DOI] [PMC free article] [PubMed] [Google Scholar]
- 13.Wang RK, An L, Francis P, Wilson D (2010) Depth-resolved imaging of capillary networks in retina and choroid using ultrahigh sensitive optical microangiography. Opt Lett 35(9):1467–1469 [DOI] [PMC free article] [PubMed] [Google Scholar]
- 14.An L, Subhush HM, Wilson DJ, Wang RK (2010) High-resolution wide-field imaging of retinal and choroidal blood perfusion with optical microangiography. J Biomed Opt 15(2):026011. [DOI] [PMC free article] [PubMed] [Google Scholar]
- 15.Zhang Q et al. (2015) Wide-field imaging of retinal vasculature using optical coherence tomography-based microangiography provided by motion tracking. J Biomed Opt 20(6):066008. [DOI] [PMC free article] [PubMed] [Google Scholar]
- 16.Zhang Q et al. (2016) Wide-field optical coherence tomography based microangiography for retinal imaging. Sci Rep 6, 22017. [DOI] [PMC free article] [PubMed] [Google Scholar]
- 17.Zhang Q et al. (2015) Swept source OCT angiography of neovascular macular telangiectasia type 2. Retina 35(11):2285–2299 [DOI] [PMC free article] [PubMed] [Google Scholar]
- 18.Wang RK et al. (2007) Three dimensional optical angiography. Opt Express 15:4083–4097 [DOI] [PubMed] [Google Scholar]
- 19.Huang Y et al. (2014) Swept-source OCT angiography of the retinal vasculature using intensity differentiation-based optical microangiography algorithms. Ophthalmic Surg Lasers Imaging Retina 45:382–389 [DOI] [PMC free article] [PubMed] [Google Scholar]
- 20.Thorell MR, Zhang Q, Huang Y, An L, Durbin MK, Sharma U, Stetson PF, Gregori G, Wang RK, Rosenfield PJ (2014) Swept source OCT angiography of macular telangiectasia type 2. OSLI Retina 45(5):369–380 [DOI] [PubMed] [Google Scholar]
- 21.Yin X, Chao JR, Wang RK (2014) User-guided segmentation for volumetric retinal optical coherence tomography images. J Biomed Opt 19:086020. [DOI] [PMC free article] [PubMed] [Google Scholar]
- 22.Padnick-Silver L, Kang Derwent JJ, Giuliano E, Narfstrom K, Linsenmeier RA (2006) Retinal oxygenation and oxygen metabolism in Abyssinian cats with a hereditary retinal degeneration. Invest Ophthalmol Vis Sci 47(8):3683–3689 [DOI] [PubMed] [Google Scholar]
- 23.Yu DY, Cringle SJ (2005) Retinal degeneration and local oxygen metabolism. Exp Eye Res 80(6):745–751 [DOI] [PubMed] [Google Scholar]
- 24.Penn JS, Li S, Naash MI (2000) Ambient hypoxia reverses retinal vascular attenuation in a transgenic mouse model of autosomal dominant retinitis pigmentosa. Invest Ophthalmol Vis Sci 41(12): 4007–4013 [PubMed] [Google Scholar]
- 25.Murakami Y, Ikeda Y, Akiyama M, Fujiwara K, Yoshida N, Nakatake S, Notomi S, Nabeshima T, Hisatomi T, Enaida H, Ishibashi T (2015) Correlation between macular blood flow and central visual sensitivity in retinitis pigmentosa. Acta Ophthalmol 93(8):e644–e648. doi: 10.1111/aos.12693 [DOI] [PubMed] [Google Scholar]
- 26.Nakagawa S, Oishi A, Ogino K, Makiyama Y, Kurimoto M, Yoshimura N (2014) Association of retinal vessel attenuation with visual function in eyes with retinitis pigmentosa. Clin Ophthalmol 8:1487–1493. doi: 10.2147/OPTH.S66326, eCollection [DOI] [PMC free article] [PubMed] [Google Scholar]