Abstract
Purpose:
To determine the possible correlation between the annual enlargement rates (ERs) of geographic atrophy (GA) with the percentage and size of the choriocapillaris (CC) flow deficits (FDs) surrounding GA, measured with swept-source OCT angiography (SS-OCTA) images.
Design:
Prospective, observational case series.
Participants:
Patients with GA secondary to nonexudative AMD.
Methods:
Patients were imaged with a 100-kHz SS-OCTA instrument (PLEX Elite 9000, Carl Zeiss Meditec, Dublin, CA) using a 6×6-mm field of view scan pattern. The GA area measurements were obtained from en face SS-OCT sub-retinal pigment epithelium (RPE) slab images. Visualization of the CC and quantification of FDs were performed using a previously published validated algorithm based on a 20-μm thickness slab with the inner boundary located beneath Bruch’s membrane. The percentage of CC FDs (FD%) and the average FD area measurements were calculated in different regions around the GA.
Main Outcome Measures:
The correlation between the CC FDs and the ERs of GA.
Results:
Twenty-two eyes from 15 patients were eligible for the analysis. The annual square root ERs for GA ranged from 0.07 to 0.75 mm/year. The CC FD% and average FD area measurements were highly correlated with each other (P < 0.001), with the highest FD values found in the region closest to the margin of GA. The ERs correlated best with the average CC FD area measurements in the total scan area minus the area of GA (Pearson r = 0.747; P < 0.001) than those in the regions immediately surrounding the GA (r = 0.544; P = 0.009).
Conclusions:
Contrary to expectations, the global CC FD measurements had a better correlation with the ERs of GA than those in the regions immediately around the GA. The most likely explanation for this outcome is that normal age-related increases in FDs within the central macula confound the correlations between the ERs of GA and FDs, whereas the regions furthest away from the margins of GA are less affected by normal age-related changes and reflect FD alterations related to AMD severity.
Geographic atrophy (GA), also known as “complete retinal pigment epithelium and outer retinal atrophy” (cRORA), is the late stage of nonexudative age-related macular degeneration (AMD) and a major cause of irreversible vision loss among the elderly worldwide.1 Geographic atrophy is associated with the loss of the retinal pigment epithelium (RPE), photoreceptors, and choriocapillaris (CC).1,2 Historically, color fundus imaging was used to identify and measure GA, but more recently, autofluorescence and OCT imaging are the consensus clinical choices for visualizing GA.3 Although OCT B-scans have always been useful for an anatomic definition of the presence and the margins of GA, accurate measurements of GA areas and enlargement rates (ERs) can be best obtained from en face OCT.4–9 With the advent of faster OCT instruments with a field of view comparable to autofluorescence imaging, en face OCT can be used to visualize macular GA in its entirety.10 When imaging GA, a sub-RPE slab that extends from 64 to 400 μm beneath Bruch’s membrane is chosen, and the GA is then visualized as a bright signal on the en face image resulting from the hypertransmission of light in areas where the RPE is lost. Another en face strategy to evaluate GA is to use a 20-μm–thick slab encompassing the outer retina that corresponds to the inner segment/outer segment region of the photoreceptors. This was shown to be useful for identifying areas of photoreceptor disruption at the margins of GA that could serve as predictors of GA enlargement.6,11 In the same way, the CC layer that could not be easily visualized in vivo before the development of OCT angiography12–19 may be useful for predicting the ERs of GA.
Different rates of GA enlargement have been associated with different hyperautofluorescence pattern around the margins of GA.20 A recent report by Sacconi et al21 suggested that these areas of hyperautofluorescence were associated with loss of CC in these regions; however, these authors used spectral domain OCT angiography (SD-OCTA) to image the CC and did not adjust for any loss of signal under the hyperautofluorescence that may have resulted in an artificial loss of CC flow beneath the RPE.21 Consequently, it was unclear whether the loss of the CC signal was due to decreased flow or a loss of signal.
Compared with SD-OCTA, swept-source OCT angiography (SS-OCTA) is better at imaging both structures and blood flow beneath the RPE primarily because of the longer wavelength of its light source.12,13,22–28 With the longer laser wavelength of 1060 nm, there is less scattering of the light by the RPE and less sensitivity roll-off into the choroid.27 At this wavelength, a higher laser power can be used, and this results in a better signal-to-noise ratio compared with SD-OCTA.27 In addition, with a faster scanning rate of 100 000 A-scans per second, denser scan patterns can be obtained with closer spacing of A-scans and B-scans when compared with similarly sized scan patterns obtained using a SD-OCTA instrument, resulting in better image quality. Recently, algorithms have been developed to compensate for inhomogeneous signal attenuation below the RPE/Bruch’s membrane complex.27–30 As a result, it is possible to improve the visualization of CC flow and the quantification of CC flow deficits (FDs).28,29
Previous studies in eyes with AMD using SS-OCTA have shown CC flow impairment at the margins of GA, under evolving drusen-associated atrophy, and under drusen.12,13,18,21,24,25,31 However, previous research did not attempt to correlate the extent of this CC flow impairment with the ERs of GA. In this current research, our hypothesis was that the CC FD measurements around the margin of GA would correlate with the ERs of GA. To test this possibility, we used SS-OCTA and our published algorithms to analyze and compare the CC FDs around the GA with ERs over 1 year.
Methods
Patients were enrolled at the Bascom Palmer Eye Institute in a prospective OCT imaging study. The Institutional Review Board of the University of Miami Miller School of Medicine approved the study, and all subjects signed an Institutional Review Board–approved consent form. The study was performed in accordance with the tenets of the Declaration of Helsinki and compliant with the Health Insurance Portability and Accountability Act of 1996.
Eligibility criteria included patients with GA secondary to nonexudative AMD without any history or evidence of subclinical neovascularization, as determined using SS-OCTA.32,33 Eyes with GA contiguous with peripapillary atrophy were excluded from the study. Geographic atrophy or cRORA was defined as a bright area on the en face structure OCT image measuring at least 2.54 mm2, with corresponding B scans showing the loss of RPE and outer retinal layer. For multifocal lesions, the area of at least 1 focus of GA had to be >1.25 mm2. The atrophic lesions had to be fully contained within the 6×6-mm scan pattern at baseline and at 1-year follow-up visit.
Patients diagnosed with GA secondary to AMD previously identified by conventional SD-OCT en face structural imaging were included for baseline SS-OCTA imaging (PLEX Elite 9000; software 1.6, Carl Zeiss Meditec, Dublin, CA) between June 2016 and March 2017. This 100-kHz SS-OCT instrument has a central wavelength of 1060 nm, a bandwidth of 100 nm, a full-width at half-maximum axial resolution of approximately 5 μm in tissue, a lateral resolution at the retinal surface estimated at approximately 20 μm,34 and an A-scan depth of 3.0 mm in tissue (1536 pixels). For each eye in the study and at every imaging session, SS-OCTA images were acquired using the 6×6-mm scan patterns, consisting of 500 A-scans per B-scan, with B-scans repeated twice at each of the 500 B-scan positions, resulting in a spacing of 12 μm between A-scans. For each patient, OCT images were acquired by an experienced operator at baseline, 6 months, and 1 year of follow-up. Each scan was reviewed for quality and signal strength, and scans with a signal strength less than 7 based on the instrument’s output, as well as scans with motion artifacts, were excluded. If more than 1 scan of a given type was available at a visit, the scan with the best quality was chosen to generate the sub-RPE slab en face structure image and CC en face flow images. The same segmentation and image processing strategies were applied to all images in this study.
The segmentation boundaries for the sub-RPE slab used to image GA in this study extended from 64 to 400 μm below the instrument’s RPEfit (Bruch’s membrane) boundary surface. This slab was obtained on the instrument using the custom segmentation option and the RPEfit-RPEfit boundary settings.8 The areas of GA observed on the sub-RPE slab en face structural images were manually outlined as previously described by 2 independent graders (MT and YS) at the Bascom Palmer Eye Institute using an image analysis software (Adobe PhotoshopCS2; Adobe Systems, San Jose, CA).9 B-scans were reviewed to ensure that the bright areas identified on en face image represented true cRORA and areas with incomplete RORA were excluded from the measurements (Fig 1). We use a square root transformation to eliminate the influence of lesion size on test–retest variability on ERs.9 The square root ERs of GA was defined as the difference of the square root of the area measurements at baseline and approximately 1 year. This difference was normalized by the follow-up time to convert to an annual rate. We also identified whether reticular pseudodrusen (RPD), also known as “subretinal drusenoid deposits” (SDDs), were present in the study eyes using a 20-μm–thick RPE-RPE slab from a 12×12-mm scan pattern as previously described.35
Figure 1.
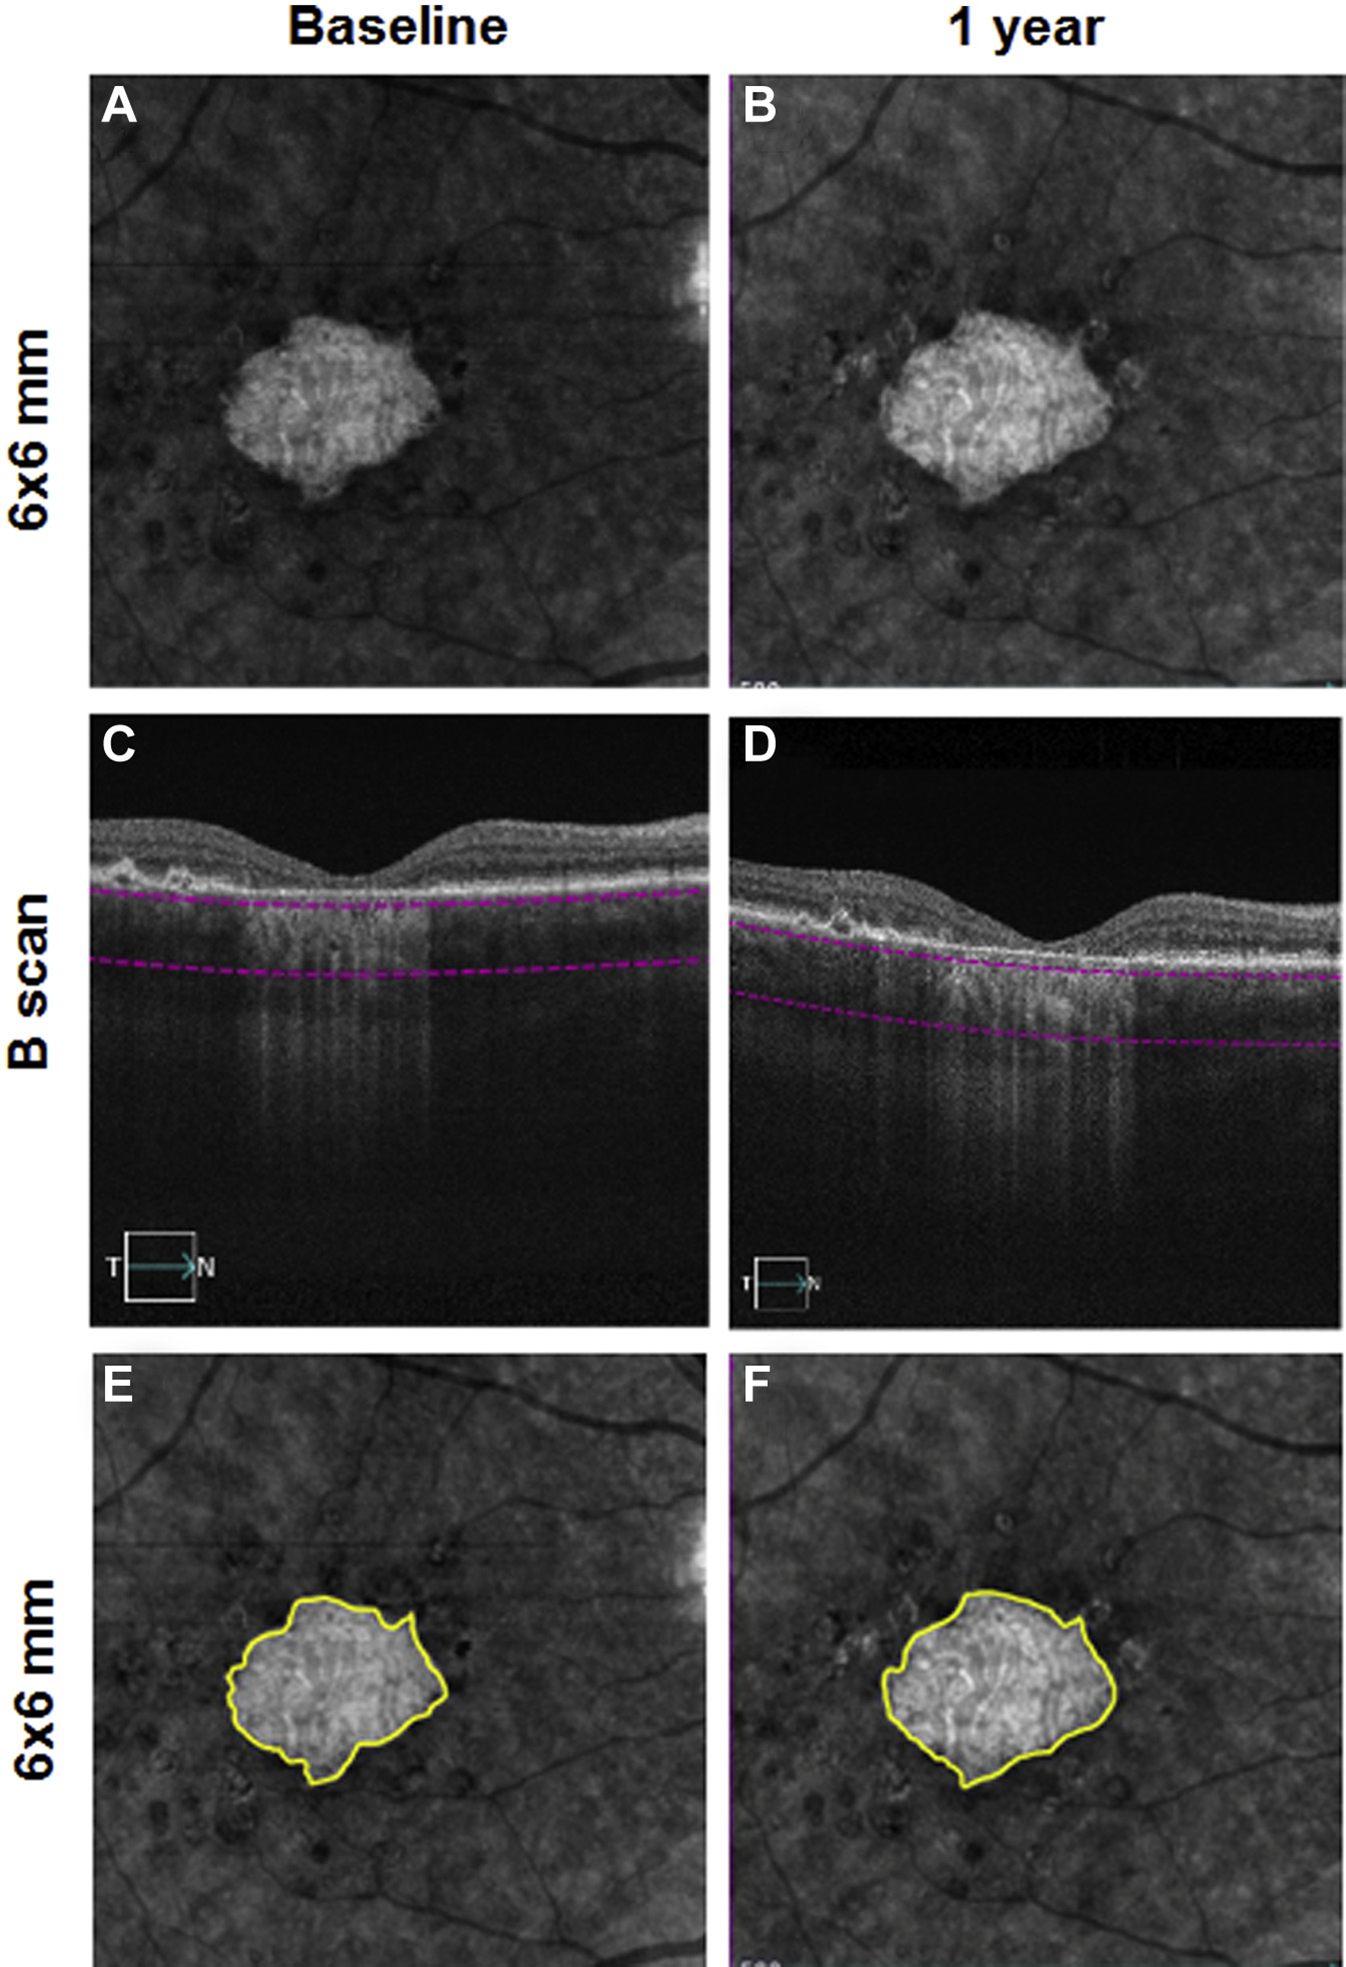
En face 6×6-mm structure images at baseline and 1 year from the right eye of a patient with geographic atrophy (GA). A, B, The segmentation boundaries for the slab used in this study extended from 64 to 400 μm beneath Bruch’s membrane (C, D). The boundaries of GA were manually outlined on the slab image with the area of GA outlined in yellow in E and F. E, GA area = 2.55 mm2. F, GA area = 2.90 mm2. The annual square root enlargement rate (ER) of GA was 0.11 mm/year.
Visualization and quantitation of the CC were performed as previously described28,36 using a 20-μm thickness slab with the inner boundary located beneath Bruch’s membrane. Bruch’s membrane was identified using a semiautomated algorithm and some manual assistance. The CC en face flow images were adjusted using the corresponding en face structural image to compensate for any signal loss due to the overlying anatomy, and retinal vessel projection artifacts were removed from the CC slab for more accurate quantification.29 The FDs were identified with a thresholding based on normal database. All FDs with an equivalent diameter less than 24 μm were excluded from consideration on the basis of a histogram analysis performed on FDs from normal eyes.28,36
Quantitation of the CC on the 6×6-mm scan was performed by calculating the percentage of FD (FD%) and the average CC FD area measurements around the GA. Choriocapillaris FD% was defined as the ratio of FD area by the total area within a given region. Average CC FD area was defined as the average value of the area of isolated FDs within a given region. Four different regions around the GA outline were defined using an automated morphology function (imdilate) in MATLAB (MathWorks, Inc, Natick, MA). Region 1 (R1) represented a 1-degree field of view rim around the GA. One degree corresponds to a distance of 300 μm. R1 extends from 0 to 300 μm (red color) around the GA; Region 2 (R2) was a further 1-degree field of view rim extending from 300 μm out to 600 μm from the edge of GA (purple color); Region 3 (R3) included the remaining area in the 6×6-mm raster scan (green color; Figs 2 and 3).
Figure 2.
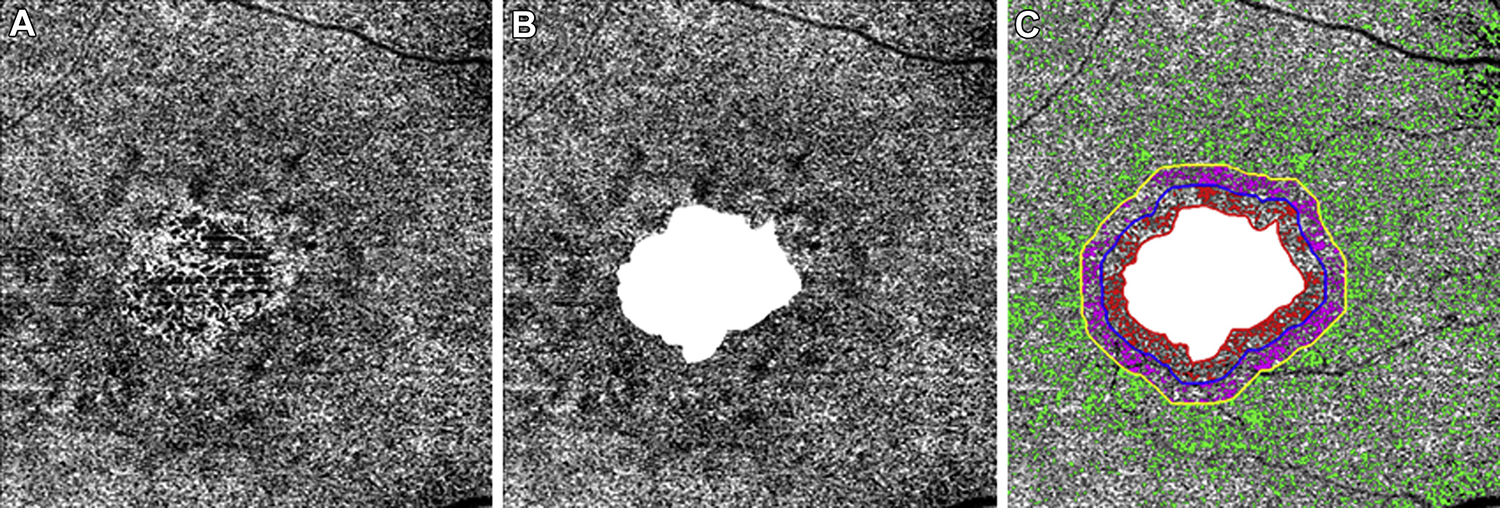
En face 6×6-mm choriocapillaris (CC) flow images at baseline from the same right eye of a patient with geographic atrophy (GA). A, Diffuse CC flow deficits (FDs) around and within the GA. B, The CC FDs in the total scan area minus the GA. C, The CC FDs in the 1 degree rim around the GA (R1) are colored coded in red and extend from 0 to 300 μm from the margin of the GA. The CC FDs in the next rim (R2) are color coded purple, and this region extends 1 degree further, from greater than 300 to 600 mm away from the GA margin. The third region (R3) represents the scan area excluding GA+R1+R2, and the CC FDs are color coded in green.
Figure 3.
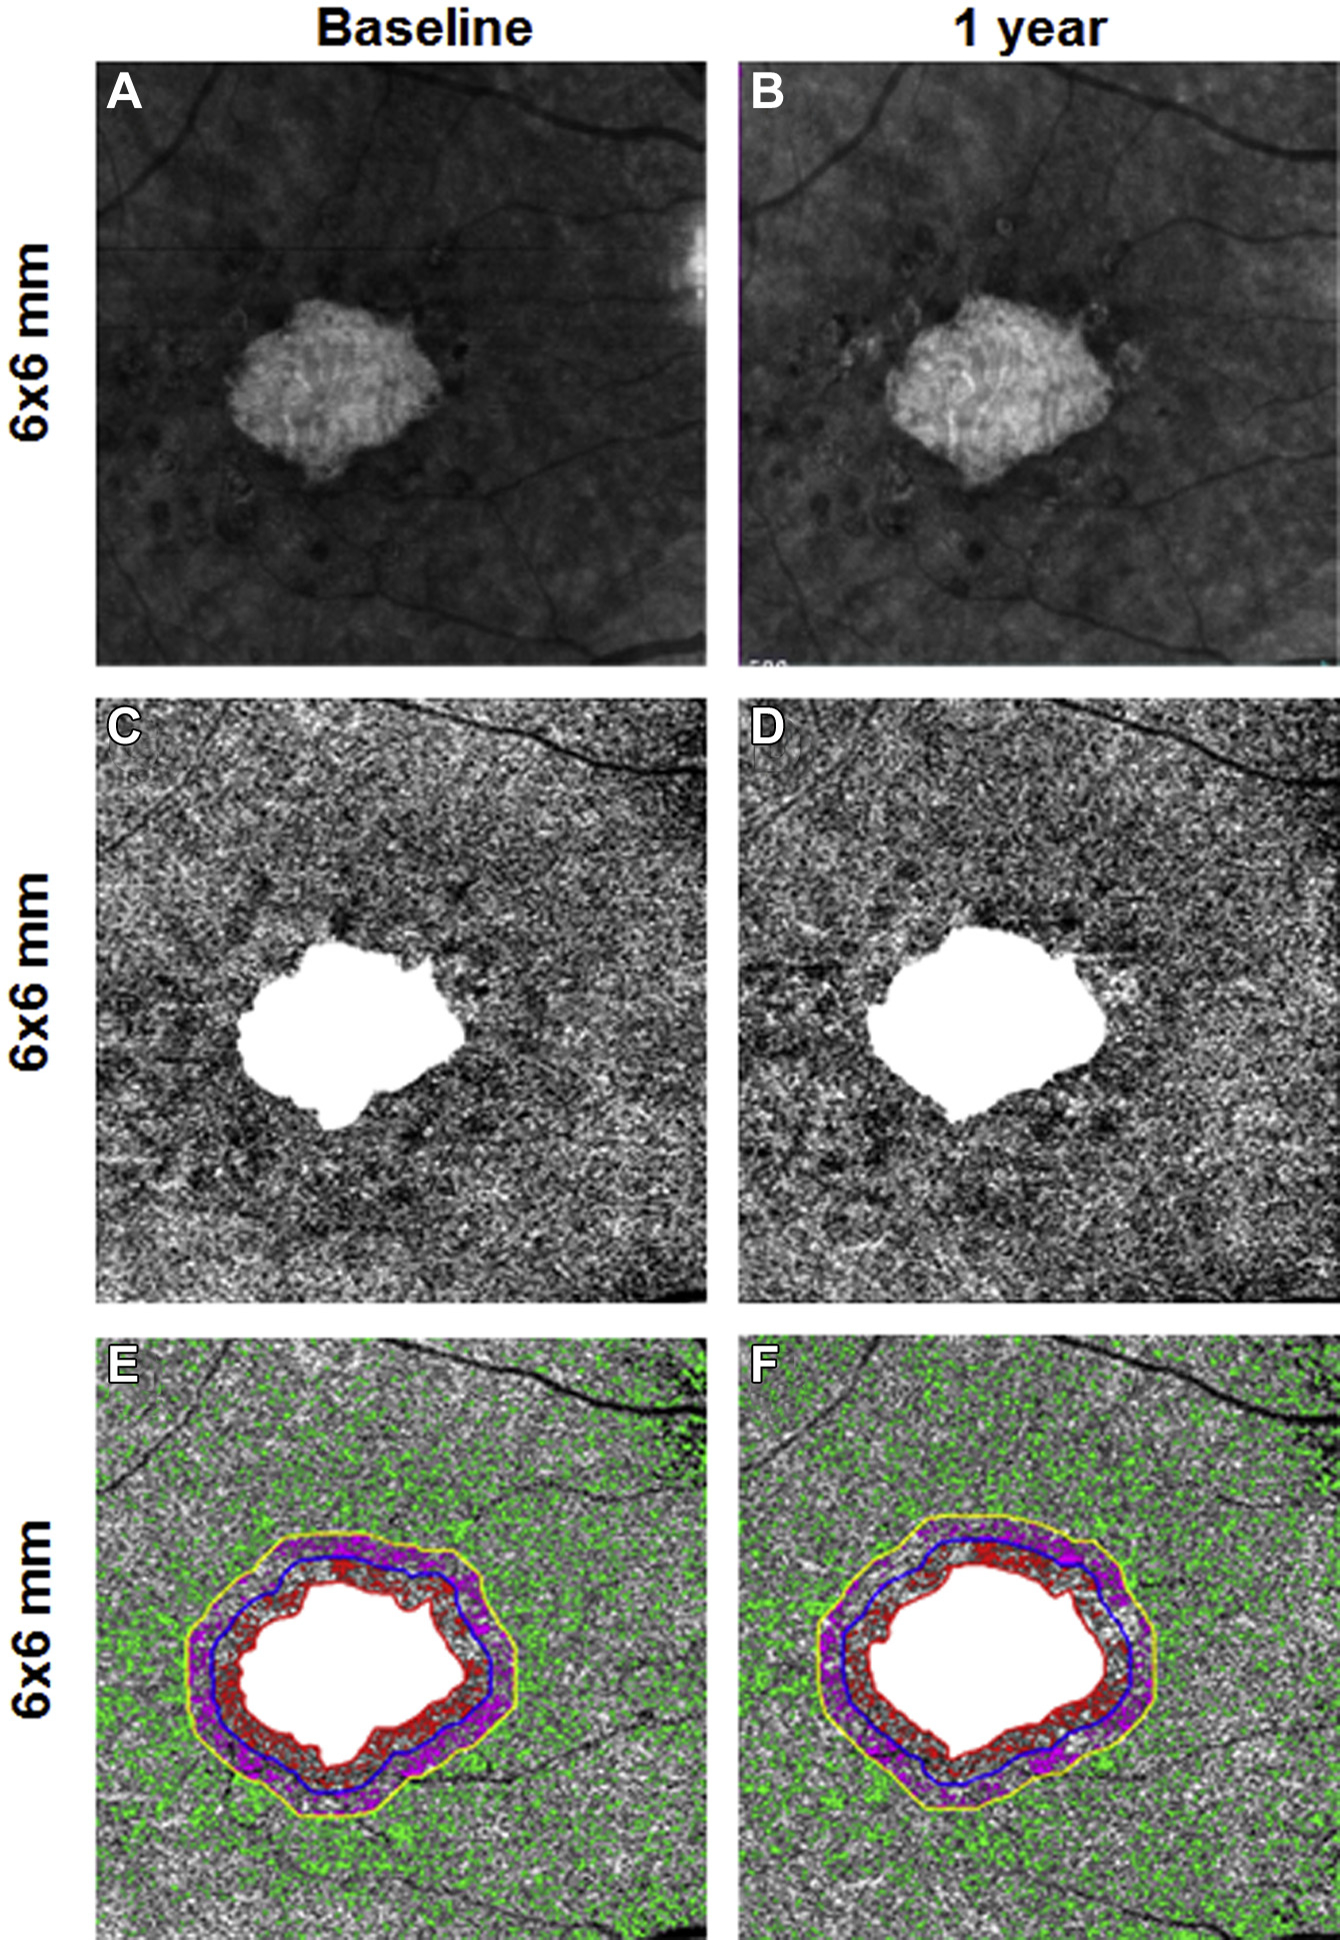
En face 6×6-mm structure and choriocapillaris (CC) images at baseline and 1 year from the same right eye of a patient with geographic atrophy (GA). A and B, Annual enlargement rate (ER) of GA is 0.11 mm/year. C and D,CC en face flow images with the area of GA excluded. E and F, Color-coded CC flow deficits (FDs) in Region 1, Region 2, and Region 3 (E, F).
The Pearson’s correlation coefficient was used to evaluate the relationship between CC FD% and average CC FD area measurements on the 6×6-mm scan, as well as the correlation between the CC FD measurements and the square root ERs of GA. These correlation coefficients were calculated using only FD% and FD area measurements collected at the first visit. The 2-sample t test was used to compare the mean ERs of eyes with and without RPD. Because both eyes of some patients were included in these computations, a sensitivity analysis was performed by randomly selecting 1 eye for each patient to assess the influence of the second eye. Statistical analyses were performed with IBM SPSS Statistics for Windows, Version 25.0 (IBM Corporation, Armonk, NY) with a P value of <0.05 considered to be statistically significant.
Results
A total of 22 eyes of 15 patients were enrolled at baseline between June 23, 2016, and March 29, 2017, with a mean age of 79 years (range, 64–94 years) and an average follow-up of 12.8 months (range, 11.1–16.1 months). Three measurements were obtained from all subjects at approximate intervals of 6 months. At baseline, the CC FD% and average FD area measurements were elevated at the margins of GA in both R1 and R2 compared with R3 (Table 1). The R1 CC FD% was 28.8% (standard deviation [SD], 9.1; range, 16.3–49.6), and the average CC FD area measurement was 0.0048 mm2 (SD, 0.0025; range, 0.0022–0.0074 mm2). As the distance increased from the edge of the GA, both the CC FD% and the average FD area measurements decreased, with R3 having a CC FD% of 14% (SD, 3.5; range, 7.2–20.6) and an average FD area measurement of 0.0027 mm2 (SD, 0.00006; range, 0.0019–0.0041 mm2). When the CC FD% and average FD area measurements from each region were compared, correlations were strong and highly significant (P < 0.001) with a curvilinear relationship over 1 year for all pairs of FD parameters (Fig 4).
Table 1.
Baseline Choriocapillaris Percentage Flow Deficits and Average Flow Deficit Area Measurements in the Different Areas around the Geographic Atrophy
| Region of Interest | Percentage FDs (SD) [Range] | Average FD Area, mm2 (SD) [Range] |
|---|---|---|
|
| ||
| Rim 1 (1 degree: 0—300 μm out) | 28.8 (9.1) [16.3—49.6] | 0.0048 (0.0025) [0.0022—0.0132] |
| Rim 2 (from 301 to 600 μm out) | 24.4 (9.5) [10.7—46.9] | 0.0034 (0.0015) [0.0019—0.0074] |
| Rim 3 (total scan area minus GA+R1+R2) | 14.0 (3.5) [7.2—20.6] | 0.0027 (0.0006) [0.0019—0.0074] |
| Total scan area minus GA | 16.8 (3.8) [10.9—25.1] | 0.0034 (0.0010) [0.0024—0.0060] |
FD = flow deficit; GA = geographic atrophy; R1 = Region 1; R2 = Region 2; SD = standard deviation.
Figure 4.
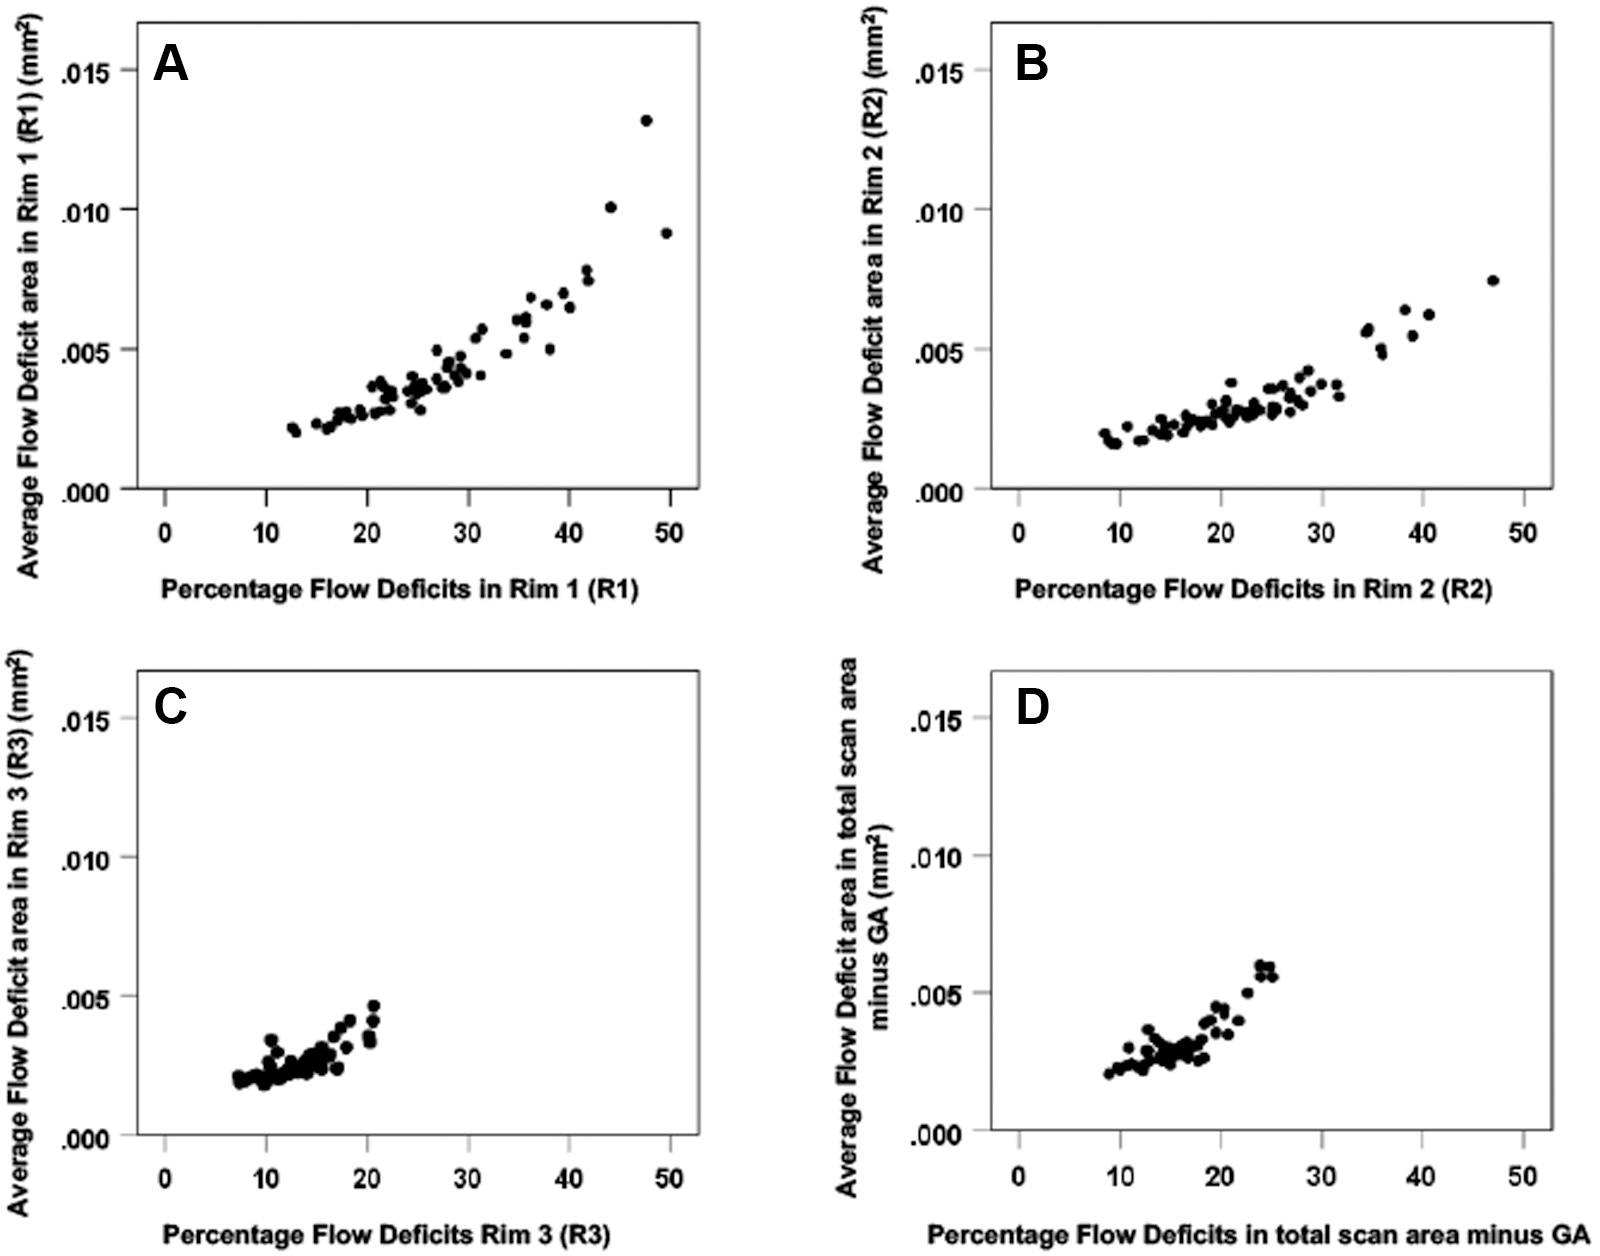
Scatter plots comparing the choriocapillaris (CC) flow deficit (FD) percentages and the average FD area measurements for the 22 eyes over one year in the different areas around the geographic atrophy (GA): (A) CC FD in Rim1, (B) Rim 2, (C) Rim 3, and (D) Total scan area minus GA. For all pairs of FD parameters, correlations are strong and highly significant presenting a curvilinear relationship (P < 0.001). GA = geographic atrophy.
The annual square root ERs ranged from 0.07 to 0.75 mm/year. Positive correlations were found between the annual square root ERs of GA and both the baseline CC FD% and the average FD area measurements. However, the strongest association was found between the GA ERs and the average FD area measurements for the total scan area minus the area of GA (Pearson r = 0.747, P < 0.001) (Table 2, Figs 5 and 6). Of note, the correlation between the ERs of GA and the average FD area measurements at the margin of GA (R1) was lower (r = 0.544; P = 0.009), and the correlation with the CC FD% was even lower and not statistically significant (r = 0.403; P = 0.063). These correlations are graphically depicted in Figures 5 and 6. Figures 5C and 6C show the correlations when only R3 is considered, which is the region of the scans that excluded the GA, R1, and R2. It is apparent that R3 is driving the overall correlation shown in Figures 5D and 6D. The sensitivity analysis to assess the effect of including both eyes of some patients showed that the inclusion of both eyes did not alter these findings. In particular, correlations in 15 eyes of 15 patients confirmed that the correlation between the ERs and the CC FDs for the total scan area minus the area of GA (r = 0.65) was similarly stronger than the correlation between R1 and the ERs (r = 0.55), regardless of whether average FD area or %FD was considered.
Table 2.
Correlations at Baseline between Flow Deficit Parameters and Annual Square Root Enlargement Rate of Geographic Atrophy in the Different Areas around the Geographic Atrophy (r = Pearson)
| Region of Interest | Percentage FDs | Average FD Area mm2 |
|---|---|---|
|
| ||
| Rim 1 (1 degree: 0–300 μm out) | r = 0.403 P = 0.063 | r = 0.544 P = 0.009 |
| Rim 2 (from 301 to 600 μm out) | r = 0.498 P = 0.018 | r = 0.677 P < 0.001 |
| Rim 3 (Total scan area minus GA+R1+R2) | r = 0.496 P = 0.019 | r = 0.690 P < 0.001 |
| Total scan area minus GA | r = 0.626 P = 0.002 | r = 0.747 P < 0.001 |
FD = flow deficit; GA = geographic atrophy; R1 = Region 1; R2 = Region 2.
Figure 5.
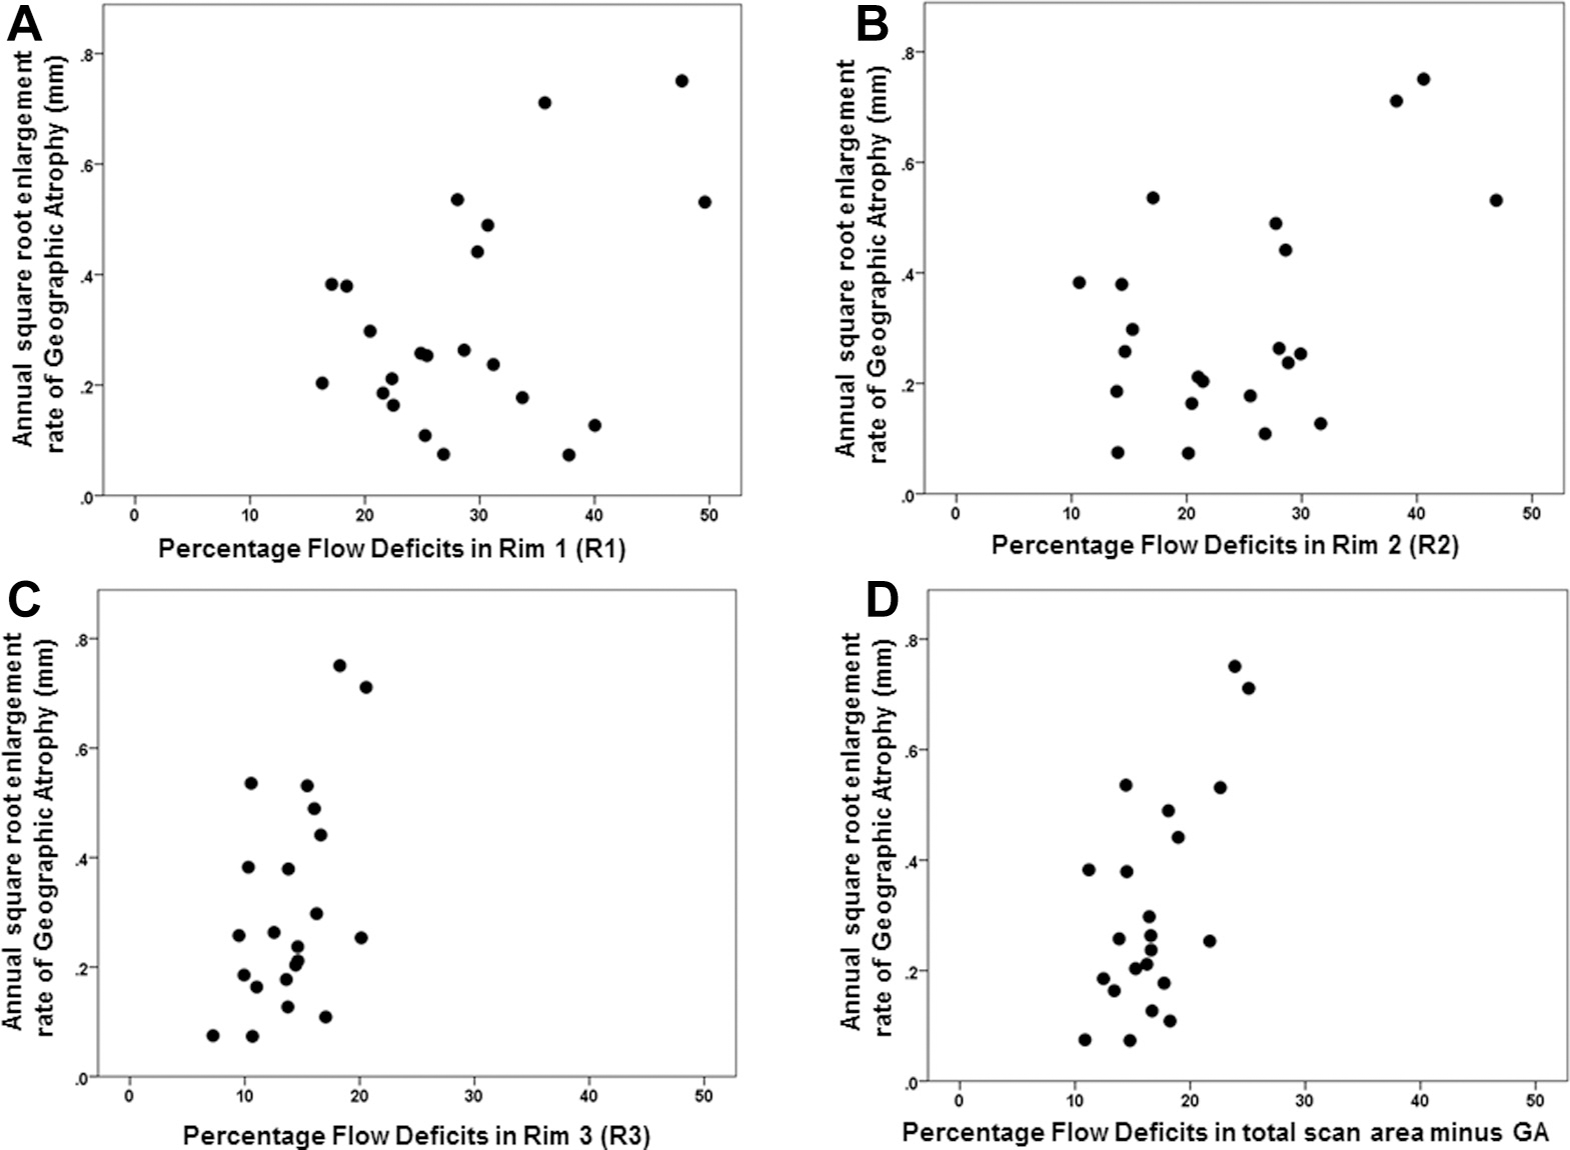
Scatter plots comparing the choriocapillaris (CC) percentage flow deficit (FD%) and the annual square root enlargement rates (ERs) of geographic atrophy (GA) in 22 eyes. Rim 1 (A), Rim 2 (B), Rim 3 (C), and total scan area minus GA (D). The correlation between the FD% and the annual square root ERs of GA was stronger in (C) Rim 3 (Pearson r = 0.5 P = 0.019) and in (D) total scan area minus GA (r = 0.63 P = 0.002) than in (A) Rim 1 (r = 0.40 P = 0.06).
Figure 6.
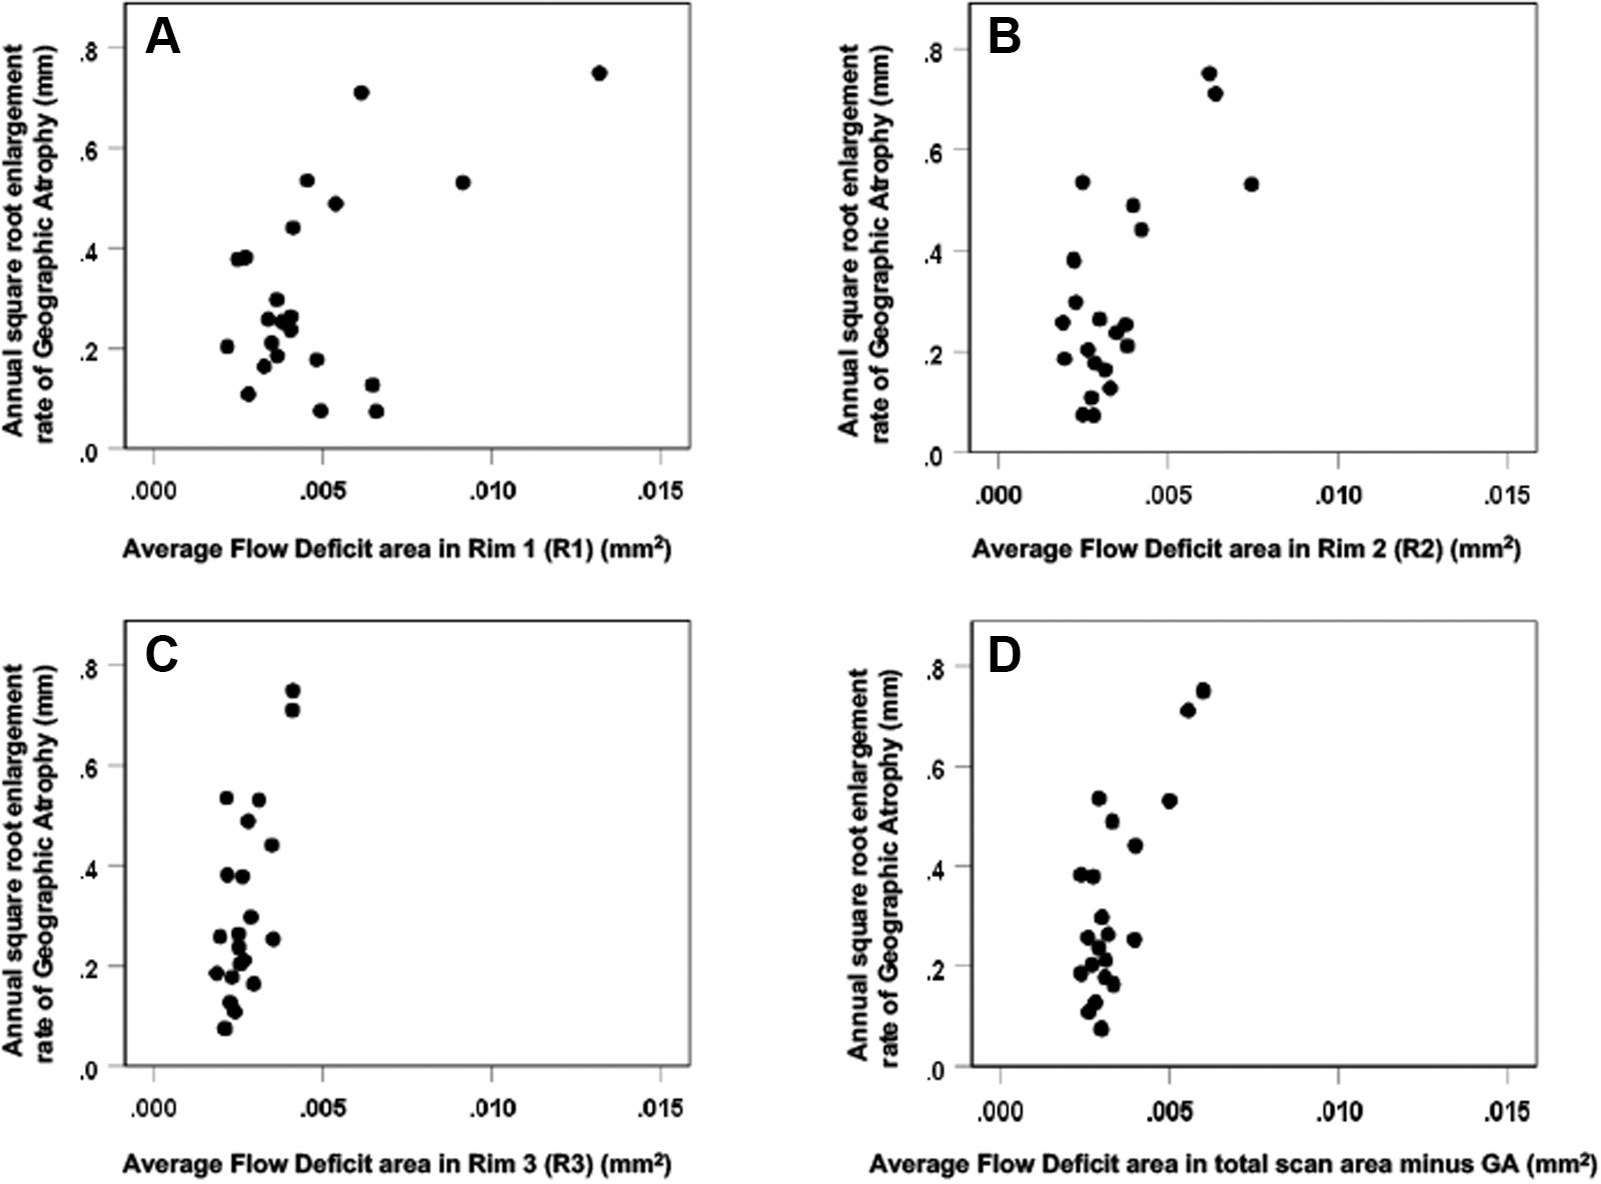
Scatter plots comparing the choriocapillaris (CC) average flow deficit area (FDa) measurements (mm2) and the annual square root enlargement rates (ERs) of geographic atrophy (GA) for the 22 eyes. (A) Rim 1, (B) Rim 2, (C) Rim 3, and (D) Total scan area minus GA. The correlation between the FDa (mm2) and the annual square root ERs of GA was higher in (C) Rim 3 (Pearson r = 0.69 P < 0.001) and in (D) the area minus the GA only (r = 0.75 P < 0.001) than in (A) Rim 1 (r = 0.54 P = 0.009).
To determine if lesion size and presence of RPD affected the ERs of GA, we adjusted for these characteristics at baseline. Sixteen eyes from 11 patients presented with RPD at baseline. Lesion size and the presence of RPD did not lead to change in statistical significance or much change in magnitudes of the correlations between CC FDs and GA ERs. We correlated the mean values of CC FD area sizes and percentages in each region with the presence or absence of RPD and found no difference between these groups (P ranging from 0.070 to 0.980). Moreover, there were no differences in the ERs of GA based on the presence or absence of RPD (P = 0.404). Figures 7 to 10 are examples of representation of CC FDs around the GA for different annual ERs, respectively.
Figure 7.
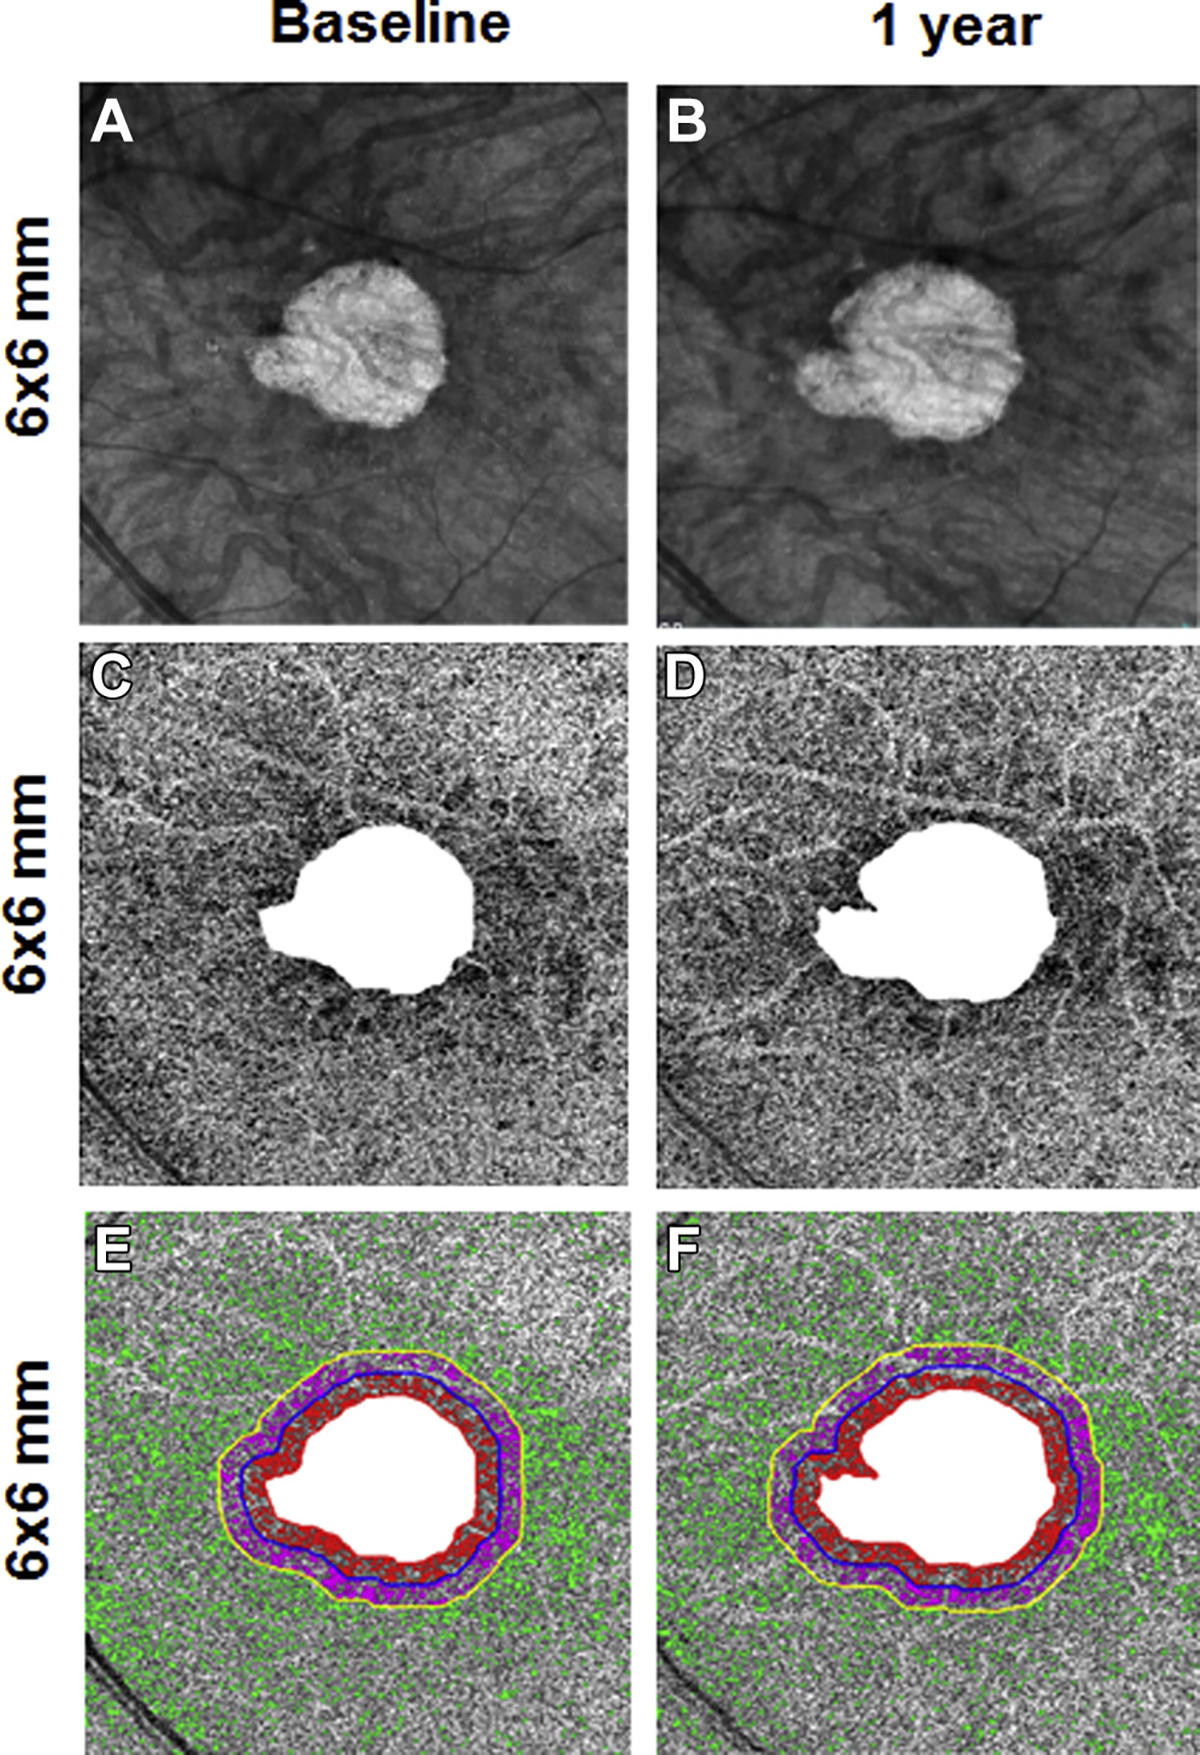
En face 6×6-mm structure and choriocapillaris (CC) images at baseline and 1 year from the left eye of a patient with geographic atrophy (GA). A, B, Annual enlargement rate (ER) of GA is 0.13 mm/year. C, D, CC en face flow images. E, F, CC low deficits (FDs) in the different regions: FD% and average flow deficit area (FDa) at baseline in R1 (FD%: 40.2%; FDa: 0.0064 mm2), R2 (FD%: 31.6%; FDa: 0.0032 mm2), and R3 (FD%: 13.7%; FDa: 0.0023 mm2).
Figure 10.
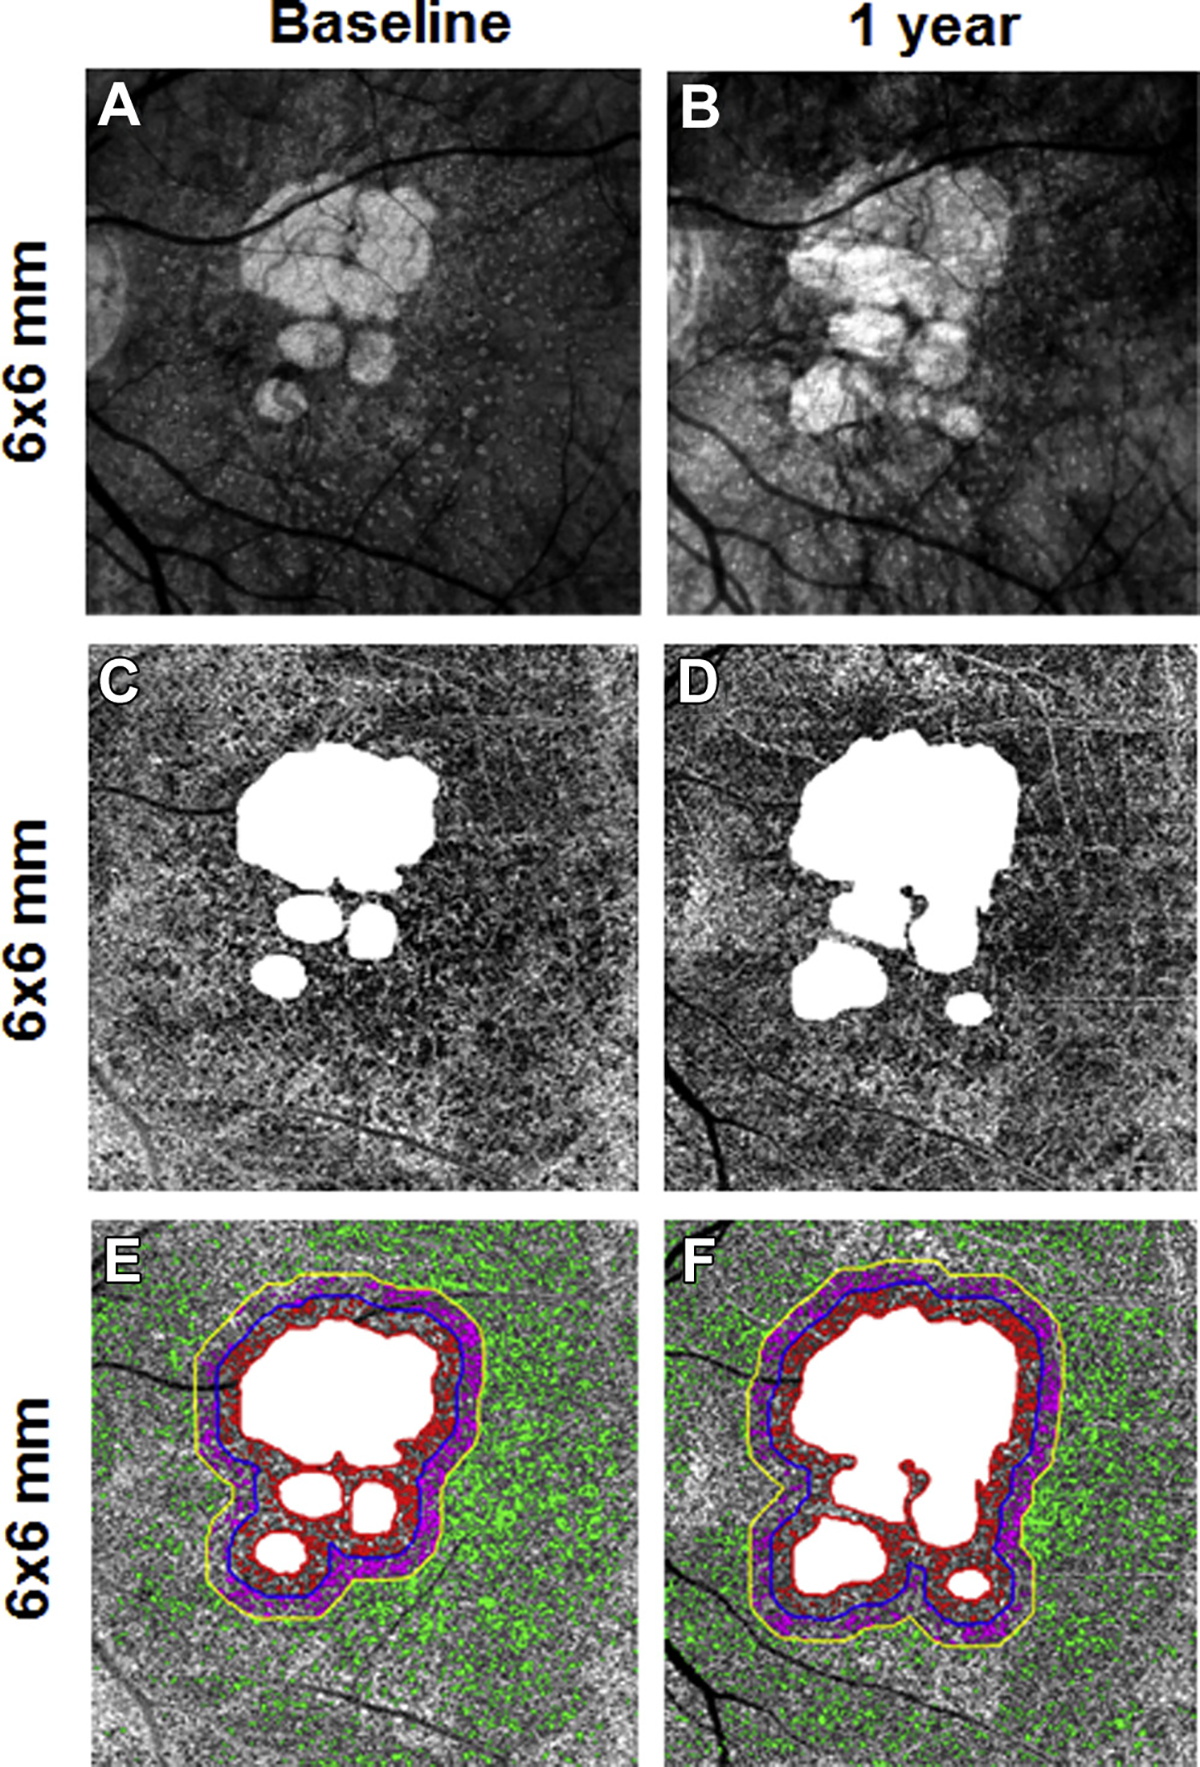
En face 6×6-mm structure and choriocapillaris (CC) images at baseline and 1 year from the right eye of a patient with geographic atrophy (GA). A, B, Annual enlargement rate (ER) of GA is 0.44 mm/year. C, D, CC en face flow images. E, F, CC flow deficits (FDs) in the different regions: FD% and average flow deficit area (FDa) at baseline in R1 (FD%: 29.8%; FDa: 0.0041 mm2), R2 (FD%: 28.6%; FDa: 0.0041 mm2), and R3 (FD%: 16.6%; FDa: 0.0036 mm2).
Discussion
In this study, we investigated the correlations between baseline CC FDs around GA and the ERs. We found that the strongest correlation existed when the entire scan area was considered minus the area of GA even though the CC FDs were greatest within R1. This result was unexpected, given the natural assumption that the local conditions at the GA boundary have a strong influence on its growth. Previous research had shown the presence of abnormalities in CC perfusion around the edge of GA.13 We expected to find that the CC FD measurements would be highest in R1 and would have the strongest correlation with the ERs of GA there. Although we found more FDs closer to the edges of GA, the correlations with the ERs were strongest for the FDs within the entire 6×6-mm scan area minus the area of GA. Moreover, we found that the correlations between the average CC FDs area and ERs were stronger than those between the CC FD% and ERs for any given region.
One possible explanation for these unexpected results is based on our recent work examining the change in CC FDs in normal eyes as they age (Fang Zheng et al.).37 We found that with each decade of life from the 20s through the 80s, there was loss of CC perfusion within the central macula. Moreover, we showed that within a 5-mm disc centered on the fovea, the central region lost CC perfusion continually with age, whereas the more peripheral areas of the disc tended to lose CC perfusion less rapidly with aging, and this loss plateaued after the sixth decade of life. This observation may explain why R1 did not show the strongest correlation with the ERs of GA. Because CC FDs increase with age in the central macula, the increase in FDs observed around the margins of GA likely represents a combination of aging effects and disease-related changes. Whether the relative strengths of these correlations are affected by the location of the GA, its multifocality and eccentricity relative to the central macula need to be investigated further.
Another possible explanation for why R1 did not show the strongest correlation with ER is that visualization of the CC and calculation of the true FDs might be more problematic around the edges of GA, making it difficult to obtain an accurate measurement. This could be due to the uncertainty in determining the precise location of the GA boundary in that the boundary of the GA may segment through an area that is part of a larger FD that extends into the GA. Furthermore, averages taken over smaller regions are likely to produce more variable results. If we assume that AMD affects the CC globally within the macula, then the CC changes away from the margin of GA could reflect disease-related alterations in CC flow that correlate better with disease progression when combined with the CC changes immediately around GA. Regardless of the underlying reasons for the variability of the measurements, Figures 5 and 6 show this variability when the CC FDs are plotted against the annual square root ERs of GA. We purposely kept the same axis in these plots to demonstrate the scatter of data points and to more easily compare the relationships with all the regions. Because less variability is observed when FDs are measured in larger regions, it is possible that the greater variability in R1 and R2 confounds the correlation between CC FD measurements and ERs.
These observations are interesting because of the mutual relationship between the CC and the RPE, and the debate as to whether the CC or the RPE is the primary site of injury in AMD that results in the formation of GA. Histopathologic studies have shown CC changes with aging in normal eyes38 and in retinal diseases such as AMD.39 In GA, McLeod et al39 found a linear correlation between the RPE loss and the CC disruption, concluding a loss of RPE before CC, whereas Biesemeier et al40 reported that CC is always more damaged compared with RPE at the level of “transition zone” and concluded that it is probably the loss of CC that precedes the RPE degeneration. Our SS-OCTA findings that CC alterations distant from the GA are correlated with the progression of the disease seem to support the hypothesis that CC loss may precede RPE changes, and that once the CC is severely impaired, the RPE may develop atrophy. It is interesting to note that the best correlation was found using FD area measurements rather than FD%, which suggests that the absolute size of the CCFDs may contribute to the formation of GA. If CC flow alteration is an indicator of disease progression, then it is reasonable to consider the relationship between the CC and the overall choroidal circulation. In a previous work, we showed that choroidal thickness has a clear relationship with the density of large choroid vessels.35
Several OCT angiography studies have now investigated CC alterations around the GA margins,13,21,31 but our study shows a correlation between the CC FDs and the annual ERs of GA using SS-OCTA imaging. These changes observed on SS-OCTA clearly seem to precede the obvious expansion of GA detectable with conventional structural OCT and should serve as useful baseline features to help predict the ERs of GA. This will be particularly useful when selecting cases for clinical trials designed to test new therapies in the hope of slowing the ERs of GA. If a beneficial effect is observed, then it might be possible to identify subpopulations with GA and CC impairment who are more likely to respond favorably to a given treatment. At least, it seems reasonable to stratify any study population at baseline for the extent of CC perfusion abnormalities before testing any new therapy. Thus, CC flow impairment may provide a surrogate marker for progression, as well as a potential marker for treatment response in clinical trials for future drugs in nonexudative AMD.
It is interesting to note that we found no correlation between the presence of RPD/SDDs and the size or percentage of CC FDs. This is in contrast with other studies that have shown an association between RPD/SDDs and increasing CC FDs.41 One difference between these studies is that we identified RPD/SDDs on the basis of en face OCT imaging. However, we have previously shown that OCT en face imaging is as good as or better than traditional multimodal imaging for the identification of RPD/SDDs.42 In addition, we found no correlation between the ERs of GA and the presence of RPD/SDDs. This is consistent with previous work, in which we used multimodal imaging to identify RPD/SDDs and found no correlation between the ERs of GA and the presence of RPD/SDDs.43 Because there was a correlation between CC FDs and the ERs of GA and there was not a correlation between RPD/SDDs and the ERs of GA, it should not be surprising that there is no association between RPD/SDDs and CC FDs. Most likely, the association between RPD/SDDs and CC FDs reported by others was a function of normal aging in these AMD eyes.
Study Limitations
We acknowledge that our study has several limitations, including a small sample size, a follow-up period of only 12 months, and inclusion of both eyes of 7 patients. We limited our follow-up period to 12 months because we were only able to image patients with the current SS-OCT technology since April 2016 when both the latest instrument and algorithms became available. Nevertheless, this follow-up period permits us to evaluate the ERs of the GA. In addition, our algorithms are only validated for the 6×6-mm scan pattern, so we deliberately investigated lesions that were fully contained within the 6×6-mm scan pattern. To address the inclusion of both eyes from some patients, we performed a sensitivity analysis by randomly selecting 1 eye for each patient to confirm our results. This analysis showed that the inclusion of second eyes did not influence the conclusion that the correlations between FDs and ERs were stronger for the total scan area minus the area of GA than they were for R1. Another limitation is that some residual retinal vessel projection artifacts can appear in the CC slab images even after the projection artifact removal procedure, but every attempt was made to remove these regions from the CC FD analyses.
Conclusions
We report that positive correlations exist between the CC FDs surrounding GA and the ERs of the lesion by using SS-OCTA. The strongest correlations were found when the entire 6×6-mm scan area was considered rather than the 300-μm rim immediately around the edge of GA. Ongoing prospective natural history studies of eyes with nonexudative AMD imaged with SS-OCTA will provide definitive evidence on the role of CC FDs in the formation and enlargement of GA.
Figure 8.
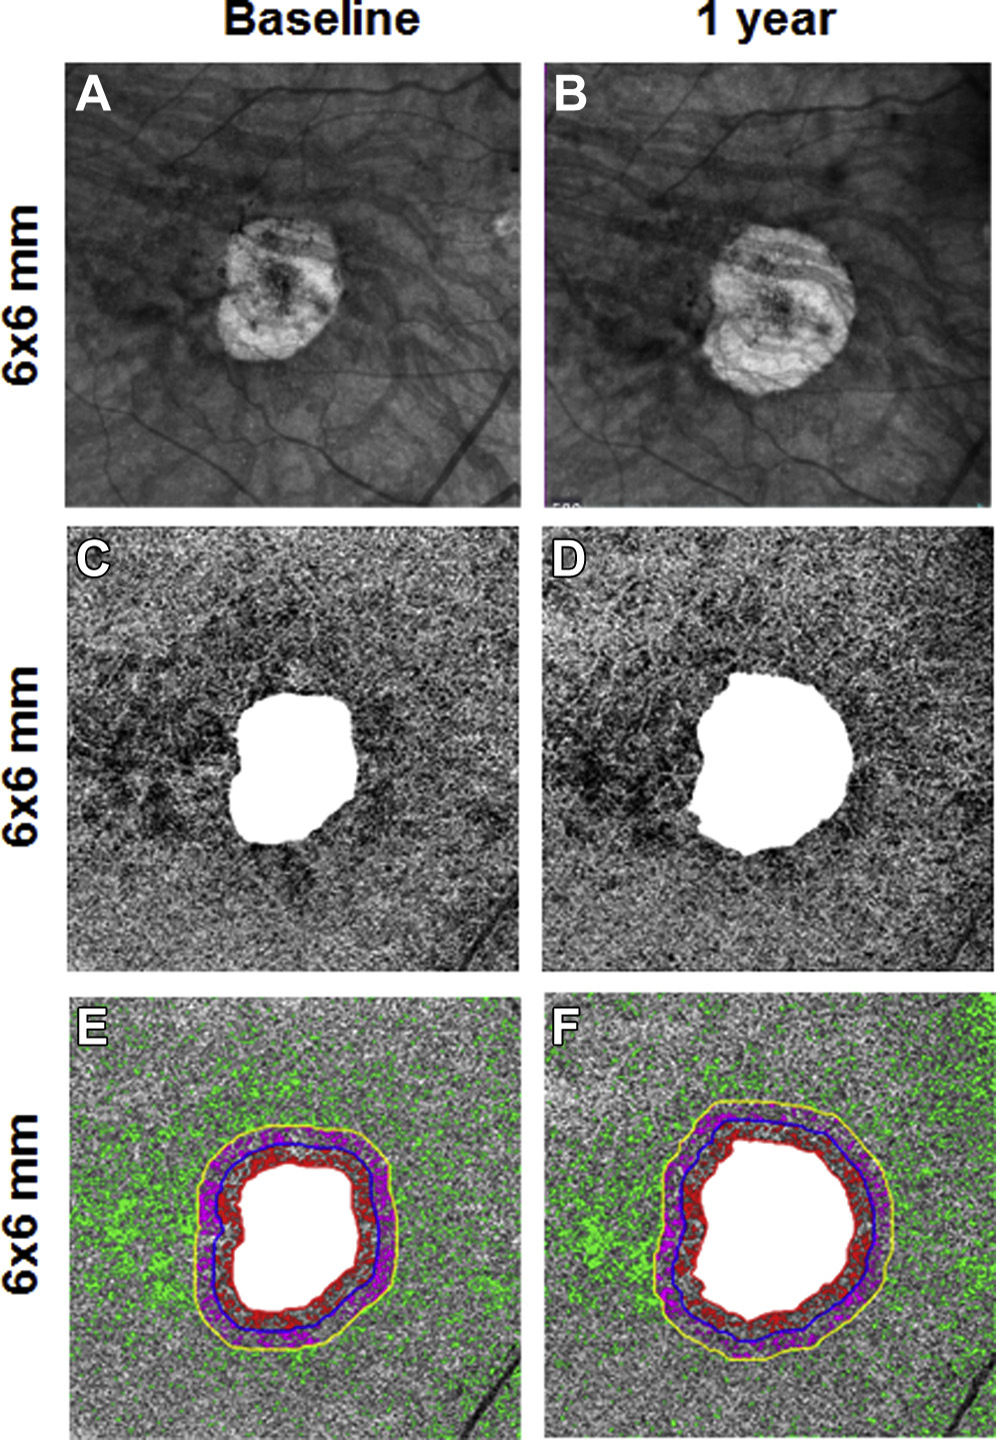
En face 6×6-mm structure and choriocapillaris (CC) images at baseline and 1 year from the right eye of a patient with geographic atrophy (GA). A, B, Annual enlargement rate (ER) of GA is 0.24 mm/year. C, D, CC en face flow images. E, F, CC flow deficits (FDs) in the different regions: FD% and average2flow deficit area (FDa) at baseline in R1 (FD%: 31.2%; FDa: 0.0040 mm2), R2 (FD%: 28.8%; FDa: 0.0034 mm2), and R3 (FD%: 14.6%; FDa: 0.0025 mm2).
Figure 9.
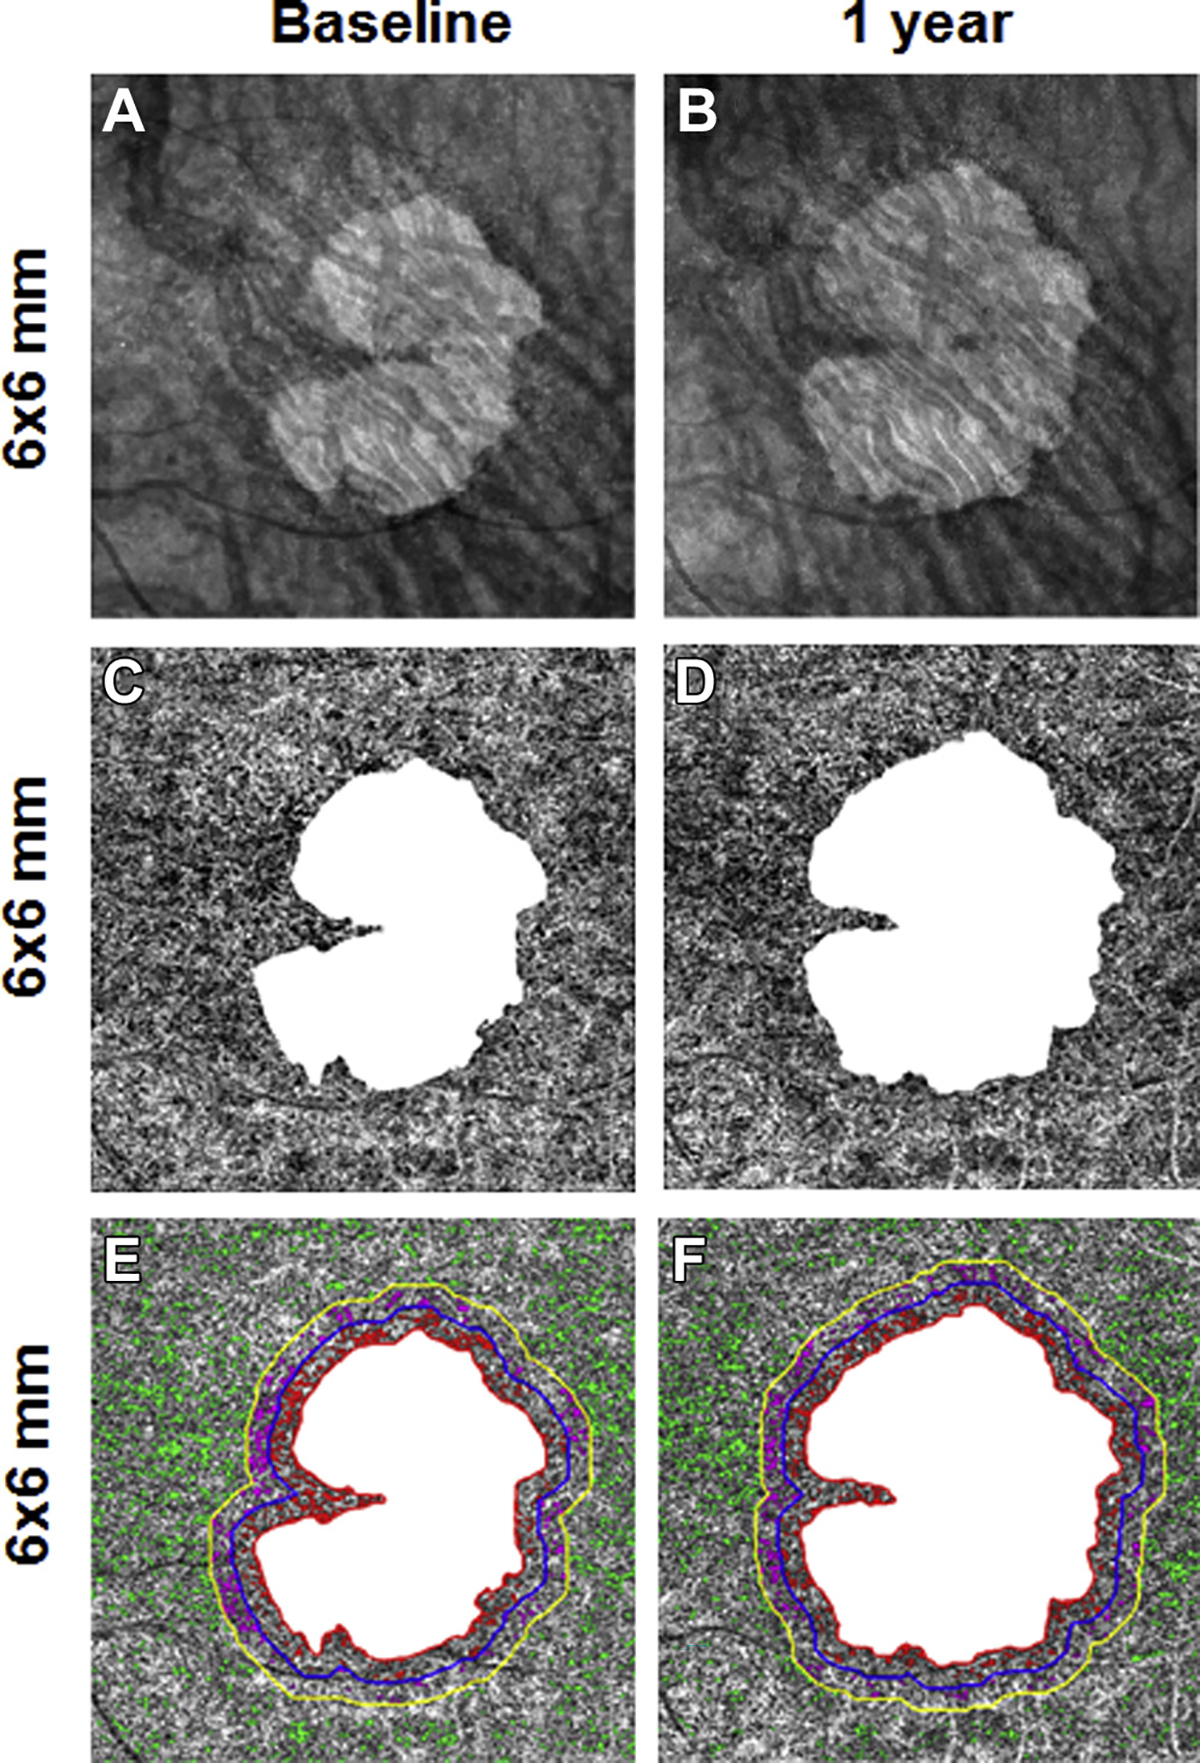
En face 6×6-mm structure and choriocapillaris (CC) images at baseline and 1 year from the left eye of a patient with geographic atrophy (GA). A, B, Annual enlargement rate (ER) of GA is 0.38 mm/year. C, D, CC en face flow images. E, F, CC flow deficits (FDs) in the different regions: FD% and average flow deficit area (FDa) at baseline in R1 (FD%: 17.1%; FDa: 0.0026 mm2), R2 (FD%: 10.7%; FDa: 0.0023 mm2), and R3 (FD%: 10.3%; FDa: 0.0023 mm2).
Acknowledgments
Research supported by grants from Carl Zeiss Meditec, Inc (Dublin, CA), National Eye Institute (R01EY024158, R01EY028753), and the Salah Foundation (Ft. Lauderdale, FL); an unrestricted grant from the Research to Prevent Blindness, Inc (New York, NY); and the National Eye Institute Center Core Grant (P30EY014801) to the Department of Ophthalmology, University of Miami Miller School of Medicine. The funding organization had no role in the design or conduct of this research.
Abbreviations and Acronyms:
- AMD
age-related macular degeneration
- CC
choriocapillaris
- cRORA
complete retinal pigment epithelium and outer retinal atrophy
- ER
enlargement rate
- FD
flow deficit
- GA
geographic atrophy
- RPD
reticular pseudodrusen
- RPE
retinal pigment epithelium
- SD
standard deviation
- SDD
subretinal drusenoid deposit
- SD-OCTA
spectral domain OCT angiography
- SS-OCTA
swept-source OCT angiography
Footnotes
Financial Disclosure(s):
The author(s) have made the following disclosure(s): G.G.: Research support – Carl Zeiss Meditec, Inc; Patent licensed to Carl Zeiss Meditec, Inc (with University of Miami).
P.J.R.: Research support – Carl Zeiss Meditec, Inc, Genentech; Consultant – Achillion Pharmaceuticals, Acucela, Apellis, BoehringerIngelheim, Carl Zeiss Meditec, Chengdu Kanghong Biotech, Ocunexus Therapeutics, Genentech, Healios K.K, Hemera Biosciences, F. HoffmannLa Roche Ltd., Isarna Pharmaceuticals, Lin Bioscience, MacRegen Inc., NGM Biopharmaceuticals, Ocunexus, Ocudyne, Unity Biotechnology; Equity– Apellis, Digisight, Ocudyne.
R.K.W.: Research support e Carl Zeiss Meditec, Inc, Tasso Inc; Consultant – Carl Zeiss Meditec Inc, Insight Photonic Solutions, Kowa; Intellectual property – the Oregon Health and Science University and the University of Washington related to OCT angiography, and licensed to commercial entities, which are related to the technology and analysis methods described in parts of this manuscript.
L.d.S.: Employee – Carl Zeiss Meditec, Inc.
M.K.D.: Employee- Carl Zeiss Meditec, Inc.
HUMAN SUBJECTS: Human subjects were included in this study. The human ethics committees at the University of Miami Miller School of Medicine approved the study. All research adhered to the tenets of the Declaration of Helsinki and compliant with the Health Insurance Portability and Accountability Act of 1996. All participants provided informed consent.
No animal subjects were used in this study.
References
- 1.Sadda SR, Guymer R, Holz FG, et al. Consensus definition for atrophy associated with age-related macular degeneration on OCT: classification of Atrophy Report 3. Ophthalmology. 2018;125:537–548. [DOI] [PMC free article] [PubMed] [Google Scholar]
- 2.Wu Z, Luu CD, Ayton LN, et al. Optical coherence tomography-defined changes preceding the development of drusen-associated atrophy in age-related macular degeneration. Ophthalmology. 2014;121:2415–2422. [DOI] [PubMed] [Google Scholar]
- 3.Holz FG, Sadda SR, Staurenghi G, et al. Imaging protocols in clinical studies in advanced age-related macular degeneration: recommendations from Classification of Atrophy Consensus Meetings. Ophthalmology. 2017;124:464–478. [DOI] [PubMed] [Google Scholar]
- 4.Bearelly S, Chau FY, Koreishi A, et al. Spectral domain optical coherence tomography imaging of geographic atrophy margins. Ophthalmology. 2009;116:1762–1769. [DOI] [PMC free article] [PubMed] [Google Scholar]
- 5.Fleckenstein M, Schmitz-Valckenberg S, Adrion C, et al. Tracking progression with spectral-domain optical coherence tomography in geographic atrophy caused by age-related macular degeneration. Invest Ophthalmol Vis Sci. 2010;51:3846–3852. [DOI] [PubMed] [Google Scholar]
- 6.Nunes RP, Gregori G, Yehoshua Z, et al. Predicting the progression of geographic atrophy in age-related macular degeneration with SD-OCT en face imaging of the outer retina. Ophthalmic Surg Lasers Imaging Retina. 2013;44:344–359. [DOI] [PubMed] [Google Scholar]
- 7.Wolf-Schnurrbusch UE, Enzmann V, Brinkmann CK, Wolf S. Morphologic changes in patients with geographic atrophy assessed with a novel spectral OCT-SLO combination. Invest Ophthalmol Vis Sci. 2008;49:3095–3099. [DOI] [PubMed] [Google Scholar]
- 8.Yehoshua Z, Garcia Filho CA, Penha FM, et al. Comparison of geographic atrophy measurements from the OCT fundus image and the sub-RPE slab image. Ophthalmic Surg Lasers Imaging Retina. 2013;44:127–132. [DOI] [PubMed] [Google Scholar]
- 9.Yehoshua Z, Rosenfeld PJ, Gregori G, et al. Progression of geographic atrophy in age-related macular degeneration imaged with spectral domain optical coherence tomography. Ophthalmology. 2011;118:679–686. [DOI] [PMC free article] [PubMed] [Google Scholar]
- 10.Thulliez M, Motulsky E, Feuer W, et al. En face imaging of geographic atrophy using different swept-source optical coherence tomography scan patterns. Ophthalmol Retina. 2019;2:122–132. [DOI] [PubMed] [Google Scholar]
- 11.Niu S, de Sisternes L, Chen Q, et al. Fully automated prediction of geographic atrophy growth using quantitative spectral-domain optical coherence tomography biomarkers. Ophthalmology. 2016;123:1737–1750. [DOI] [PubMed] [Google Scholar]
- 12.Choi W, Mohler KJ, Potsaid B, et al. Choriocapillaris and choroidal microvasculature imaging with ultrahigh speed OCT angiography. PLoS One. 2013;8:e81499. [DOI] [PMC free article] [PubMed] [Google Scholar]
- 13.Choi W, Moult EM, Waheed NK, et al. Ultrahigh-speed, swept-source optical coherence tomography angiography in nonexudative age-related macular degeneration with geographic atrophy. Ophthalmology. 2015;122:2532–2544. [DOI] [PMC free article] [PubMed] [Google Scholar]
- 14.Choi W, Waheed NK, Moult EM, et al. Ultrahigh speed swept source optical coherence tomography angiography of retinal and choriocapillaris alterations in diabetic patients with and without retinopathy. Retina. 2017;37:11–21. [DOI] [PMC free article] [PubMed] [Google Scholar]
- 15.Kurokawa K, Liu Z, Miller DT. Adaptive optics optical coherence tomography angiography for morphometric analysis of choriocapillaris [Invited]. Biomed Opt Express. 2017;8:1803–1822. [DOI] [PMC free article] [PubMed] [Google Scholar]
- 16.Moreira-Neto CA, Moult EM, Fujimoto JG, et al. Choriocapillaris loss in advanced age-related macular degeneration. J Ophthalmol. 2018;2018:8125267. [DOI] [PMC free article] [PubMed] [Google Scholar]
- 17.Moult E, Choi W, Waheed NK, et al. Ultrahigh-speed sweptsource OCT angiography in exudative AMD. Ophthalmic Surg Lasers Imaging Retina. 2014;45:496–505. [DOI] [PMC free article] [PubMed] [Google Scholar]
- 18.Waheed NK, Moult EM, Fujimoto JG, Rosenfeld PJ. Optical coherence tomography angiography of dry age-related macular degeneration. Dev Ophthalmol. 2016;56:91–100. [DOI] [PMC free article] [PubMed] [Google Scholar]
- 19.Gorczynska I, Migacz JV, Jonnal R, et al. Imaging of the human choroid with a 1.7 MHz A-scan rate FDML swept source OCT system. Proc SPIE Int Soc Opt Eng. 2017:10045. [Google Scholar]
- 20.Fleckenstein M, Mitchell P, Freund KB, et al. The progression of geographic atrophy secondary to age-related macular degeneration. Ophthalmology. 2018;125:369–390. [DOI] [PubMed] [Google Scholar]
- 21.Sacconi R, Corbelli E, Carnevali A, et al. Optical coherence tomography angiography in geographic atrophy. Retina. 2018;38:2350–2355. [DOI] [PubMed] [Google Scholar]
- 22.Ahn J, Yoo G, Kim JT, et al. Choriocapillaris layer imaging with swept-source optical coherence tomography angiography in lamellar and full-thickness macular hole. Graefes Arch Clin Exp Ophthalmol. 2018;256:11–21. [DOI] [PubMed] [Google Scholar]
- 23.Borrelli E, Shi Y, Uji A, et al. Topographical analysis of the choriocapillaris in intermediate age-related macular degeneration. Am J Ophthalmol. 2018;196:34–43. [DOI] [PubMed] [Google Scholar]
- 24.Lane M, Moult EM, Novais EA, et al. Visualizing the choriocapillaris under drusen: comparing 1050-nm swept-source versus 840-nm spectral-domain optical coherence tomography angiography. Invest Ophthalmol Vis Sci. 2016;57:OCT 585–590. [DOI] [PMC free article] [PubMed] [Google Scholar]
- 25.Moult EM, Waheed NK, Novais EA, et al. Swept-source optical coherence tomography angiography reveals choriocapillaris alterations in eyes with nascent geographic atrophy and drusen-associated geographic atrophy. Retina. 2016;36(Suppl 1):S2–S11. [DOI] [PMC free article] [PubMed] [Google Scholar]
- 26.Nassisi M, Shi Y, Fan W, et al. Choriocapillaris impairment around the atrophic lesions in patients with geographic atrophy: a swept-source optical coherence tomography angiography study. Br J Ophthalmol. 2018. Aug 21 [Epub ahead of print]. [DOI] [PubMed] [Google Scholar]
- 27.Zhang Q, Chen CL, Chu Z, et al. Automated quantitation of choroidal neovascularization: a comparison study between spectral-domain and swept-source OCT Angiograms. Invest Ophthalmol Vis Sci. 2017;58:1506–1513. [DOI] [PMC free article] [PubMed] [Google Scholar]
- 28.Zhang Q, Zheng F, Motulsky EH, et al. A novel strategy for quantifying choriocapillaris flow voids using swept-source OCT angiography. Invest Ophthalmol Vis Sci. 2018;59:203–211. [DOI] [PMC free article] [PubMed] [Google Scholar]
- 29.Zhang A, Zhang Q, Wang RK. Minimizing projection artifacts for accurate presentation of choroidal neovascularization in OCT micro-angiography. Biomed Opt Express. 2015;6:4130–4143. [DOI] [PMC free article] [PubMed] [Google Scholar]
- 30.Zhang A, Zhang Q, Chen CL, Wang RK. Methods and algorithms for optical coherence tomography-based angiography: a review and comparison. J Biomed Opt. 2015;20:100901. [DOI] [PMC free article] [PubMed] [Google Scholar]
- 31.Kvanta A, Casselholm de Salles M, Amren U, Bartuma H. Optical coherence tomography angiography of the foveal microvasculature in geographic atrophy. Retina. 2017;37:936–942. [DOI] [PubMed] [Google Scholar]
- 32.Roisman L, Zhang Q, Wang RK, et al. Optical coherence tomography angiography of asymptomatic neovascularization in intermediate age-related macular degeneration. Ophthalmology. 2016;123:1309–1319. [DOI] [PMC free article] [PubMed] [Google Scholar]
- 33.de Oliveira Dias JR, Zhang Q, Garcia JMB, et al. Natural history of subclinical neovascularization in nonexudative age-related macular degeneration using swept-source OCT angiography. Ophthalmology. 2018;125:255–266. [DOI] [PMC free article] [PubMed] [Google Scholar]
- 34.FDA. PLEX™ Elite 9000 Swept-Source OCT. https://www.accessdata.fda.gov/cdrh_docs/pdf16/K161194.pdf.AccessedAugust 2018.
- 35.Zheng F, Gregori G, Schaal KB, et al. Choroidal thickness and choroidal vessel density in nonexudative age-related macular degeneration using swept-source optical coherence tomography imaging. Invest Ophthalmol Vis Sci. 2016;57:6256–6264. [DOI] [PMC free article] [PubMed] [Google Scholar]
- 36.Zhang Q, Shi Y, Zhou H, et al. Accurate estimation of choriocapillaris flow deficits beyond normal intercapillary spacing with swept source OCT angiography. Quant Imaging Med Surg. 2018;8:658–666. [DOI] [PMC free article] [PubMed] [Google Scholar]
- 37.Fang Zheng M, Zhang Q, Shi Y, et al. Age-dependent changes in the macular choriocapillaris of normal eyes imaged with swept-source OCT angiography. Am J Ophthalmol. 2019;200:110–122. [DOI] [PMC free article] [PubMed] [Google Scholar]
- 38.Ramrattan RS, van der Schaft TL, Mooy CM, et al. Morphometric analysis of Bruch’s membrane, the choriocapillaris, and the choroid in aging. Invest Ophthalmol Vis Sci. 1994;35:2857–2864. [PubMed] [Google Scholar]
- 39.McLeod DS, Grebe R, Bhutto I, et al. Relationship between RPE and choriocapillaris in age-related macular degeneration. Invest Ophthalmol Vis Sci. 2009;50:4982–4991. [DOI] [PMC free article] [PubMed] [Google Scholar]
- 40.Biesemeier A, Taubitz T, Julien S, et al. Choriocapillaris breakdown precedes retinal degeneration in age-related macular degeneration. Neurobiol Aging. 2014;35:2562–2573. [DOI] [PubMed] [Google Scholar]
- 41.Nesper PL, Soetikno BT, Fawzi AA. Choriocapillaris non-perfusion is associated with poor visual acuity in eyes with reticular pseudodrusen. Am J Ophthalmol. 2017;174:42–55. [DOI] [PMC free article] [PubMed] [Google Scholar]
- 42.Schaal KB, Legarreta AD, Feuer WJ, et al. Comparison between widefield en face swept-source OCT and conventional multimodal imaging for the detection of reticular pseudodrusen. Ophthalmology. 2017;124:205–214. [DOI] [PubMed] [Google Scholar]
- 43.Yehoshua Z, de Amorim Garcia Filho CA, Nunes RP, et al. Systemic complement inhibition with eculizumab for geographic atrophy in age-related macular degeneration: the COMPLETE study. Ophthalmology. 2014;121:693–701. [DOI] [PMC free article] [PubMed] [Google Scholar]


