

Abstract
It is widely assumed crime and related concerns, including neighborhood incivilities and fear of crime, are barriers to physical activity (PA). Past studies reveal mixed evidence. Studies of impacts for crime-protective factors are less common but have similarly mixed results. This paper evaluates a comprehensive transdisciplinary conceptual framework of cross-sectional associations between crime-related perceptions and reported minutes/week of recreational walking inside and outside one’s home neighborhood. Safe and Fit Environments Study (SAFE) recruited and surveyed 2,302 participants from adolescents to older adults from four U.S. metropolitan areas. A zero-inflated model estimated two components of each outcome: whether the respondent walked, and minutes/week walked. Correlates of recreational walking were location-specific, differing based on walking location. Fear of crime, risk evaluation, victimization, and incivilities were not consistently associated with walking for recreation inside one’s neighborhood. People with crime concerns about their own neighborhoods, however, more commonly walked for recreation outside their neighborhoods. Protective crime-related perceptions that seldom have been studied in relation to PA, such as street efficacy (i.e., the perceived ability to avoid and manage danger), were strongly associated with recreational walking in both locations, indicating the additional heuristic value of the SAFE conceptual framework.
Keywords: exercise, fear of crime, perceptions of crime, physical activity, public health, safety
Introduction
Physical inactivity is the 4th leading cause of death and an important modifiable risk factor for cardiovascular disease and other non-communicable diseases (Guthold, et al., 2018; Xu et al., 2022). The majority of youth, adults, and older adults do not meet moderate-to-vigorous physical activity (PA) recommendations when measured by self-report or objectively (Chen et al., 2021; Elgadall, et al., 2022; Piercy et al., 2018). Common wisdom is that concerns about crime and crime-related problems, such as fear of crime and likelihood of victimization, could interfere with PA and further impede PA levels, compounding the already widespread challenge of inadequate PA across the life span.
However, literature reviews reveal mixed evidence that crime and the wide-range of crime-related issues are associated with low PA (e.g., Bracy et al., 2014; Cerin et al., 2017; Da Silva et al., 2016; Ding et al., 2011; Foster & Giles-Corti, 2008). Across age groups, studies reveal inconsistencies when examining such potential associations (Bennett et al., 2007; Richardson, et al., 2017; van Dyck et al., 2015; Wang et al., 2016). For example, van Dyck and colleagues, in a large multi-country study, found a positive relation between perceived safety from crime and PA only for older adults (over 55 years) compared to younger respondents. An earlier study found no differences across age groups for perceived crime concerns and recreational walking (Shigematsu et al., 2009). Ghani and colleagues (2016) found significant between-neighborhood variation in the association between each age group and at every level of walking for recreation, suggesting that neighborhood characteristics and perceptions of those characteristics may be related to walking habits differently across age groups.
Findings of crime concerns and PA also varied across types of crime or crime categories (e.g., violent versus property crime, or stranger crime versus non-stranger crime) (Carver, Timperio & Crawford, 2008; McDonald, 2008). Cerin and colleagues’ systematic review of older adults’ walking behavior (2017) found few studies included a range of variables that captured crime-related concerns and non-transportation-related personal safety. A review of studies by the U.S. Department of Health and Human Services (2015) concluded the relation between crime/crime concerns and walking was unclear.
Inconsistent findings likely stem in part from an oversimplified “crime and related concerns reduce physical activity” hypothesis, as crime and PA are each highly complex phenomena (Bauman et al., 2012; Brantingham & Faust, 1976; Lane et al., 2014; Sallis et al., 2006; Taylor, 2015). Contributing to mixed evidence were cross-study variations in measurement and unclear definitions of key constructs. For example, survey-based measures asking about “safety” sometimes conflate crime, civic infractions, and traffic dangers (Cerin et al., 2017). In addition, measures of fear of crime varied widely (Lane et al., 2014), often without making the distinction between fear (emotionally-based) and perceived risk (cognitively-based) (Foster et al., 2013). This distinction is important because researchers suggested the mechanism by which crime may affect individual behavior was through perceived risk of victimization and fear (Lorenc et al., 2012). Yet, most studies did not examine side-by-side with fear the role of experiences with victimization or behavioral adaptations (e.g., taking actions to protect oneself). Further, few studies distinguished between positive and negative coping responses or adaptations (Lane et al., 2014) or included measures that captured perceived ability to avoid danger while walking. PA studies did show that feeling unsafe may diminish confidence in the ability to be more physically active (Bennett et al., 2007). Overall, studies showed the capacity for fear (or actual crime levels) to deter walking for recreation is not fixed, but dependent on a range of crime-related concerns and other environmental factors (Cerin et al., 2017; Foster et al., 2014a; Foster et al., 2014b). A construct known as “street efficacy,” an individual judgement-based measure of confidence to avoid street-level confrontations, has been deemed important among young people when navigating high crime environments (Sharkey 2006; Yuan et al., 2016), but has not been included in studies examining the correlates of walking behavior.
Regarding PA, few studies geographically distinguished the location of PA (e.g., whether the activity was in the home neighborhood or beyond). Activity-dependent and location-specific variations in correlates of walking behavior seem likely (Cerin et al., 2017; Li et al., 2005; Lorenc et al., 2012). For instance, individuals may avoid activity for recreational purposes or avoid it only in places they perceive as unsafe. Authors of a review (Da Silva et al., 2016) suggested the decision to perform PA far away from the individual’s residence may be influenced by higher perceived safety from crime in that area.
The present paper relied on data from the Safe and Fit Environments (SAFE) Study (Patch et al., 2019) to examine associations between crime-related perceptions and recreational walking in a sample from four U.S. metropolitan areas. The analyses focused on independent variables elucidated in a transdisciplinary conceptual framework of crime and PA (i.e., the SAFE Conceptual Framework; Patch et al., 2019). These measures are “crime-related perceptions” related to one’s social and physical environments, such as collective efficacy, neighborhood integration, incivilities, risk of victimization, as well as intrapersonal evaluations (e.g., fear of crime).
For each construct, theory or empirical studies provided at least some support for its relation with PA. The conceptual framework was based on a rigorous review of the literature to capture a comprehensive range of cognitive, affective, and behavioral responses to crime. The current paper is the first empirical examination using the transdisciplinary conceptual framework to examine associations of crime-related concerns to PA. We use self-reported crime concerns (i.e., perceptions) because they capture the wide range of psychological and social dimensions expected to influence individual behavior. Perceptions of crime can reveal associations that administrative crime data might not capture. The extant literature supports the assertion that people tend to navigate their environments based on their cognitive maps, which are shaped by their perceptions and experiences (Jackson, 2008; Jacobs, 1961; Lynch, 1960). These cognitive maps can affect choice of walking routes and destinations. Areas perceived as unsafe, regardless of actual crime rates, may be avoided, leading to different walking patterns (Foster et al., 2014a). Some studies showed administrative crime data were not associated with walking, or not as strongly associated with walking, compared to perceptions of crime, particularly when controlling for neighborhood disadvantage (Foster et al., 2021). A growing literature indicates individuals perceive both incivilities and crime differently based on their own personal and situational biases (Foster, et al., 2021; Sampson & Raudenbush, 2004; Wallace, 2015). Understanding perceptions, then, within a comprehensive framework allows for development of more promising contextually-relevant policy recommendations.
We examine walking for recreation as the outcome because it is considered the most common form of leisure activity, is a behavior that all age groups do (Outdoor Foundation, 2022), and is viewed as the “easiest” form of activity to perform (U.S. Department of Health and Human Services, 2015). Walking for recreation is a “discretionary” PA that is expected to be more sensitive to crime perceptions than walking for transport (Murtagh et al., 2010). Incidence of other outdoor recreational activities, such as cycling, would have a low prevalence within some age groups (e.g., older adults), leading to less representative and reliable measures.
The present paper builds on previous published work describing development of the SAFE survey measures and examining their psychometric properties (Patch et al., 2019; Roesch et al., 2021). Walking for recreation outcomes were queried separately for “inside” (within) one’s neighborhood and “outside” one’s neighborhood, with the first aim of this paper centered on examining associations between model constructs and walking inside one’s neighborhood. The crime-related concerns are conceptualized as perceptions across three levels of influence: macro-level neighborhood context: crime prevention through environmental design (CPTED); meso-level social dynamics: collective efficacy and neighborhood integration; and micro-level individual variables: fear of crime, evaluation of crime risk, incivilities, previous victimization, avoidance behaviors, protective behaviors, and street efficacy.
The second aim is to test the hypothesis that these ten crime-concern constructs had different relations with walking outside one’s neighborhood. As stated earlier, walking is by far the most common recreational activity in the U.S. The activity usually occurs outdoors, potentially exposing walkers to crime risk. Therefore, walking for recreation was considered an important category of PA likely sensitive to crime-related perceptions. For this study, crime-related perceptions were primarily reported with reference to participants’ “neighborhood” or “local area,” (defined as a “10 to 15-minute walk in any direction” from home). Stronger concerns for personal safety might both dampen walking time inside one’s neighborhood and spatially displace some of that walking to outside-the-neighborhood locations. Extant research indicates substantial amounts of PA occur outside one’s residential neighborhood, but research on locations away from the home environment is limited (Hurvitz, et al., 2014). Hence, differentiating the correlates of where one walks is important for research, policy, and practice. Neighborhood strengths that might mitigate crime concerns include social networks and support constructs of neighborhood integration and collective efficacy (McNeill et al., 2006). These factors might have location-specific effects resulting in more inside-neighborhood walking and less beyond-neighborhood walking. Similarly, crime-related coping behaviors such as protective (e.g., walking with someone or with a dog), and risk-avoidance behaviors (e.g., not walking at times of day or places perceived as risky), may exhibit differential associations across walking locations.
A third aim is exploratory: to test whether the relations of crime-related constructs to the two walking outcomes varied by age group and sex. These two characteristics were chosen because they are well-documented correlates of PA (Bauman et al. 2012), and findings are inconsistent regarding whether crime-related problems have a differential impact on PA by sex and age group. Some evidence suggests older adults, adolescents, and women may be more sensitive to crime and reduce PA, but the evidence is not conclusive (Foster & Giles-Corti, 2008; Reid, Foster, Mavoa & Rachele, 2024). Studies exploring moderators may help guide tailoring of PA recommendations and related interventions to specific population subgroups (Rees-Punia et al., 2018). Taking the three aims together, evaluation of a more conceptually complete and diverse set of constructs that better incorporate criminology scholarship could help to elucidate nuances of whether and how crime-related concerns are associated with PA for different people under different circumstances.
Following the conceptual framework (Figure 1), we anticipated greater perceived crime risk and self-reported victimization in one’s neighborhood to be negatively associated with recreational walking inside one’s neighborhood but positively associated with being active outside it. We also expected higher perceived neighborhood orderliness, cohesion, and more use of personal tactics for minimizing risk (e.g., protective behaviors) would be positively associated with recreational walking inside one’s neighborhood. It is difficult to hypothesize correlates of walking outcomes outside one’s neighborhood, given the limited theorizing and evidence about location-specific PA (Da Silva et al. 2016; Hurvitz et al., 2014), but one might assume neighborhood crime concerns that discourage walking inside one’s neighborhood might lead individuals to displace recreational walking to safe places outside one’s neighborhood. It is similarly difficult to hypothesize about the effects of age group and sex as moderators.
Figure 1.
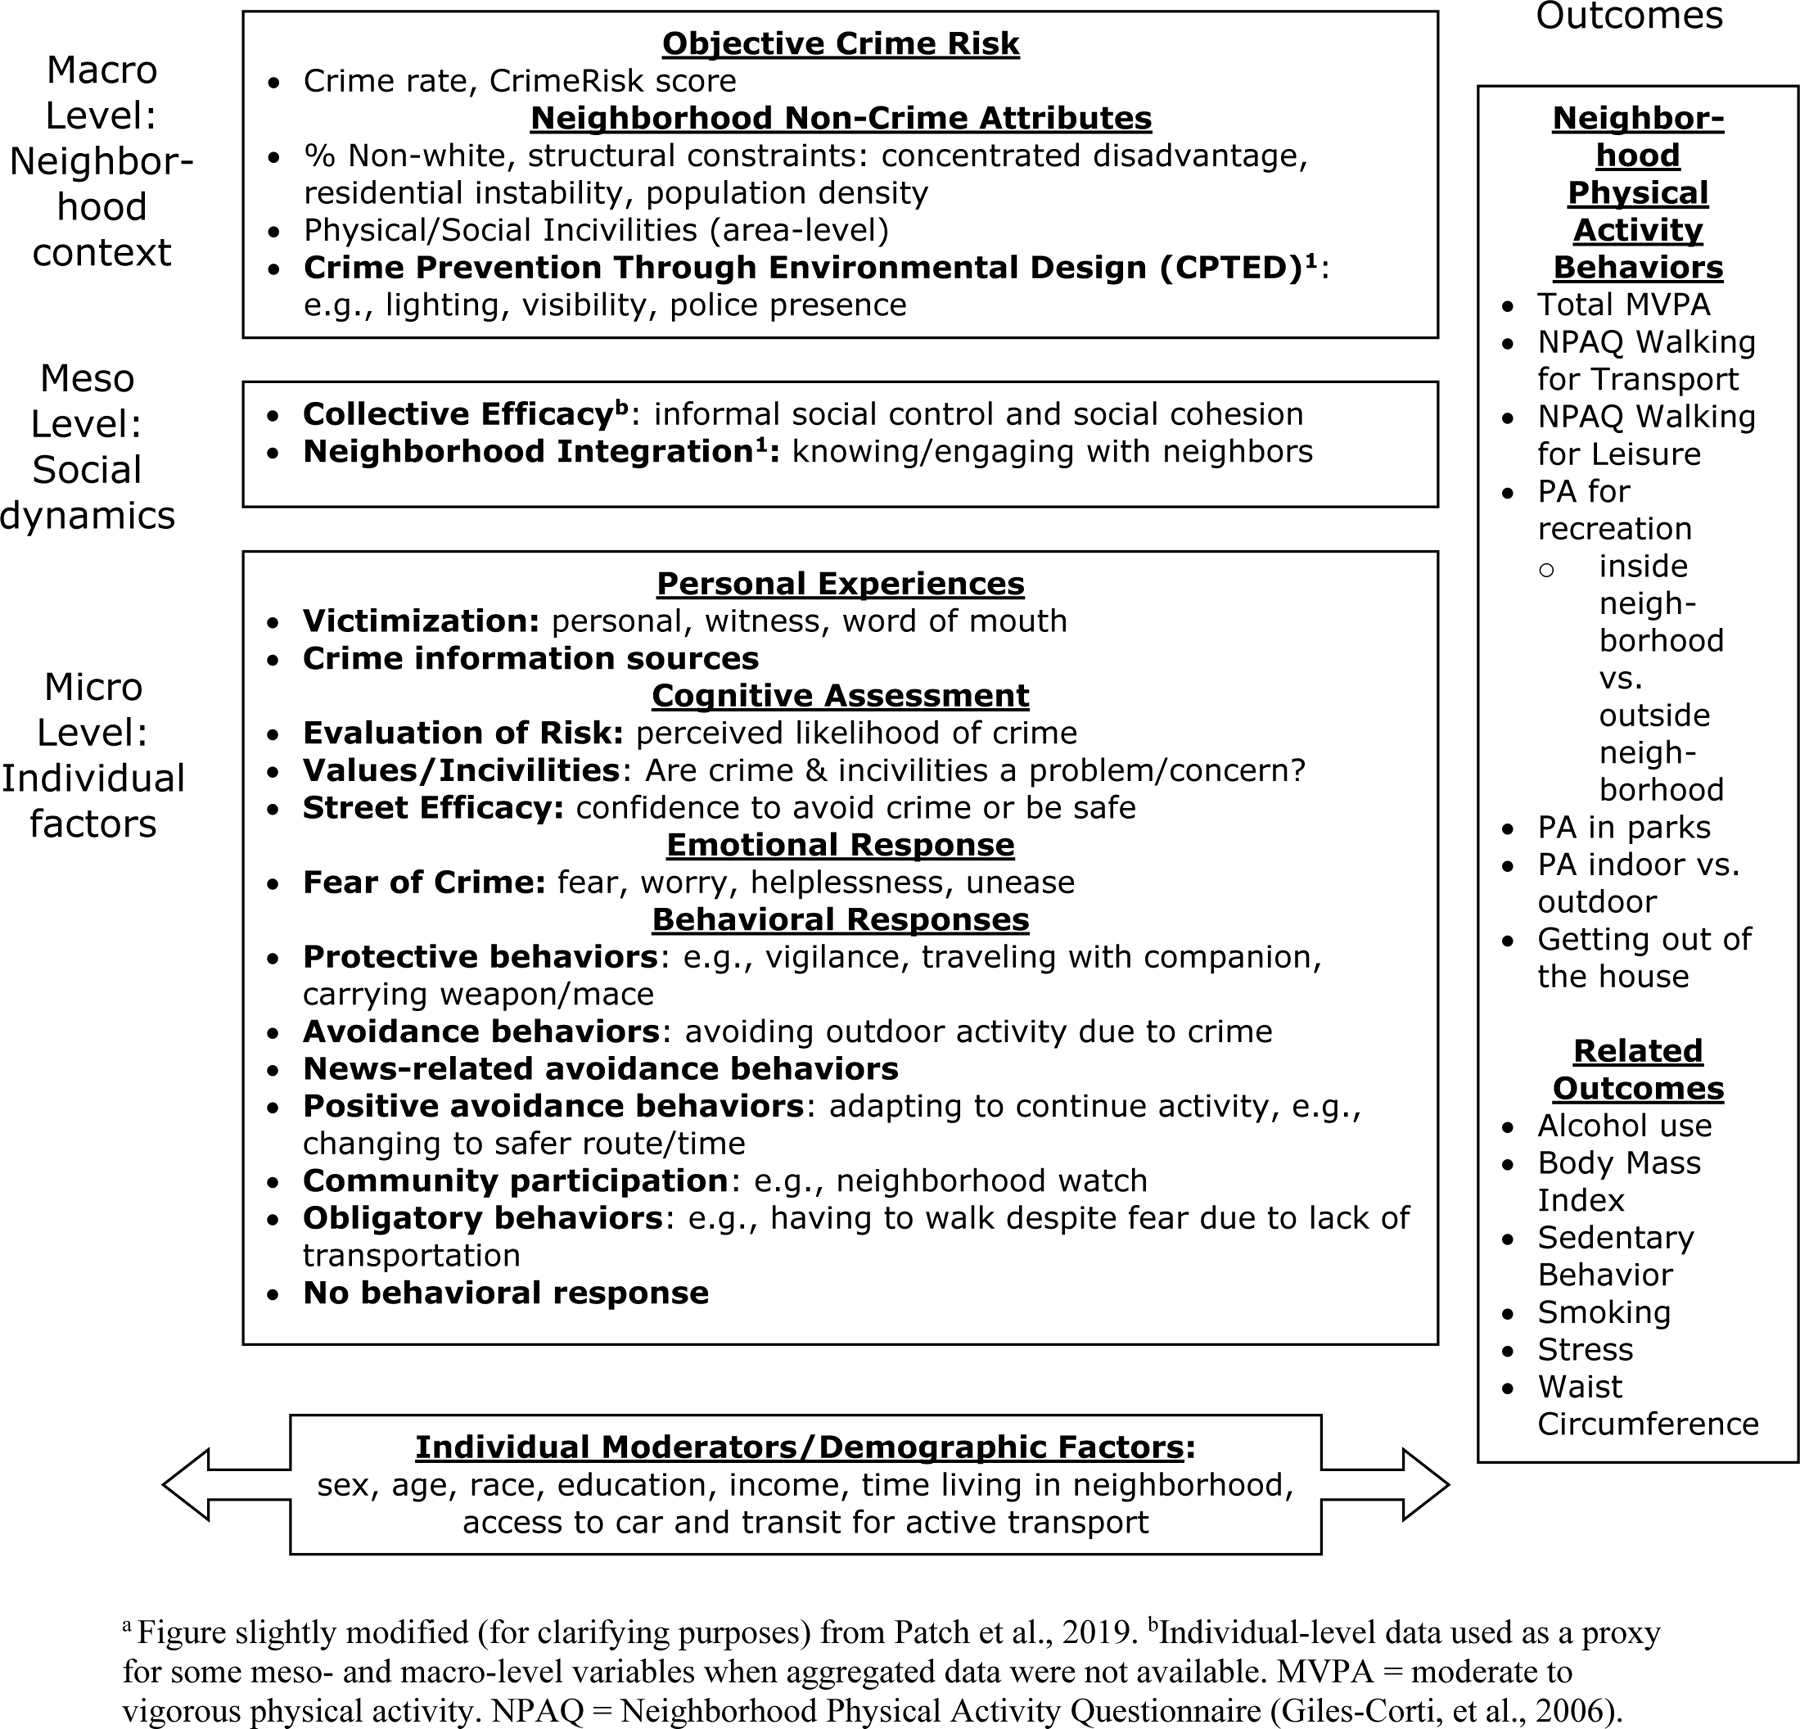
SAFE Study conceptual frameworka
It is reasonable to expect that some subgroup differences in patterns of associations could emerge, particularly regarding the relation of the emotional construct of fear with PA by sex and age (Lane et al., 2014; Tulloch, 2000). Past research indicated consistent findings that older women tended to be more fearful on average than other demographic groups (Lane et al., 2014), and some studies found associations between fear of crime and walking among females and only for males under certain conditions (e.g., Roman & Chalfin, 2008).
Overview of the Conceptual Framework
The SAFE conceptual framework is shown in Figure 1. More details can be found in Patch et al. (2019). Briefly, the hypothesized correlates are organized into four clusters: (1) macro-level inputs: features of community such as demographics, crime rates, and neighborhood-level physical design characteristics; (2) meso-level inputs: social features arising from face-to-face contact with others or interpersonal relationships; (3) micro-level inputs, endogenous: individual-level perceptions, emotions, cognitions, and behaviors that have implications for health behaviors; and (4) micro-level inputs, exogenous: individual-level demographic characteristics known to be correlates of PA behavior (Bauman et al., 2012). The framework attempts to overcome some of the conceptual and measurement limitations described earlier while drawing from theoretical and empirical criminological literature. We relied on the seminal work of Dubow and colleagues “Reactions to Crime” (1979) and Lane et al., (2014) to ensure we included a full array of carefully operationalized crime concerns, measures of prior victimization and potential behavioral responses. We were careful to distinguish among judgements (i.e., perceptions about the objective character of crime, such as perceived risk and ability to navigate spaces), values (i.e., assessment of the importance of particular crime/incivility issues as a public or personal matter as compared to others), and emotions (e.g., worry or anger) related to crime concerns. We attempted to choose clear constructs with face validity and commonly-understood labels. The framework was developed to operationalize all of these domains of crime-related concerns and behaviors, and is purposely recursive in its broad outline, ignoring feedback dynamics. This was an important simplification for testing framework components at this early research stage (Coleman, 1990).
Prior analyses using the SAFE survey measures found scales had good test-retest reliability. All scales used in the current study (and tested by age group) had intraclass correlation coefficients (ICC) of test-retest reliability greater than 0.50, with the exception of the evaluation of risk scale for older adults (ICC=0.34). A few scales were originally developed to be divided into sub-scales (e.g., CPTED, victimization, avoidant and protective behaviors), but in some places the age-group-specific reliability was low (Patch et al., 2019). Given this issue, we combined (i.e., aggregated) some sub-scales. An additional psychometric evaluation of (sub)scales (Roesch et al., 2021) found consistent factorial validity and internal consistency reliability across the measures used in the current study, displaying statistically and practically significant factor loadings and internal consistency values in the overall sample and across the age groups. Similar to the test-retest reliability findings, some of the subscales exhibited weaknesses (i.e., subscales within CPTED and protective and avoidant behaviors), but these subscales were aggregated in the current study. Importantly, reliability and validity analyses revealed age-specific indicators were not needed.
Methods
Recruitment
SAFE participants were initially recruited from four metropolitan U.S. regions: several Maryland counties, plus Baltimore city; King County (including Seattle), Washington; San Diego County, California; and Maricopa County (including Phoenix), Arizona. Most participants in the SAFE Study were re-recruited from one of four previous studies conducted by the same research team: Neighborhood Quality of Life Study (adults ages 18 to 65 years; Sallis et al., 2009), Senior Neighborhood Quality of Life Study (older adults ages 66 years and above; King et al., 2011), Teen Environment and Neighborhood Study (adolescents ages 12 to 17 years; Sallis et al., 2018), and Neighborhood Impact on Kids Study (children ages 6 to 12 years; Saelens et al., 2012). Additional recruitment from the same regions was conducted to increase the sample, with oversampling from higher-crime and lower-socioeconomic status areas to increase diversity of key variables. Maricopa County, Arizona was the additional region, using WalkIT Arizona respondents (adults ages 18 to 60 years; Adams et al., 2019). Across all regions, the same recruitment methods were utilized for the current study.
Institutional Review Board approval and participant consent (and assent for adolescents) was obtained. SAFE Study recruitment procedures were designed to maintain an approximate balance of participants living in higher- and lower-income neighborhoods and in higher- and lower-crime neighborhoods within each of four age groups described below. Neighborhoods (census block groups) were defined as higher- or lower-income based on median household income of the census block group relative to the corresponding county-level median household income. Higher- and lower-crime areas were defined using Applied Geographic Solution’s 2013 CrimeRisk index that links census demographic information to Uniform Crime Report data (Applied Geographic Solutions, 2010). Residential census block groups were categorized as higher- or lower-crime risk relative to their median respective county-level CrimeRisk value.
Participants
SAFE survey data were collected between January 2015 and May 2018. The sample of 2,302 respondents included: 336 adolescents (12–17 years), 572 young adults (18–39 years), 939 middle-aged adults (40–65 years), and 455 older adults (66+ years of age). Note that for the three regions in which sample members were re-recruited, the years elapsed since the original study advanced the age of respondents for the current study, with no children <12 years old. All participants completed their own surveys.
Survey Measures of Crime-Related Concerns
Table 1 describes the survey-reported crime-related scales, providing representative items, response categories, and item/scale sources. The table also notes the hypothesized direction of the relation between the construct and the two outcomes. The complete survey is available in supplemental materials; more information about item adaptation is available online at https://www.drjimsallis.com/safe-and-fit-environments-study-safe. Because violent crimes are relatively rare in the U.S. population (16.5 violent victimizations per 1,000 persons in 2021; Thompson & Tapp, 2023), and there has been evidence that crime perceptions are a key aspect of walking behavior, we focus this study on the self-report measures related to crime perceptions— not actual crime levels. Given the rare nature of violence, scholars have theorized limited direct effects of actual crime and focused more on perceptions (see for instance, Lorenc et al., 2012). However, we recognize the two domains of crime measures are complementary.
Table 1.
SAFE Study Measures. Crime-related scales and walking for recreation items and scoring: Survey scales with operational definitions, number of items, scale creation information, sample items, response options, and expected direction of relation with recreational walking outcomes.
| Scale Measure | Operational definition, number of items, scale creation method (e.g., mean, sum), sample item, and response options | Item/Scale Sources | Expected Relation w/Walking Inside Neighbrhd. | Expected Relation w/Walking Outside Neighbrhd. |
|---|---|---|---|---|
| Macro Level: Neighborhood Context | ||||
| Crime Prevention Through Environmental Design (CPTED) | Reducing opportunities for crime and attractiveness of targets through surveillance (features that maximize visibility); maintenance (upkeep of homes, buildings, landscaping, parks); access control (features that deny access, like locked gates); and territorial reinforcement (barriers, like signage or fencing, that reinforce a sense of ownership). Four original subscales. Item response options: 1=disagree strongly, 2=disagree somewhat, 3=agree somewhat, 4=agree strongly CPTED Overall: mean of 4 subscales Surveillance: 5 items; e.g., “When I walk in my neighborhood, I know there are residents or business owners watching the streets.” Maintenance: 3 items; e.g., “The homes, buildings, and landscaping in my neighborhood are well-maintained.” Access Control: 2 items; e.g., “A lot of the homes or apartment buildings in my neighborhood have fences, locked gates, entrances and/or metal security doors to keep out criminals.” Territorial Reinforcement: 2 items; e.g., “A lot of my neighbors have signs on their property signaling for people to keep out.” |
Concepts drawn from: Fleiss 1986; Lexell & Downham 2005; Giles-Corti et al., 2006 | Positive | Negative |
|
| ||||
| Meso Level: Social Dynamics | ||||
| Collective efficacy | Informal social control and social cohesion. 9 items; mean. e.g., “People in my neighborhood can be trusted.” 1=disagree strongly… 4=agree strongly | Taken from: Sampson, et al., 1997 | Positive | Negative |
| Neighborhood integration | Extent to which the individual knows and engages with neighbors. 6 items; mean. e.g., “I know many of the people in my neighborhood by name.” 1=disagree strongly… 4=agree strongly |
Adapted from: Sheidow et al, 2001; Thornberry et al., 2003; Tolan et al., 2001 | Positive | Negative |
|
| ||||
| Micro Level: Individual Factors (Personal Experiences) | ||||
| Exposure to victimization | Assesses recent victimization and exposure (≤12 months), past victimization (>12 months), witnessing neighborhood crime, or hearing about neighborhood crime. Four original subscales combined. Item response options: never=0, 1 time=1, 2–5 times=3.5, 6 or more times=6 Victimization Exposure Overall: mean of 4 subscales -- Recent Victimization: mean of 4 items; e.g., “In the past 12 months, how many times have YOU been the victim of any of the following… A shooting or attempted shooting?” -- Past Victimization: mean of 4 items; e.g., “Prior to the past 12 months, how many times have YOU ever been the victim of any of the following… Property crimes (including theft, motor vehicle theft, burglary, vandalism)?” -- Witnessing Crime: mean of 4 items; e.g., “In the past 12 months, how many times have you WITNESSED any of the following happening to SOMEONE ELSE in your neighborhood… Harassment, verbal abuse, or bullying?” -- Hearing about Crime: mean of 4 items; e.g., “In the past 12 months, how many times have you HEARD (or seen evidence) of any of the following happening to SOMEONE ELSE in your neighborhood…. Other personal crimes (including being beat up, robbed, mugged, sexually assaulted, or attacked)?” |
Concepts drawn from: Radar et al, 2007 | Negative | Positive |
|
| ||||
| Micro Level: Individual Factors (Cognitive Assessments) | ||||
| Risk evaluation | Cognitive assessment of likelihood of crime. 12 items; mean, then dichotomized (due to low variability) at a threshold of 1 to reflect Likert scale categories (<=1 coded as 0 and >1 coded as 1). e.g., “How likely is it that in the next year, you will be a victim of crime when you are in a local park?” 1=very unlikely, 2=somewhat unlikely, 3=somewhat likely, 4=very likely |
Adapted from: Dubow et al.,1979 ; Jackson, 2011; LaGrange et al., 1992 | Negative | Positive |
| Incivilities | Concerns relating to personal intolerance of the respondent to crime and incivilities. 17 items; mean. “Please circle to what extent the issue is a problem in your neighborhood… e.g., gang activity.” 1=not present in my neighborhood; 2=present, but not a problem; 3=present, somewhat a problem; 4=present, big problem |
Adapted from: Covington & Taylor, 1991; LaGrange, et al., 1992; Mason et al., 2013 | Negative | Positive |
| Street efficacy | Confidence in the ability to avoid crime or to find ways to be safe. 4 items; mean. e.g., “I am confident I can avoid crime because I am good at “fitting in.” 1=disagree strongly… 4=agree strongly |
Concepts drawn from: Sharkey, 2006; Yuan, et al., 2016 | Positive | Negative |
|
| ||||
| Micro Level: Individual Factors (Emotional Responses to Crime) | ||||
| Fear of crime | Emotional response related to fear, worry, helplessness, and uneasy feelings. 13 items; mean. e.g., “I am fearful of being a victim of crime when walking for recreation, health, or fitness in my neighborhood.” 1=disagree strongly… 4=agree strongly |
Adapted from: Liska & Baccaglini, 1990; Jackson, 2011; Chadee et al., 2007; Rader et al., 2007 | Negative | Positive |
|
| ||||
| Micro Level: Individual Factors (Behavioral Responses to Crime) | ||||
| Protective behaviors | Measures taken to make victimization more challenging for offender by minimizing chances of being targeted/harm if victimized. 13 items; mean. “In the past 12 months when you have gone outside, how often have you done the following things to reduce your chances of becoming a victim of crime… taken someone with you for safety in numbers?” 1=never, 2=rarely, 3=sometimes, 4=often |
Adapted from: Lavrakas & Lewis, 1980. Tewksbury &, Mustaine, 2003 | Positive | Negative |
| Avoidance behaviors: | Measures taken to decrease exposure to crime. Summed four original subscales. Sample items below. 1=never… 4=often Avoidance Behaviors Overall: sum of 4 original subscales -- Avoidance Behavior, Daylight, Alone: mean of 5 items; e.g., “In the past 12 months, how often have you avoided going outside in your neighborhood to reduce your chance of becoming a victim of crime… when it’s daylight and you are alone?” -- Avoidance Behavior, Daylight, with others: mean of 5 items; e.g., “In the past 12 months, how often have you avoided being in a local park to reduce your chance of becoming a victim of crime… when it’s daylight and you are with other people?” -- Avoidance Behavior, Dark, alone: mean of 6 items; e.g., “In the past 12 months, how often have you avoided walking in places with poor lighting in your neighborhood AFTER DARK to reduce your chance of becoming a victim of crime… when it’s dark and you are alone?” -- Avoidance Behavior, Dark, with others: mean of 6 items; e.g., “In the past 12 months, how often have you avoided walking for recreation, health, or fitness in your neighborhood to reduce your chance of becoming a victim of crime… when it’s dark and you are with others?” |
Adapted from: Rader et al., 2007; Lavrakas & Herz, 1982; Skogan & Maxfield, 1981 | Negative | Positive |
|
| ||||
| Physical Activity Outcomes | ||||
| Walking for recreation: inside and outside of your neighborhood (Giles-Corti et al., 2006) | Walking for recreation, health or fitness inside versus outside your neighborhood. From the inside Neighborhood Physical Activity Questionnaire (NPAQ) 2 items for INSIDE neighborhood and 2 items for OUTSIDE your neighborhood used to compute recreation-walking minutes per week inside neighborhood and minutes per week outside neighborhood. -- how many days per week do you walk for recreation, health or fitness INSIDE / OUTSIDE your neighborhood? -- average time (minutes) you usually spend walking on ONE of those days for recreation, health or fitness (compute: minutes per day x days per week = “minutes per week”) |
Adapted from: Giles-Corti et al., 2006 | NA | NA |
Note: Items were “taken from” a source if the previously created scale was used without material change. Items were “adapted from” a source if used with some material changes. “Concepts were drawn” from a source if the new items were loosely based on previous scales or research findings but comprise mostly new language. See Patch et al., 2019 for more detailed information about scales and sources. The complete survey is available at https://www.drjimsallis.com/safe-and-fit-environments-study-safe.
To increase indicator variation across age group by sex strata for moderation analyses, previously separate construct subscales for CPTED, exposure to victimization, and avoidance behaviors were combined (i.e., subscales averaged to create an overall scale representing each construct - see Figure 1). Four scales that are part of the conceptual framework—crime news sources, community participation, news-related avoidance behaviors, and news-related positive avoidance behaviors—were not included in analyses due to lack of variability in these measures across subgroups. Ten indices representing key constructs in the SAFE conceptual framework were examined herein (see Statistical Approach section). These indices exhibited adequate variability across moderator subgroup-strata. Descriptive information appears in Table 2.
Table 2.
Descriptive statistics for the 10 SAFE scales examined as correlates in the statistical models: Overall and by age group
| SCALE (Range) | Overall M (SD) | Adolescents (12–17 yrs) M (SD) | Young Adults (18–39 yrs) M (SD) | Middle Age Adults (40–65 yrs) M (SD) | Older Adults (66+ yrs) M (SD) |
|---|---|---|---|---|---|
| Fear of crime | 1.56 (0.52) | 1.68 (0.57) | 1.64 (0.55) | 1.49 (0.47) | 1.53 (0.52) |
| Risk evaluation (binary) | 0.60 (0.49) | 0.66 (0.48) | 0.60 (0.49) | 0.57 (0.50) | 0.60 (0.49) |
| Incivilities | 1.37 (0.40) | 1.40 (0.38) | 1.43 (0.46) | 1.34 (0.37) | 1.32 (0.39) |
| Exposure to victimization | 0.24 (0.30) | 0.22 (0.30) | 0.29 (0.35) | 0.25 (0.27) | 0.16 (0.24) |
| Avoidance behaviors | 5.58 (2.30) | 6.19 (2.59) | 5.76 (2.43) | 5.24 (2.01) | 5.60 (2.34) |
| Protective behaviors | 1.72 (0.63) | 1.75 (0.67) | 1.83 (0.69) | 1.71 (0.61) | 1.60 (0.55) |
| Street efficacy | 2.81 (0.66) | 2.98 (0.63) | 2.81 (0.66) | 2.79 (0.63) | 2.72 (0.73) |
| Collective efficacy | 2.68 (0.47) | 2.79 (0.43) | 2.54 (0.50) | 2.71 (0.43) | 2.72 (0.48) |
| Neighborhood integration | 2.29 (0.78) | 2.45 (0.76) | 2.04 (0.79) | 2.33 (0.79) | 2.40 (0.70) |
| Crime Prevention Through Environmental Design (CPTED) | 2.58 (0.36) | 2.52 (0.39) | 2.53 (0.35) | 2.62 (0.32) | 2.61 (0.39) |
Note: See Table 1 for value ranges for scale items.
Survey Measures of Walking for Recreation Inside and Outside One’s Neighborhood
Respondents were asked separately about their recreation-related walking inside and outside their neighborhood, with neighborhood defined as “10–15-min walk from home” (see Table 1). Although there is not a consensus definition of neighborhood, this definition was chosen mostly because recent reviews of PA studies indicated most studies used walking time to represent one’s neighborhood (see for instance, Barnett et al., 2017). This amount of walking time translates into roughly 0.5 to 0.75 miles (about 1km) from one’s home. Items were from The Neighborhood Physical Activity Questionnaire (NPAQ), which was based on the International Physical Activity Questionnaire. Questions assessed frequency and duration of each category of walking. Test-retest reliability was evaluated with adults ages 20 to 71 and found to be good to excellent (Giles-Corti et al., 2006).
Statistical Approach
Minutes/week of walking for recreation, both inside and outside one’s neighborhood of residence, were the outcomes of interest. The 10 perceived crime-related scales were the main independent variables. Covariates included age group (adolescent, young adults, middle-aged adult, senior adult), reported sex (male, female), race/ethnicity (white/non-Hispanic vs non-white or Hispanic), U.S. state of residence (CA, AZ, WA, MD), and income (high vs. low median household income of block group [census-based]). These covariates were drawn from the SAFE Study Conceptual Framework (Patch, et al. 2019) and represented the individual demographics and other generally static characteristics known to be correlates of PA behavior (Bauman et al. 2012). Summary statistics and box plots were examined to identify any potential issues including data outliers and skewness.
Modeling Approach
R statistical software for macOS (v. 3.6.1) was used for all modeling. A zero-inflated negative binomial model (ZINB) addressed the moderate prevalence of not walking among study participants. The R package pscl and procedures as illustrated in https://stats.oarc.ucla.edu/r/dae/zinb/ were used for the ZINB modeling. The binary part of this model – 0 if the participant reported 0 minutes of walking, 1 otherwise – used a logistic link function, while the continuous part – >0 minutes walked – used a negative binomial link function given overdispersion. A similar approach has been used successfully in previous papers examining self-reported PA with a large proportion of zero-PA values (e.g., Sugiyama et al., 2014). Separate models were fit for each crime scale being evaluated. All models included adjustments for the aforementioned covariates. Residual plots and goodness of fit statistics indicated if model assumptions were satisfied and guided choice of link.
Interaction (i.e., product) terms between each perceived crime construct and moderators allowed gauging moderating dynamics by age group (12–17; 18–39; 40–65; 66+) and sex. Likelihood ratio tests comparing models with and without the interaction gauged significance. This test evaluated moderation across all moderator subcategories for the binary and count components of the ZINB model via a single test statistic. Thus, it is possible for the overall moderating test to be non-null while specific binary or count model components within a moderator subcategory are null.
The same data were used for multiple tests. This raises concerns about possible inflated Type I errors. For the primary main effects analysis, the significance threshold was left at 5% for nonnull findings, but we complemented this with a minimum effect size, flagging nonnull findings as meaningful only if the change in odds of walking, or minutes walked, was greater than 15%. We believe this approach is justified since some of the perceived crime concerns/walking associations studied here are novel, and the study was deemed exploratory. A stricter approach, however, for each moderator (age group or sex) and each walking outcome – a Holm’s multiple comparison correction (Aickin & Genseler, 1996) – was used for the moderation analyses. The Holm’s method uses sequential thresholds and controls for Type 1 error when multiple hypotheses are tested and is considered more powerful than Bonferroni adjustment. A moderator*crime concern scale interaction was considered nonnull if the associated likelihood ratio test p-value passed a Holm’s significance threshold.
Participants were sampled from 1,506 census block groups. Roughly 90% of block groups, however, contained two or fewer participants, and including census block as a random effect (to account for clustering) led to convergence problems in the ZINB models. Hence, clustering due to census blocks was not incorporated into the models. To test for robustness of findings, separate binary (logistic) and continuous (loglinear) mixed models which included a random effect for census block were fit, with point estimates and statistical inference remaining unchanged. Therefore, ZINB results without accounting for clustering effects are reported.
Results
Table 3 shows descriptive statistics for the sample and describes walking for recreation outcomes. Overall, 58.5% of participants were female, ranging from 53.0% to 62.1% across age groups. Just under one-third of participants (30.9%) were people of color (defined as non-white or Hispanic), ranging from 24.6% among older adults to 41.2% among young adults. Numbers of participants varied across regions (18.0% in San Diego County to 31.5% in Maricopa County) and across age groups. Per the study design, roughly half of participants lived in lower- vs. higher-income neighborhoods, and half in lower-crime risk vs. higher-crime risk areas.
Table 3.
Demographics and recreation-walking outcomes by overall sample and age groups
| Variable | Overall | Adolescents (12–17 yrs) | Young Adults (18–39 yrs) | Middle-Age Adults (40–65 yrs) | Older Adults (66+ yrs) |
|---|---|---|---|---|---|
| Number of participants | 2,302 | 336 | 572 | 939 | 455 |
| Sex: % female | 58.5 | 57.1 | 57.9 | 62.1 | 53.0 |
| Race/ethnicity: % non-white or Hispanic | 30.9 | 34.8 | 41.2 | 26.3 | 24.6 |
| Region: % of participants | |||||
| Baltimore/Maryland (MD) | 22.8 | 8.3 | 18.2 | 21.1 | 42.9 |
| Seattle/King County (WA) | 27.7 | 43.5 | 19.8 | 19.6 | 42.9 |
| San Diego County (CA) | 18.0 | 48.2 | 21.9 | 6.7 | 14.3 |
| Phoenix/Maricopa County (AZ) | 31.5 | 0.0 | 40.2 | 52.6 | 0.0 |
| Block group median income: % Low | 49.7 | 38.7 | 55.8 | 47.0 | 55.6 |
| Block Group Crime Score: % Low | 51.7 | 55.4 | 53.5 | 49.8 | 50.5 |
| Household income (self-reported): % in category | |||||
| <$20K | 7.7 | 6.3 | 9.8 | 5.1 | 11.6 |
| $20K-$39K | 11.8 | 6.0 | 14.7 | 8.9 | 18.2 |
| $40K-$59K | 15.3 | 8.0 | 17.7 | 15.1 | 18.2 |
| $60K-$79K | 13.6 | 10.4 | 17.5 | 12.9 | 12.7 |
| $80K-$99K | 12.3 | 12.8 | 11.5 | 13.7 | 9.7 |
| $100K-$119K | 12.0 | 14.3 | 10.5 | 13.6 | 8.8 |
| >$120K | 24.0 | 35.7 | 16.1 | 29.1 | 14.9 |
| Missing | 3.3 | 6.5 | 2.3 | 1.5 | 5.7 |
| Recruitment rates (consented/eligible) | |||||
| Re-recruited participants | 78.6% | 59.7% | 69.8% | 86.8% | 86.7% |
| New participants | 24.5% | 15.9% | 35.3% | 50.8% | 15.1% |
| Physical Activity Outcomes | |||||
| Recreation-Walking Inside Neighborhood: | |||||
| Any walking per week (%) | 60.9 | 54.9 | 58.8 | 63.2 | 63.2 |
| Walkers: minutes/week (M, SD) | 165.1 (250.3) | 160.1 (259.9) | 161.4 (337.3) | 144.5 (182.1) | 214.7 (240.2) |
| Recreation-Walking Outside Neighborhood: | |||||
| Any walking per week (%) | 37.9 | 34.9 | 40.2 | 38.4 | 36.2 |
| Walkers: minutes/week [M (SD)] | 186.6 (305.7) | 281.2 (497.8) | 185.7 (294.2) | 143.4 (219.0) | 214.2 (288.1) |
A higher percentage of participants reported any recreation walking (i.e., > 0 days per week=“walkers”) inside their neighborhood (60.9%) compared to any recreation walking outside their neighborhood (37.9%). Among “walkers,” those walking outside their neighborhood reported more weekly minutes/week of recreational walking (mean=186.6 min/wk, SD=305.7) compared to those walking inside their neighborhoods (mean=165.1 min/wk, SD=250.3).
Main Effects Models – Walking for Recreation Inside One’s Neighborhood
Figure 2 shows a forest plot illustrating the results of the main effects models for inside neighborhood walking. Street efficacy, protective behaviors, collective efficacy, neighborhood integration, and CPTED exhibited non-null (95% CI excluded 1.0) associations with walking vs. not walking (panel “a” of Figure 2). Unit increases in collective efficacy, neighborhood integration, and CPTED were associated with 46% to 78% increases in expected odds of walking versus not walking (respective ORs = 1.46, 1.57, 1.78). Unit increases in street efficacy and protective behaviors each were associated with approximately 18% higher odds of inside neighborhood walking.
Figure 2.

Main effects models for walking inside one’s neighborhood: point estimates and 95% confidence intervals; binary component and continuous component
For reported minutes walked/week (panel “b”), incivilities, street efficacy, protective behaviors, avoidance behaviors, and CPTED each was associated with significantly (95% CI excluded 1.0) higher expected weekly walking minutes. A 1-unit increase in street efficacy and protective behaviors (e.g., carried a safety device, walked with someone/a dog) was associated with, respectively, 20% and 18% higher expected weekly minutes walked. A 1-unit increase in CPTED was associated with a 36% increase in expected minutes walked. Somewhat unexpectedly, incivilities (e.g., vandalism/graffiti, drug dealing, gang activity, public drunkenness) and avoidance behaviors (e.g., avoiding walking in certain places or at certain times, reflecting steps taken to walk less under certain conditions), were associated with higher expected minutes walked inside the home neighborhood (21% and 6% higher expected weekly minutes walked, respectively).
Main Effects Models -- Walking for Recreation Outside One’s Neighborhood
Figure 3 shows the main effects ZINB results for walking outside one’s neighborhood. Risk evaluation, incivilities, street efficacy, protective behaviors, avoidance behaviors, exposure to victimization, and neighborhood integration each was associated with significantly higher odds of walking versus not walking; ORs ranged from 1.06 for avoidance behaviors to 1.43 for protective behaviors. Higher scores on street efficacy, protective behaviors, avoidance behaviors, collective efficacy, neighborhood integration, and CPTED were associated significantly with higher expected weekly minutes walked (panel b). Values ranged from an expected higher minutes walked of 3% for avoidance behaviors to 51% for CPTED.
Figure 3.

Main effects models for walking outside one’s neighborhood: point estimates and 95% confidence intervals; binary component and continuous component
Moderator Analysis Results
Table 4 highlights findings from the moderator analyses that assessed interaction effects by (a) the four age groups (adolescents 12–17 years; young adults 18–39 years; middle-aged adults 40–65 years; older adults 66+ years of age) and (b) sex (male/female). Although moderator analyses examined both walking inside one’s neighborhood and walking outside one’s neighborhood, the table shown only includes scales that resulted in a significant likelihood ratio test after Holm’s adjustment for multiple tests. The likelihood ratio (lr) is an omnibus test, evaluating moderation across categories with a single statistic. There were interaction findings of note for the models for walking inside one’s neighborhood. For walking outside one’s neighborhood, following the Holm’s adjustment, because the interactions yielded null results between the crime-related concern measures and the age group or sex categories, no further details are shown.
Table 4.
Results of moderator analyses to assess crime-related concerns on walking inside one’s neighborhood by age group and sexa
| Crime Concerns* Sex Group | ||||||||||||
|---|---|---|---|---|---|---|---|---|---|---|---|---|
| Binary model component | Adolescent | Young | Middle | Senior | ||||||||
| OR | 95% CI | OR | 95% CI | OR | 95% CI | OR | 95% CI | |||||
| Fear | 1.284 | 0.859 | 1.919 | 0.881 | 0.532 | 1.458 | 0.781 | 0.479 | 1.271 | 0.792 | 0.462 | 1.359 |
| Victimization | 1.391 | 0.661 | 2.933 | 0.914 | 0.376 | 2.222 | 0.851 | 0.345 | 2.101 | 2.128 | 0.657 | 6.897 |
| Neighborhood integration | 1.538 | 1.143 | 2.075 | 1.209 | 0.833 | 1.754 | 1.458 | 1.029 | 2.066 | 1.828 | 1.206 | 2.77 |
| Continuous component | ||||||||||||
| Exp(b) | 95% CI | Exp(b) | 95% CI | Exp(b) | 95% CI | Exp(b) | 95% CI | |||||
| Fear | 1.675 | 1.271 | 2.209 | 0.899 | 0.648 | 1.248 | 1.011 | 0.729 | 1.403 | 1.105 | 0.771 | 1.585 |
| Victimization | 0.569 | 0.366 | 0.884 | 1.467 | 0.883 | 2.437 | 0.85 | 0.5 | 1.447 | 1.078 | 0.609 | 1.907 |
| Neighborhood integration | 1.784 | 1.296 | 2.456 | 0.844 | 0.676 | 1.053 | 1.127 | 0.921 | 1.38 | 0.973 | 0.771 | 1.229 |
| Crime Concerns* Sex | ||||||
|---|---|---|---|---|---|---|
| Binary model component | Male | Female | ||||
| OR | 95% CI | OR | 95% CI | |||
| Incivilities | 1.087 | 0.771 | 1.531 | 0.772 | 0.499 | 1.195 |
| Protective behaviors | 1.221 | 0.945 | 1.58 | 1.164 | 0.856 | 1.585 |
| Avoidance behaviors | 0.994 | 0.923 | 1.071 | 0.974 | 0.893 | 1.062 |
| Victimization | 1.348 | 0.867 | 2.096 | 0.872 | 0.482 | 1.577 |
| Collective efficacy | 1.567 | 1.156 | 2.123 | 1.572 | 1.071 | 2.309 |
| Continuous component | ||||||
| Exp(b) | 95% CI | Exp(b) | 95% CI | |||
| Incivilities | 1.718 | 1.374 | 2.148 | 0.971 | 0.743 | 1.271 |
| Protective behaviors | 1.467 | 1.264 | 1.702 | 1.054 | 0.884 | 1.258 |
| Avoidance behaviors | 1.12 | 1.072 | 1.169 | 1.02 | 0.968 | 1.076 |
| Victimization | 1.324 | 1.07 | 1.64 | 0.816 | 0.599 | 1.113 |
| Collective efficacy | 0.835 | 0.695 | 1.004 | 1.195 | 0.956 | 1.494 |
Note: Table includes only crime scales that had significant likelihood ratio test for moderation after multiple testing (Holm’s) adjustment.
Fear, exposure to victimization, and neighborhood integration each showed significant interactions with age. Incivilities, protective behaviors, avoidance behaviors, exposure to victimization, and collective efficacy each showed significant interactions with sex.
Interactions by Age Group
The directions of associations for the fear and exposure to victimization scales varied by age. For the binary component of the models (i.e., not walking vs. walking inside one’s neighborhood), none of the subgroup age effects were significant. For expected minutes walked, among adolescents, unit increases on fear were significantly associated with a 68% higher expected count of neighborhood walking minutes; unit increases on exposure to victimization were associated with expected 43% lower minutes walked. For other age groups, there were no significant subgroup effects; the coefficients for middle and senior age groups were close to null.
For walking versus not walking inside one’s neighborhood, neighborhood integration interactions amplified positive associations discussed for the main effects, with unit increases associated with 54% higher odds for adolescents and 83% higher odds for senior adults. For weekly minutes walked, among adolescents, higher neighborhood integration scores were associated with 78% higher expected counts of weekly minutes walked. Directions of association were not consistent, and no associations were significant for the other age groups.
Interactions by Sex
For walking versus no inside-neighborhood walking, incivilities and exposure to victimization exhibited opposite directions of association (OR > 1 males, < 1 females); however, no significant subgroup effects surfaced. For minutes walked/week, higher scores were significantly associated with a higher expected minutes in males (72% and 32% for incivilities and exposure to victimization, respectively); the effects were in the opposite direction, but non-significant, for females.
For each sex subgroup, avoidance behaviors had a null association with the binary indicator of walking. For minutes walked per week, unit increases in avoidance were associated with 12% higher expected counts of minutes inside-neighborhood walking for males; the corresponding result was null in females. Similar to the main effects, protective behaviors revealed positive associations with odds of walking versus not walking inside one’s neighborhood for both males and females, although the subgroup-level associations were not statistically significant. For weekly minutes walked, higher scores on protective behaviors were associated with an expected 47% higher count for males; the corresponding association was null for females. Collective efficacy showed similar significant positive associations with odds of walking versus not walking for the main effects and by sex group. For weekly minutes walked, neither the main effects nor subgroup effects were significant.
Discussion
The current study assessed associations of crime-related perceptions developed from a broad conceptual framework with walking for recreation inside and outside one’s neighborhood (Patch et al., 2019). Present results, which show differences in correlates for walking inside versus outside one’s neighborhood, may help explain prior inconsistent evidence about crime in relation to PA (Bracy et al., 2014; Da Silva et al., 2016; Ding et al., 2011; Foster & Giles-Corti, 2008). Fear of crime (emotional response) and risk of victimization (judgement/cognitive response) were similar to measures of crime concerns that have been examined in prior studies (Bracy et al., 2014; Da Silva et al., 2016; Ding et al., 2011; Foster & Giles-Corti, 2008). However, in the present study, these measures were not related to any of the recreational walking outcomes, inside or outside one’s neighborhood, though we expected recreational walking to be the category of PA most likely to be affected by these concerns. In contrast, we found other crime-related perceptions that have been seldom, if ever, studied in relation to PA to be strongly associated with recreational walking. Thus, the present application of the SAFE conceptual framework has provided important new findings.
An initial expectation was that neighborhood crime concerns would be related to less walking inside one’s neighborhood and more walking outside one’s neighborhood, with protective factors showing the opposite pattern. For walking inside one’s neighborhood, findings from the main effects models supported several hypothesized positive associations: for street efficacy, protective behaviors, collective efficacy, neighborhood integration, and CPTED. These protective variables were related to higher odds of any recreational walking versus no reported walking for recreation inside one’s neighborhood. All of these perceived variables, except collective efficacy and neighborhood integration, were associated with more inside-neighborhood minutes walked as well.
This bundle of findings for neighborhood recreational walking builds on previous work. Previous studies (across various types of walking outcomes) presented mixed evidence concerning the relation of local social dynamics and PA. Several studies observed associations between neighboring, cohesion, and collective efficacy-related variables with PA (Brennan, et al., 2003; Mohnen et al., 2012; Yip et al., 2016). At least a few studies, however, found no relation between collective efficacy/cohesion and recreational PA (Rachele et al., 2016; Troped, Brenner & Wilson, 2023). Across studies, varying operational definitions of myriad constructs related to the social environment hinder a clear understanding of the social mechanisms at play that may influence PA (McNeill, et al., 2006). For instance, some studies used a standard nine- or ten-item measure of collective efficacy (Roman & Chalfin, 2008; Troped et al., 2023), which includes constructs related to cohesion and informal social control (Sampson et al., 1997), while others used only a subset of items (Mason, Kearns & Livingston, 2013; Towne et al., 2016) or did not include collective efficacy at all alongside other conceptually distinct social environmental perceptions, such as neighborhood integration (Yip et al., 2016).
The counterintuitive findings for the main effects models of walking inside one’s neighborhood are worth noting. First, three core risk-related constructs—fear of crime, evaluations that the risk of victimization was high, and victimization exposure itself— were neither associated with odds of walking at all nor with inside-neighborhood minutes walked among walkers. The bivariate null associations seen here could be a byproduct of complicated connections between local social climate and personal safety concerns found in earlier works (Abdullah et al., 2015; Lane et al., 2014; O’Bryant & Donnermeyer, 1991). Second, perceived incivilities were positively associated with expected weekly minutes of inside-neighborhood walking. Although unexpected, this link does align with results from a United Kingdom study of adults from deprived neighborhoods (Mason et al., 2013). Perhaps people who walk more in their neighborhoods become more aware of incivilities (i.e., reverse causation).
Turning to a finding with scant prior empirical work, among walkers, avoidance behaviors were positively associated with expected minutes of weekly walking for recreation both inside and outside their neighborhoods. Perhaps those who walk inside their neighborhood walked more in part because of safety concerns (for example, walkers could take a longer route to avoid a crime “hot spot),” and they may be walking more outside their neighborhood in areas they perceive to be safer. Previous PA work that considers defensive behaviors (Carver et al., 2010) found a positive relation between parental defensive behaviors and PA outcomes for their children (10–11 years) and teenagers (15–17 years). The current finding merits closer examination in future longitudinal studies given earlier work indicating avoidance may amplify fear over time, and vice versa (Liska et al., 1988), and protective behaviors may elevate later fear of crime (Norris & Kaniasty, 1992).
With regard to the physical environment-related constructs, perceiving that one’s neighborhood features align with CPTED principles (surveillance, maintenance, access control, territorial reinforcement) was positively associated both with the likelihood of any neighborhood walking and to expected minutes of neighborhood walking. Present findings support Ding and colleagues’ (2011) literature review on socio-environmental correlates of youth PA which concluded that neighborhood attributes such as walkability, access to recreation facilities/open space, and presence of street trees were associated with higher domain-specifıc PA. Assuming respondents’ CPTED perceptions here align with on-site features, the present finding expands the range of PA-relevant neighborhood physical environment features. Although many studies assessed the physical environment when examining PA behaviors, a key focus in SAFE was the application of criminological theory and evidence to develop a self-report measure of CPTED— physical features of high relevance to crime in the theoretical and empirical literature (Casteel & Peek-Asa, 2000; Jeffery, 1990). Given CPTED’s inherent focus on interdisciplinary methods of crime reduction across the built environment, the implications are many. Using CPTED ideals, there are many avenues to reduce crime within the control of the potential victim and community members, such as improving lighting or trimming trees for better visibility, where preventive measures do not have to wait for typically under-resourced and often-delayed government intervention.
For the main effects related to walking outside one’s neighborhood, street efficacy, protective behaviors, avoidance behaviors, and neighborhood integration were significantly and positively associated both with walking versus not walking, and with expected weekly minutes walked. Three of these variables are active coping strategies or goal-directed efforts accessible with one’s own resources (protective and avoidance behaviors and street efficacy). These adaptations have broad spatial implications for promoting PA. For instance, implementing programs that educate residents on protective behaviors (e.g., walking with dogs or other people, self-defense classes or use of safety apps) could empower residents, potentially increasing street efficacy and encouraging walking across a wide range of locations.
Considering walking in both locations, the strong and consistent associations between walking and street efficacy merit mention. Crime-PA studies have not previously addressed this construct of how confident a person is they can avoid crime in their neighborhood. Its hypothesized relevance to PA derives from connections between personal safety concerns of adolescents and fear of crime and victimization (Sharkey 2006; Yuan et al., 2016), and input from focus groups and semi-structured interviews conducted in high-crime neighborhoods during the SAFE measurement development process (Patch et al., 2019). Although earlier studies only considered street efficacy’s connections to adolescents’ fear and victimization, current results underscore its potential relevance to PA across age groups.
Moderator analyses revealed only a few noteworthy results. The constructs of fear and exposure to victimization scales varied by age category. Our finding of a positive association between fear and walking inside one’s neighborhood for adolescents (but a negative association between victimization and walking) could be because adolescents may be more likely (than older individuals) to engage in activities that involve a certain level of perceived risk or fear (Zuckerman 2007), or, because adolescents tend to play in groups (i.e., with peers), where peer influence helps mitigate fear, regardless of experiences with victimization (Laursen & Veenstra, 2021), and perhaps through buoying street efficacy (Yuan et al., 2016).
With regard to moderation by sex, in six analyses, significant positive associations were found for males, with null findings for females, including two variables with negative but nonsignificant results for females (incivilities and exposure to victimization). Nonetheless, the main conclusion is that associations between crime-related perceptions and walking for recreation were largely consistent across age and sex groups.
Limitations
Several limitations deserve discussion. First, a main limitation is our reliance on self-report data for all variables, which can produce same-source bias and lead to results that overestimate associations and increase risk of reverse causation. To minimize potential biases, we carefully designed and employed measures that either have been previously tested for reliability and validity and/or through comprehensive psychometric evaluation conducted and published by the current study’s authors (Patch et al., 2019; Roesch et al., 2021). With regard to the validity of self-report for youth, there is a body of studies that indicate psychometric results for youth 11 or 12 years and above are similar to those for adults (see for instance, Norman, Sallis & Gaskins, 2005; Sallis & Saelens, 2000). Good psychometric performance was confirmed for virtually all scales among the SAFE adolescent sample (Patch et al., 2019).
The walking outcomes have extensive prior support for their reliability and validity. While reports of walking are not expected to be accurate in an absolute sense, many reported walking measures have evidence of test-retest reliability and construct validity (Giles-Corti et al., 2006) and we utilized methods that capture both walking versus not walking, and minutes walked—with the former measure not as subject to recall limitations. Further, we set out to improve upon simplistic measures often used in prior studies. We brought together a large multidisciplinary team of scholars to develop and test sound constructs, such as distinguishing fear/worry about crime (the emotional component) from evaluations of risk, and to administer the survey with well-designed procedures that repeatedly ensured confidentiality and provided clear directions (Patch et al., 2019). Relatedly, the present analyses did not incorporate administrative data on crime, an important component of crime concerns. Future studies using SAFE data will incorporate police department incident data as well as accelerometer-based PA measures.
Second, small sample sizes within age by sex subgroups precluded exploring three-way interactions by age, sex, and predictors. Third, results relied on cross-sectional data and are not meant to indicate causality. We recognize the limitation that the associations observed might be influenced by reverse causation, where changes in or differing levels of PA might affect perceptions of crime. Future longitudinal studies are recommended. Fourth, the conceptual framework includes some constructs, such as collective efficacy, that, theoretically, capture meso- or macro-level dynamics. However, the recruitment plan resulted in a sample too loosely clustered to generate neighborhood-level indicators. Thus, indicators like collective efficacy and neighborhood integration were operationalized using micro-/individual-level perceptions rather than shared meso-level perceptions. Although there is a substantial body of research on individual-level reported collective efficacy, or its components, as an outcome (e.g., Duncan et al, 2003; Garcia et al., 2005) and a predictor (e.g., Gibson et al., 2002), hopefully future studies will examine PA connections with social dynamics operationalized at the meso-level, as envisioned by the conceptual framework. Fifth, present analyses did not examine whether combinations of crime-related perceptions, or an overall index, provided better explanations of walking outcomes. Sixth, while the four large recruitment regions were selected to reflect qualitatively different geographic areas, the regions and participants were not intended to be representative of the entire U.S. Last, the study did not include a variable that captured whether the respondent moved to their current neighborhood because of crime concerns—a measure that could be used to reduce potential confounding/endogeneity issues. We do not have measures to do this but believe that survey questions about reasons for moving to the current address would not easily apply across all the age groups surveyed, and hence could add more confusion than clarity. For example, adolescents are not major decision-makers about family moves, and many older adults were likely in their homes for many decades. Furthermore, Cerin and colleagues (2017), in their review of environmental correlates of walking behavior, found all four studies that were able to include controls for self-selection showed evidence of positive environmental associations indicating the effects were unlikely to be entirely due to residential self-selection.
These limitations should be seen in the context of study strengths. First, the current work examined how PA was associated with theoretically-relevant constructs using indicators with strong psychometric qualities. Second, the sample was diverse on age, socioeconomic status, regional geography, and neighborhood crime risk. Third, potential effect modifications by age and sex subgroups were evaluated. Fourth, ZINB analyses conceptually separated the walking versus not walking decision from the minutes walked by walkers, as has been done in other PA studies (Sugiyama et al., 2014). To our knowledge, with the exception of a recently-published paper by Reid and colleagues (2024), we could find no studies that have empirically linked these two distinct components of walking with crime-related perceptions. Fifth, to our knowledge, no previous studies examining crime-related perceptions have separated these two components of walking dynamics and simultaneously separated inside-versus outside-neighborhood walking. Finally, many of the effect sizes observed in the current study are substantial.
Conclusion
Guided by a comprehensive conceptual framework informed by criminology literature and deploying high-quality measures, the current work addressed many conceptual and measurement limitations of prior studies while examining how crime-related perceptions correlate with walking for recreation. Results revealed robust main effect associations between walking for recreation and positive neighborhood factors. The strongest and most consistent correlates were collective efficacy, street efficacy, neighborhood integration, CPTED, and protective actions. Cognitive and emotional crime risk indicators such as fear of crime, risk evaluation, and incivilities were neither strongly nor consistently associated with walking for recreation inside home neighborhoods. Notably, these negative crime concerns are similar to constructs most commonly studied in prior literature (Bracy et al., 2014; Da Silva et al., 2016; Ding et al., 2011; Foster & Giles-Corti, 2008). Crime concerns about participants’ own neighborhoods, however, were related to walking for recreation outside their neighborhoods, perhaps indicating a health-promoting response resulting from displacement of walking to a safer location. Generally, findings applied across age and sex groups, supporting generalizability. An important implication is that interventions that support neighborhood integration and build collective efficacy, as well as those that teach protective and avoidance behaviors may be effective in increasing PA across subgroups. Organized volunteering efforts and local workshops and trainings on local and civic engagement may go a long way to foster community and connectedness within neighborhoods (Collins et al., 2014). Interventions that support civic engagement and advocacy may support PA by building social connections and achieving improvements in the built environment that support safety from crime and walkability. Further moderator analyses across socioeconomic status and race/ethnicity subgroups are needed, and we are planning such analyses. We look forward to continued research using these scales with the conceptual framework serving as a backdrop for studies that consider potential pathways linking these crime-related constructs with additional indicators of PA as well as other outcomes.
Supplementary Material
Highlights:
Prior studies on the relation of crime and fear to physical activity provided weak support.
Crime concerns were not related to reduced recreational walking inside the neighborhood.
Crime concerns were related to more recreational walking outside the neighborhood.
There are important differences in the relation of crime concerns to recreational walking, depending on whether one is walking inside versus outside their neighborhood.
Overall, protective variables (e.g., carried an emergency device, walked with someone or a dog, etc.) were the most consistent correlates of recreational walking.
Funding
This study was funded by NHLBI grant #5R01HL117884
Footnotes
Publisher's Disclaimer: This is a PDF file of an unedited manuscript that has been accepted for publication. As a service to our customers we are providing this early version of the manuscript. The manuscript will undergo copyediting, typesetting, and review of the resulting proof before it is published in its final form. Please note that during the production process errors may be discovered which could affect the content, and all legal disclaimers that apply to the journal pertain.
Contributor Information
Caterina G. Roman, Department of Criminal Justice, Temple University (Philadelphia, PA, USA).
Ruohui Chen, Feinberg School of Medicine, Department of Preventive Medicine – Biostatistics, Northwestern University (Evanston, Illinois, USA).
Loki Natarajan, Herbert Wertheim School of Public Health & Human Longevity Science, University of California, San Diego (USA).
Terry L. Conway, Herbert Wertheim School of Public Health and Human Longevity Science, University of California San Diego (USA).
Christina Patch, Central Valley Community Foundation (Fresno, CA, USA).
Ralph B. Taylor, Department of Criminal Justice, Temple University (Philadelphia, PA, USA).
Kelli L. Cain, Herbert Wertheim School of Public Health and Human Longevity Science, University of California, San Diego (USA).
Scott Roesch, Department of Psychology, San Diego State University (San Diego, USA).
Marc A. Adams, College of Health Solutions, Arizona State University (Phoenix, Arizona, USA).
Brian E. Saelens, Departments of Pediatrics and Psychiatry and Behavioral Sciences, University of Washington (Washington, USA).
Abby C. King, Stanford Prevention Research Center, Stanford University (California, USA).
Lawrence D. Frank, Department of Urban Studies and Planning, University of California San Diego (California, USA).
Karen Glanz, Department of Biostatistics and Epidemiology, University of Pennsylvania (USA).
James F. Sallis, Distinguished Professor Emeritus, Herbert Wertheim School of Public Health and Human Longevity Science, University of California San Diego, (USA) and Professorial Fellow, Mary MacKillop Institute for Health Research, Australian Catholic University, Melbourne (Australia).
References
- Abdullah A, Hedayati Marzbali M, et al. (2015). Territorial features, disorder and fear of crime in residential neighbourhoods in Malaysia: Testing for multigroup invariance. Global Crime, 16(3), 197–218. [Google Scholar]
- Adams MA, Hurley JC, Phillips CB, ….F., & Hooke S (2019). Rationale, design, and baseline characteristics of WalkIT Arizona: A factorial randomized trial testing adaptive goals and financial reinforcement to increase walking across higher and lower walkable neighborhoods. Contemporary Clinical Trials, 81, 87–101. [DOI] [PMC free article] [PubMed] [Google Scholar]
- Aickin M, & Gensler H (1996). Adjusting for multiple testing when reporting research results: The Bonferroni vs Holm methods. American Journal of Public Health, 86(5), 726–728. [DOI] [PMC free article] [PubMed] [Google Scholar]
- Applied Geographic Solutions. Database methodology guide, 2010B update. Newbury Park, CA; 2010. [Google Scholar]
- Bauman AE, Reis RS, Sallis JF … Lancet Physical Activity Series Working Group (2012). Correlates of physical activity: why are some people physically active and others not? Lancet (London, England), 380(9838), 258–271. [DOI] [PubMed] [Google Scholar]
- Barnett DW, Barnett A, Nathan A, Van Cauwenberg J, & Cerin E (2017). Built environmental correlates of older adults’ total physical activity and walking: A systematic review and meta-analysis. International Journal of Behavioral Nutrition & Physical Activity 14, 103. [DOI] [PMC free article] [PubMed] [Google Scholar]
- Bennett GG, McNeill LH, Wolin, … Emmons KM (2007). Safe to walk? Neighborhood safety and physical activity among public housing residents. PLoS Medicine, 4(10), e306. [DOI] [PMC free article] [PubMed] [Google Scholar]
- Bracy NL, Millstein RA, Carlson JA, et al. (2014). Is the relationship between the built environment and physical activity moderated by perceptions of crime and safety? International Journal of Behavioral Nutrition and Physical Activity, 11, 24. [DOI] [PMC free article] [PubMed] [Google Scholar]
- Brantingham PJ, & Faust FL (1976). A conceptual model of crime prevention. Crime & Delinquency, 22(3), 284–296. [Google Scholar]
- Brennan LK, Baker EA, Haire-Joshu D, & Brownson RC Linking perceptions of the community to behavior: Are protective social factors associated with physical activity? (2003). Health Education & Behavior, 30(6), 740–755. [DOI] [PubMed] [Google Scholar]
- Carver A, Timperio A, & Crawford D (2008). Playing it safe: the influence of neighbourhood safety on children’s physical activity. A review. Health & place, 14(2), 217–227. [DOI] [PubMed] [Google Scholar]
- Carver A, Timperio A, Hesketh K, & Crawford D (2010). Are children and adolescents less active if parents restrict their physical activity and active transport due to perceived risk? Social Science & Medicine, 70(11), 1799. doi: 10.1016/j.socscimed.2010.02.010 [DOI] [PubMed] [Google Scholar]
- Casteel C & Peek-Asa C (2000). Effectiveness of crime prevention through environmental design (CPTED) in reducing robberies. American Journal of Preventive Medicine 18(4S), 99–115. [DOI] [PubMed] [Google Scholar]
- Cerin E, Nathan A, Van Cauwenberg J, Barnett DW, Barnett A, & Council on Environment and Physical Activity (CEPA)–Older Adults working group. (2017). The neighbourhood physical environment and active travel in older adults: a systematic review and meta-analysis. International Journal of Behavioral Nutrition and Physical Activity, 14, 1–23. [DOI] [PMC free article] [PubMed] [Google Scholar]
- Chadee D, Austen L, & Ditton J (2007). The relationship between likelihood and fear of criminal victimization. British Journal of Criminology, 4(4), 359–376. [Google Scholar]
- Chen TJ, Watson KB, Michael SL, & Carlson SA (2021). Sex-stratified trends in meeting physical activity guidelines, participating in sports, and attending physical education among US adolescents, Youth Risk Behavior Survey 2009–2019. Journal of Physical Activity and Health, 18(S1), S102–S113. [DOI] [PMC free article] [PubMed] [Google Scholar]
- Coleman JS (1990). Foundations of social theory. Cambridge, MA: Harvard University Press. [Google Scholar]
- Collins CR, Neal JW & Neal ZP (2014). Transforming individual civic engagement into community collective efficacy: The role of bonding social capital. American Journal of Community Psychology, 54, 328–336. [DOI] [PubMed] [Google Scholar]
- Covington J, & Taylor RB (1991). Fear of crime in urban residential neighborhoods: Implications of between and within-neighborhood sources for current models. The Sociological Quarterly, 32(2), 231–249. [Google Scholar]
- Da Silva IC, Payne VL, Hino AA, … Hallal PC (2016). Physical activity and safety from crime among adults: a systematic review. Journal of Physical Activity and Health, 13(6), 663–670. [DOI] [PubMed] [Google Scholar]
- Ding D, Sallis JF, Kerr J, Lee S, & Rosenberg D (2011). Neighborhood environment and physical activity among youth: a review. American Journal of Preventive Medicine, 41(4), 442–455. [DOI] [PubMed] [Google Scholar]
- DuBow F, McCabe E, & Kaplan G (1979). Reactions to crime: A critical review of the literature. Washington, DC: U.S. Government Printing Office. [Google Scholar]
- Duncan TE, Duncan SD, … Hix-Small H (2003). A Multilevel contextual model of neighborhood collective efficacy. American Journal of Community Psychology, 32(3/4), 245–252. [DOI] [PubMed] [Google Scholar]
- Elgaddal N, Kramarow EA, & Reuben C (2022). Physical activity among adults aged 18 and over: United States, 2020. NCHS Data Brief, 443. [PubMed] [Google Scholar]
- Fleiss JL The design and analysis of clinical experiments. New York: John Wiley & Sons; 1986. [Google Scholar]
- Foster S, & Giles-Corti B (2008). The built environment, neighborhood crime and constrained physical activity: an exploration of inconsistent findings. Preventive Medicine, 47(3), 241–251. [DOI] [PubMed] [Google Scholar]
- Foster S, Giles-Corti B, & Knuiman M (2014a). Does fear of crime discourage walkers? A social-ecological exploration of fear as a deterrent to walking. Environment and Behavior, 46, 698–717. [Google Scholar]
- Foster S, Hooper P, Burton NW, Brown WJ, Giles-Corti B, Rachele JN, & Turrell G (2021). Safe Habitats: Does the association between neighborhood crime and walking differ by neighborhood disadvantage? Environment and Behavior, 53(1), 3–39. [Google Scholar]
- Foster S, Knuiman M, Hooper P, Christian H & Giles-Corti B (2014b). Do changes in residents’ fear of crime impact their walking? Longitudinal results from RESIDE, Preventive Medicine, 62, 161–166. [DOI] [PubMed] [Google Scholar]
- Foster S, Knuiman M, Wood L, & Giles-Corti B (2013). Suburban neighbourhood design: Associations with fear of crime versus perceived crime risk. Journal of Environmental Psychology, 36, 112–117. [Google Scholar]
- Garcia RM, Taylor RB, & Lawton BA (2007). Impacts of violent crime and neighborhood structure on trusting your neighbors. Justice Quarterly, 24(4), 679–704. doi: 10.1080/07418820701717169 [DOI] [Google Scholar]
- Ghani F, Rachele JN, Washington S & Turrell G (2016). Gender and age differences in walking for transport and recreation: Are the relationships the same in all neighborhoods? Preventive Medicine Reports, 4, 75–80. [DOI] [PMC free article] [PubMed] [Google Scholar]
- Gibson CL, Zhao J, Lovrich NP, & Gaffney MJ (2002). Social integration, individual perceptions of collective efficacy, and fear of crime in three cities. Justice Quarterly, 19, 537–564. [Google Scholar]
- Giles-Corti B, Timperio A, Cutt H, … Shilton T (2006). Development of a reliable measure of walking within and outside the local neighborhood: RESIDE’s Neighborhood Physical Activity Questionnaire. Preventive Medicine, 42(6), 455–459. [DOI] [PubMed] [Google Scholar]
- Guthold R, Stevens GA, Riley LM, & Bull FC (2018). Worldwide trends in insufficient physical activity from 2001 to 2016: a pooled analysis of 358 population-based surveys with 1· 9 million participants. The Lancet Global Health, 6(10), e1077–e1086. [DOI] [PubMed] [Google Scholar]
- Hurvitz PM, Moudon AV, Kang B, Fesinmeyer MD, & Saelens BE (2014). How far from home? The locations of physical activity in an urban U.S. setting. Preventive Medicine, 69, 181–186. [DOI] [PMC free article] [PubMed] [Google Scholar]
- Jackson J (2008). Bridging the social and the psychological in the fear of crime. In Lee Murray and Farrall Stephen, (eds.) Fear of crime: critical voices in an age of anxiety. GlassHouse Press, Abingdon, UK, pp. 143–167. [Google Scholar]
- Jackson J (2011). Revisiting risk sensitivity in the fear of crime. Journal of Research in Crime and Delinquency, 48(4), 513–537. [Google Scholar]
- Jacobs J (1961). The Death and Life of Great American Cities. Random House. [Google Scholar]
- Janssen I (2014). Crime and perceptions of safety in the home neighborhood are independently associated with physical activity among 11–15 year-olds. Preventive Medicine, 66, 113–117. [DOI] [PubMed] [Google Scholar]
- Jeffery CR (1990). Criminology: An interdisciplinary approach. Englewood Cliffs, NJ: Prentice-Hall. [Google Scholar]
- King AC, Sallis JF, Frank LD, … Kerr J (2011). Aging in neighborhoods differing in walkability and income: associations with physical activity and obesity in older adults. Social Science & Medicine, 2011 Nov;73(10):1525–33. [DOI] [PMC free article] [PubMed] [Google Scholar]
- Kruger J, Ham SA, Berrigan D, & Ballard-Barbash R (2008). Prevalence of transportation and leisure walking among U.S. adults. Preventive Medicine, 47(3), 329–334. [DOI] [PubMed] [Google Scholar]
- LaGrange RL, Ferraro KF, & Supancic M (1992). Perceived risk and fear of crime: Role of social and physical incivilities. Journal of Research in Crime and Delinquency, 29(3), 311–334. [Google Scholar]
- Lane J, Rader NE, Henson B, Fisher BS, May DC (2014). Fear of crime in the United States: Causes, consequences, and contradictions. Carolina Academic Press: Durham, NC. [Google Scholar]
- Laursen B, & Veenstra R (2021). Toward understanding the functions of peer influence: A summary and synthesis of recent empirical research. Journal of Research on Adolescence: the official journal of the Society for Research on Adolescence, 31(4), 889–907. [DOI] [PMC free article] [PubMed] [Google Scholar]
- Lavrakas PJ, & Herz EJ (1982). Citizen participation in neighborhood crime-prevention. Criminology, 20(3–4), 479–498. [Google Scholar]
- Lavrakas PJ, and Lewis DA (1980). The Conceptualization and Measurement of Citizens’ Crime Prevention Behaviors. Journal of Research in Crime and Delinquency, 17(2), 254–272. [Google Scholar]
- Lexell JE, & Downham DY (2005). How to assess the reliability of measurements in rehabilitation. American Journal of Physical Medicine & Rehabilitation, 84(9), 719–723. [DOI] [PubMed] [Google Scholar]
- Li F, Fisher KJ, Bauman A, Ory MG, et al. (2005). Neighborhood influences on physical activity in middle-aged and older adults: A multilevel perspective. Journal of Aging and Physical Activity, 13(1), 87–114. [DOI] [PubMed] [Google Scholar]
- Liska A, & Baccaglini W (1990). Feeling safe by comparison: Crime in the newspapers. Social Problems, 37(3), 360–374. [Google Scholar]
- Liska AE, Sanchirico A, & Reed MD (1988). Fear of crime and constrained behavior specifying and estimating a reciprocal effects model. Social Forces, 66, 827–837. [Google Scholar]
- Lorenc T, Clayton S, Neary D, et al. (2012). Crime, fear of crime, environment, and mental health and wellbeing: mapping review of theories and causal pathways. Health & Place, 18(4), 757–765. [DOI] [PubMed] [Google Scholar]
- Lynch K (1960). The Image of the City. MIT Press. [Google Scholar]
- Mason P, Kearns A, & Livingston M (2013). “Safe Going”: The influence of crime rates and perceived crime and safety on walking in deprived neighbourhoods. Social Science & Medicine, 91, 15–24. [DOI] [PubMed] [Google Scholar]
- May DC, Rader NE, & Goodrum S (2010). A gendered assessment of the ‘‘threat of victimization’’: Examining gender differences in fear of crime, perceived risk, avoidance, and defensive behaviors. Criminal Justice Review, 35, 159–182. [Google Scholar]
- McNeill LH, Kreuter MW, & Subramanian SV (2006). Social environment and physical activity: a review of concepts and evidence. Social science & medicine (1982), 63(4), 1011–1022. [DOI] [PubMed] [Google Scholar]
- Mohnen SM, Völker B, Flap H et al. (2012). Health-related behavior as a mechanism behind the relationship between neighborhood social capital and individual health - a multilevel analysis. BMC Public Health, 12, 116. [DOI] [PMC free article] [PubMed] [Google Scholar]
- Murtagh EM, Murphy MH, & Boone-Heinonen J (2010). Walking: The first steps in cardiovascular disease prevention. Current Opinion in Cardiology, 25, 490–496. [DOI] [PMC free article] [PubMed] [Google Scholar]
- Norman GJ, Sallis JF, & Gaskins R (2005). Comparability and reliability of paper-and computer-based measures of psychosocial constructs for adolescent physical activity and sedentary behaviors. Research Quarterly for Exercise and Sport, 76, 315–323. [DOI] [PubMed] [Google Scholar]
- Norris FH, & Kaniasty K (1992). A longitudinal study of the effects of various crime prevention strategies on criminal victimization, fear of crime, and psychological distress. American Journal of Community Psychology, 20, 625–648. [DOI] [PubMed] [Google Scholar]
- O’Bryant SL, & Donnermeyer JF (1991). Fear of crime and perceived risk among older widowed women. Journal of Community Psychology, 19(2), 166–177. [Google Scholar]
- Outdoor Foundation. (2022). 2022 Outdoor Participation Trends Report. Available: https://outdoorindustry.org/wp-content/uploads/2023/03/2022-Outdoor-Participation-Trends-Report.pdf (downloaded 6/1/2024). [Google Scholar]
- Patch CM, Roman CG, Conway TL, et al. (2019). Crime and physical activity: Development of a conceptual framework and measures. Journal of Physical Activity and Health, 16(10), 818–829. [DOI] [PubMed] [Google Scholar]
- Piercy KL, Troiano RP, Ballard RM, et al. (2018). The physical activity guidelines for Americans. JAMA, 320, 2020–2028. [DOI] [PMC free article] [PubMed] [Google Scholar]
- Rachele JN, Ghani F, Loh VH, Brown WJ, & Turrell G (2016). Associations between physical activity and the neighbourhood social environment: baseline results from the HABITAT multilevel study. Preventive Medicine, 93, 219–225. 10.1016/j.ypmed.2016.06.034 [DOI] [PubMed] [Google Scholar]
- Rader NE, May DC, & Goodrum S (2007). An empirical assessment of the “threat of victimization:” Considering fear of crime, perceived risk, avoidance, and defensive behaviors. Sociological Spectrum: Mid-South Sociological Association, 27(5):475–505. [Google Scholar]
- Rees-Punia E, Hathaway ED, & Gay JL (2018). Crime, perceived safety, and physical activity: A meta-analysis. Preventive Medicine, 111, 307–313. [DOI] [PubMed] [Google Scholar]
- Reid RA, Foster S, Mavoa S, & Rachele JN (2024). Associations between changes in crime and changes in walking for transport with effect measure modification by gender: A fixed-effects analysis of the multilevel longitudinal HABITAT study (2007–2016). Health & Place, 85, 103163. [DOI] [PubMed] [Google Scholar]
- Richardson AS, Troxel WM, Ghosh-Dastidar MB, et al. (2017). One size doesn’t fit all: cross-sectional associations between neighborhood walkability, crime and physical activity depends on age and sex of residents. BMC Public Health, 17(1), 1–11. [DOI] [PMC free article] [PubMed] [Google Scholar]
- Roesch SC, Patch CM, Roman CG, et al. (2021). Crime and physical activity measures from the Safe and Fit Environments Study (SAFE): Psychometric properties across age groups. Preventive Medicine Reports, 22(6), 101381. [DOI] [PMC free article] [PubMed] [Google Scholar]
- Roman CG, & Chalfin A (2008). Fear of walking outdoors: a multilevel ecologic analysis of crime and disorder. American Journal of Preventive Medicine, 34(4), 306–312. [DOI] [PubMed] [Google Scholar]
- Saelens BE, Sallis JF, Frank LD, et al. (2012). Obesogenic neighborhood environments, child and parent obesity: the Neighborhood Impact on Kids study. American Journal of Preventive Medicine, 42(5):e57–e64. [DOI] [PMC free article] [PubMed] [Google Scholar]
- Sallis JF, Conway TL, Cain KL, et al. (2018). Neighborhood built environment and socioeconomic status in relation to physical activity, sedentary behavior, and weight status of adolescents. Preventive Medicine, 110(5):47–54. [DOI] [PMC free article] [PubMed] [Google Scholar]
- Sallis JF, Cervero RB, Ascher W, et al. (2006). An ecological approach to creating active living communities. Annual Review of Public Health, 27, 297–322. [DOI] [PubMed] [Google Scholar]
- Sallis JF, and Saelens BE (2000). Assessment of physical activity by self-report: Status, limitations, and future directions. Research Quarterly for Exercise and Sport, 71, S1–S14. [PubMed] [Google Scholar]
- Sallis JF, Saelens BE, Frank LD, et al. , (2009). Neighborhood built environment and income: Examining multiple health outcomes. Social Science and Medicine, 68, 1285–1293. [DOI] [PMC free article] [PubMed] [Google Scholar]
- Sampson RJ, & Raudenbush SW (2004). Seeing Disorder: Neighborhood stigma and the social construction of broken windows. Social Psychology Quarterly, 67: 319–342. [Google Scholar]
- Sampson RJ, Raudenbush SW, & Earls F (1997). Neighborhoods and violent crime: A multilevel study of collective efficacy. Science, 277(5328), 918–924. [DOI] [PubMed] [Google Scholar]
- Sharkey PT (2006). Navigating dangerous streets: The sources and consequences of street efficacy. American Sociological Review, 71(5), 826–846. [Google Scholar]
- Sheidow AJ, Gorman‐Smith D, Tolan PH, & Henry DB (2001). Family and community characteristics: Risk factors for violence exposure in inner‐city youth. Journal of Community Psychology, 29(3), 345–360. [Google Scholar]
- Shigematsu R, Sallis J, Conway T, Saelens B, Frank LD, Cain K, Chapman J, & King A (2009). Age differences in the relation of perceived neighborhood environment to walking. Medicine & Science in Sports & Exercise, 41, 2, 314–321. [DOI] [PMC free article] [PubMed] [Google Scholar]
- Skogan WG & Maxfield MG (1981). Coping with crime: Individual and neighborhood reactions. Beverly Hills, CA: Sage. [Google Scholar]
- Sugiyama T, Cerin E, Owen N, et al. (2014). Perceived neighborhood environment attributes associated with adults’ recreational walking: IPEN Adult study in 12 countries. Health and Place, 28, 22–30. [DOI] [PMC free article] [PubMed] [Google Scholar]
- Taylor RB (2015). Community criminology: Fundamentals of spatial and temporal scaling, Ecological Indicators, and Selectivity Bias. New York: New York University Press. [Google Scholar]
- Tewksbury R & Mustaine E (2003). College students’ lifestyles and self-protective behaviors: Further considerations of the guardianship concept in routine activity theory. Criminal Justice and Behavior, 30, 302–327. [Google Scholar]
- Thompson A, & Tapp SN (2023). Criminal Victimization, 2022. U.S. Bureau of Justice Statistics Report, NCJ 307089. Available: https://bjs.ojp.gov/document/cv22.pdf
- Thornberry TP, Krohn MD, Lizotte AJ, Smith CA, & Tobin K (2003). Gang membership and delinquency: Gangs in developmental perspective. New York: Cambridge University Press. [Google Scholar]
- Tolan PH, Gorman-Smith D, & Henry DB (2001). Chicago youth development study community and neighborhood measure: Construction and reliability technical report. Families and Communities Research Group, University of Illinois, Chicago, Ill, USA. [Google Scholar]
- Towne SD, Won J, Lee S et al. Using Walk Score™ and Neighborhood Perceptions to Assess Walking Among Middle-Aged and Older Adults. (2016). Journal of Community Health 41, 977–988. [DOI] [PubMed] [Google Scholar]
- Troped PJ, Brenner PS, & Wilson JS (2023). Associations between the built and social environment and bike share, physical activity, and overall cycling among adults from Boston neighborhoods. Journal of Transport & Health, 31, 101629 [Google Scholar]
- Tulloch M (2000). The meaning of age differences in the fear of crime: Combining quantitative and qualitative approaches. British Journal of Criminology, 40(3), 451–467. [Google Scholar]
- U.S. Department of Health and Human Services. (2015). Step It Up! The Surgeon General’s Call to Action to Promote Walking and Walkable Communities. Washington, DC: U.S. Dept of Health and Human Services, Office of the Surgeon General. [PubMed] [Google Scholar]
- Van Dyck D, Cerin E, De Bourdeaudhuij I, Salvo D, Christiansen LB, MacFarlane DJ, Owen N, Mitáš J, Troelsen J, Aguinaga-Ontoso I, DAVEY R, Reis RS, Sarmiento OL, Schofield G, Conway T, & Sallis JF (2015). Moderating effects of age, gender and education on the associations of perceived neighborhood environment attributes with accelerometer-based physical activity: The IPEN adult study. Health and Place, 36, 65–73. [DOI] [PMC free article] [PubMed] [Google Scholar]
- Wallace D (2015). A test of the routine activities and neighborhood attachment explanations for bias in disorder perceptions. Crime & Delinquency, 61, 587–609. [Google Scholar]
- Wang Y, Chau CK, Ng WY, Leung TM (2016). A review on the effects of physical built environment attributes on enhancing walking and cycling activity levels within residential neighborhoods. Cities,50, 1–15. [Google Scholar]
- Xu YY, Xie J, Yin H, Yang FF, Ma CM, Yang BY, Wan R, Guo B, Chen LD, & Li SL (2022). The Global Burden of Disease attributable to low physical activity and its trends from 1990 to 2019: An analysis of the Global Burden of Disease study. Frontiers in public health, 10, 1018866. [DOI] [PMC free article] [PubMed] [Google Scholar]
- Yip C, Sarma S, & Wilk P (2016). The association between social cohesion and physical activity in Canada: A multilevel analysis. SSM - Population Health, 2, 718 –723. [DOI] [PMC free article] [PubMed] [Google Scholar]
- Yuan Y, Dong B, Melde C (2015). Neighborhood context, street efficacy, and fear of violent victimization. Youth Violence and Juvenile Justice, 15(2) 119–137. [Google Scholar]
- Zuckerman M (2007). Sensation seeking and risky behavior. American Psychological Association. [Google Scholar]
Associated Data
This section collects any data citations, data availability statements, or supplementary materials included in this article.