

Abstract
Objective
To assess the presence of brain and systemic inflammation in subjects newly diagnosed with Parkinson's disease (PD).
Background
Evidence for a pathophysiologic role of inflammation in PD is growing. However, several key gaps remain as to the role of inflammation in PD, including the extent of immune activation at early stages, potential effects of PD treatments on inflammation and whether pro‐inflammatory signals are associated with clinical features and/or predict more rapid progression.
Methods
We enrolled subjects with de novo PD (n = 58) and age‐matched controls (n = 62). Subjects underwent clinical assessments, including the Movement Disorder Society‐United Parkinson's Disease rating scale (MDS‐UPDRS). Comprehensive cognitive assessment meeting MDS Level II criteria for mild cognitive impairment testing was performed. Blood was obtained for flow cytometry and cytokine/chemokine analyses. Subjects underwent imaging with 18F‐DPA‐714, a translocator protein 18kd ligand, and lumbar puncture if eligible and consented.
Results
Baseline demographics and medical history were comparable between groups. PD subjects showed significant differences in University of Pennsylvania Smell Identification Test, Schwab and England Activities of Daily Living, Scales for Outcomes in PD autonomic dysfunction, and MDS‐UPDRS scores. Cognitive testing demonstrated significant differences in cognitive composite, executive function, and visuospatial domain scores at baseline. Positron emission tomography imaging showed increased 18F‐DPA‐714 signal in PD subjects. 18F‐DPA‐714 signal correlated with several cognitive measures and some chemokines.
Conclusions
18F‐DPA‐714 imaging demonstrated increased central inflammation in de novo PD subjects compared to controls. Longitudinal follow‐up will be important to determine whether the presence of inflammation predicts cognitive decline. © 2023 The Authors. Movement Disorders published by Wiley Periodicals LLC on behalf of International Parkinson and Movement Disorder Society.
Keywords: Parkinson's disease, inflammation, TSPO PET, cognition, cytokine
Introduction
Evidence for inflammation in Parkinson's disease (PD) is growing, with innate and adaptive immune systems implicated. Post‐mortem studies reveal activated microglia and T‐cells 1 , 2 , 3 , 4 and immunoglobulin deposition 5 in brain tissue from PD subjects. Alterations in immune cells are detected in living PD subjects, with most consistent findings pointing to T‐cell and monocyte changes. 6 , 7 , 8 , 9 , 10 , 11 These changes may vary with disease duration or severity, although longitudinal studies to assess for changes in immune cells over time are lacking. Peptides derived from α‐synuclein (αsyn), the key protein that aggregates in PD and the primary component of Lewy bodies, can activate T‐cells from PD patients. 12 Pro‐inflammatory cytokines and chemokines are elevated in blood and cerebrospinal fluid (CSF) specimens from PD subjects. 13 , 14 , 15 , 16 , 17 , 18 , 19 , 20 , 21 , 22 , 23 , 24 , 25 , 26 Brain imaging using ligands against translocator protein 18kd (TSPO) as a marker for neuroinflammation show increased TSPO signal in PD patients. 27 , 28 , 29 , 30 , 31 , 32 Animal PD models show inflammatory changes, and manipulation of inflammation can alter neurodegeneration in animal models. 33 , 34 , 35 Epidemiologic studies suggest that immunomodulation may alter the course of PD: some data suggest that ibuprofen is protective against the development of PD, 36 , 37 , 38 whereas treatment of inflammatory bowel disease with anti‐ tumor necrosis factor (TNF) biologics is associated with reduced PD risk. 39 , 40 Despite the wealth of information pointing to inflammatory activation in PD, many gaps remain in our understanding of the role of inflammation in the pathophysiology of PD.
An important question is whether inflammation contributes to PD onset or arises later in the course of the disease in response to neurodegeneration. Genetic studies link polymorphisms in HLA genes to PD risk, 41 , 42 , 43 , 44 whereas several genes causal for PD, LRRK2, PRKN, and PINK1, play a role in immune cells, 34 supporting an early role of the immune system. Association of certain infections with PD risk also point to a causal role for inflammation in PD pathogenesis. 45 Interestingly, some infections stimulate αsyn levels. 46 , 47 T‐cell changes are prominent early and may precede disease onset. 48 Although these observations suggest a role of inflammation early in PD, most studies of inflammatory markers in human cohorts have examined a mix of subjects with a wide range of disease severity and duration and included patients already on treatment for PD. This is potentially problematic because dopaminergic drugs can alter immune responses. 49
Another gap is whether inflammation is associated with clinical features or predicts the subsequent course of disease, including cognitive decline. Most human studies evaluating inflammation in PD have been primarily performed in PD subjects with more advanced disease and lack longitudinal follow‐up with clinical assessment and collection of inflammatory measures. Most studies also do not include detailed cognitive assessments. Additionally, there is a lack of studies evaluating multiple inflammatory measures in the same cohort of patients.
To address gaps in our understanding of the role of neuroinflammation, we enrolled subjects with newly diagnosed, untreated PD (“de novo”) and controls in a longitudinal study designed to comprehensively measure markers of inflammation and track clinical outcomes. Subjects were enrolled within 2 years of PD diagnosis. Clinical evaluation included PD‐related scales and extensive cognitive testing consistent with the Level II diagnostic mild cognitive impairment (MCI) assessment criteria recommended by the Movement Disorders Society (MDS) task force. 50 Inflammatory measurements included plasma and CSF cytokine and chemokine measures, TSPO positron emission tomography (PET), and peripheral immune cell phenotyping using flow cytometry. Here, we describe clinical features and measures of inflammation in this cohort at the time of entry into the study.
Methods
Standard Protocol Approvals, Registrations, and Patient Consents
Participants were enrolled between November 2018 and December 2021 at the University of Alabama at Birmingham (UAB). The study was approved by the Institutional Review Board at UAB. Full written informed consent was obtained on each participant.
Participants
Fifty‐eight subjects with newly diagnosed PD and 62 age‐ and sex‐matched controls were enrolled in the Alabama Udall cohort. Inclusion criteria for PD subjects included the diagnosis of PD by United Kingdom Brain Bank criteria 51 within 2 years of enrollment, age ≥40 at time of diagnosis, and Hoehn and Yahr stage I‐III. Exclusion criteria for PD subjects included atypical parkinsonian syndromes, clinical diagnosis of dementia, PD diagnosis >2 years, previous treatment with PD medications, and the presence of other significant neurological disorders. Inclusion criteria for controls were age ≥40, no current diagnosis of PD or other significant neurological disorder, no history of PD in first‐degree blood relatives, and ≤3 positive responses on the PD Screening Questionnaire. 52 Exclusion criteria for all participants included significant autoimmune or inflammatory disorders, active treatment with immunosuppressants, and serious comorbidity that may interfere with study participation.
Clinical Evaluation
Clinical assessment included demographics, medical history, immune disorders and treatment questionnaire, vaccination history, prior and concomitant medication history, family history, behavioral history, PD Screening Questionnaire, vital signs, neurological examination, Epworth Sleepiness Scale, Hamilton Anxiety and Depression scales, MDS‐United Parkinson's Disease rating scale (MDS‐UPDRS), Modified Schwab and England Activities of Daily Living, Montreal Cognitive Assessment (MoCA), PD Quality of Life Questionnaire, Pittsburgh Sleep Quality Index, Scales for Outcomes in Parkinson's Disease‐Autonomic Dysfunction (SCOPA‐AUT), and University of Pennsylvania Smell Identification Test (UPSIT).
Participants underwent comprehensive cognitive assessment meeting Level II diagnostic MCI assessment criteria recommended by the MDS task force. 50 This testing included at least two tests across each of five cognitive domains: attention, language, memory, executive function, and visuospatial ability. To better describe patterns of cognitive performance, we included separate domains for verbal memory and visual memory and included a processing speed domain. Tests performed were Wechsler Adult Intelligence Scale‐Fourth Edition (WAIS‐IV) Digit Span and Letter‐Number Sequencing 53 ; Hopkins Verbal Learning Test‐Revised (HVLT‐R) 54 ; 10/36 Spatial Recall Test 55 ; Judgment of Line Orientation (JLO) 56 ; Hooper Visual Organization Test 57 ; Boston Naming Test (BNT) 58 ; Animal Naming 59 ; Delis‐Kaplan Executive Function System (DKEFS) Color/Word Interference 60 ; and Trail Making Test (TMT). 61 Normally distributed z‐scores for each domain were calculated using the best available normative mean and standard deviation (SD). Normative groups were stratified by age and education (when possible). At least two cognitive measures were used for each domain, and an average z‐score for the combined measures represented an aggregated domain score. The cognitive composite score was the average of all domain z‐scores.
Biospecimen Collection
Blood samples were processed for flow cytometry, complete blood count (performed at the UAB Hospital laboratories using a Beckman Coulter DxH 800 Hematology Analyzer), peripheral blood mononuclear cells isolation, plasma, DNA, and TSPO SNP genotyping. Although not required for participation, some subjects underwent CSF collection. Plasma, DNA, and CSF were banked at the UAB Center for Clinical and Translational Science (CCTS) Sample Processing and Analysis Network (SPAN) and at the National Institute of Neurological Disorders and Stroke (NINDS) BioSEND program. Blood and CSF samples were processed within 30 minutes after collection and then stored at −80°C.
Cytokine/Chemokine Analysis
Plasma and CSF cytokine and chemokine levels were measured by the V‐PLEX Proinflammatory Panel 1 and the V‐PLEX Chemokine Panel 1 (Meso Scale Diagnostics, Rockville, MD) using the MSD SECTOR Imager 2400 through the UAB Diabetes Research Center Human Physiology Core.
Flow Cytometry
Human TruStain FcX (BioLegend, San Diego, CA) was used to block 500 μL of fresh blood before incubation with fluorochrome‐conjugated monoclonal antibodies to monocyte, T‐cell, and B‐cell surface markers. Red blood cells (RBC) were lysed using RBC Lysis Buffer (BioLegend). After washing, cells were fixed with 2% paraformaldehyde. Cell viability was measured using the Aqua Live/Dead Kit (ThermoFisher Scientific, Waltham, MA). Antibodies used were from BioLegend: anti‐CD45 Pacific Blue (clone HI30); anti‐CD3 Brilliant Violet 605/Brilliant Violet 650 (clone OKT3); anti‐CD4 PE (clone OKT4); anti‐CD4 eFluor 450 (clone OKT4); anti‐CD8α FITC (clone HIT8a); anti‐CD14 FITC (clone HCD14); anti‐CD16 APC (clone 3G8); anti‐CD25 PE/PerCP‐Cyanine5.5 (clone M‐A251); anti‐CD19 Brilliant Violet 650 (clone HIB19); and anti‐CD127 APC‐Cy7 (clone A019D5). Antibodies at 1:100 were incubated for 20–30 minutes at room temperature. Flow cytometry was performed on a FACSymphony (BD Biosciences, Franklin Lakes, NJ). FlowJo software (Tree Star, Ashland, OR) was used for data analysis, as previously described. 62
PET Imaging
Dynamic PET data were acquired from 0 to 60 minutes after 18F‐DPA‐714 injection for eligible subjects. As the rs6971 single nucleotide polymorphism (SNP) is associated with TSPO radioligand binding affinity, 63 TSPO SNP genotyping was measured before PET. Those with low TSPO binding affinity were excluded from PET. All eligible subjects were scanned with a GE Signa PET/MR scanner. A sagittal T1‐weighted volumetric magnetic resonance (MR) series was acquired during PET acquisition for brain parcellation. PET images were reconstructed with ordered subset expectation maximization with the zero‐echo‐time (ZTE) magnetic resonance imaging (MRI)‐based attenuation correction. 64 All dynamic frames of the PET scan were co‐registered to the last frame to reduce the patient motion during the acquisition. To extract the time‐activity curves for volumes of interest (VOIs), brain parcellation was performed with FreeSurfer (v.7.1.1, Martinos Center, Boston, MA) 65 and then applied to the PET data. Partial volume correction was performed with the Geometric Transformation Matrix method in the PETPVC toolbox. 66 , 67 As FreeSurfer does not provide segmentation of the substantia nigra (SN), we developed an in‐house algorithm for fully automatic SN segmentation (Data S1/Supporting Information).
Ten brain regions were selected as the target VOI: putamen, caudate nucleus, SN, hippocampus, thalamus, brainstem, frontal cortex, temporal cortex, parietal cortex, and occipital cortex. For each region, simplified reference tissue model (SRTM) was used to estimate the binding potential (BP), with the cerebellum cortex serving as the reference region. 68 , 69 BP was constrained to be non‐negative for SRTM optimization.
Statistical Analysis
Characteristics of the study sample were described using means and SDs for continuous variables and frequencies for categorical variables. Differences between groups were analyzed using independent samples t tests for continuous variables and Pearson χ2 tests (or Fisher's exact tests) for categorical variables. For cytokine and chemokine comparisons, samples with levels below the detectable range were considered “0” in the analysis. Similar findings were observed when these values were excluded or when they were replaced with detection limits.
Multiple linear regression analysis was used to examine associations of each regional 18F‐DPA‐714 BP with disease status, sex, and TSPO genotype. Associations between each regional 18F‐DPA‐714 BP and clinical scales, cognitive domain scores, flow cytometry, and plasma or CSF cytokines/chemokines were examined in PD subjects only using multiple linear regression analysis, adjusting for TSPO genotype. Results were considered statistically significant at P < 0.05.
Statistical analyses were performed using version 4.2.0 Patched of the R programming environment (https://www.R-project.org).
Data Sharing
Clinical data are uploaded to the NINDS Data Management Resource. Plasma, DNA, and CSF are stored at the NINDS BioSEND repository. Additional data are available to qualified investigators on request.
Results
Referral Data
A total of 231 potential subjects were referred by the end of December 2022 (Supplementary Figure S1). A total of 174 were eligible after screening. Among eligible candidates, 125 consented for the study, and 49 refused to participate. A total of 120 completed the enrollment visits, and five were screen failures at enrollment visit.
Baseline Clinical Data
Among the 120 subjects enrolled, 58 subjects had PD, and 62 were controls. Baseline demographics, medical history, and family history were comparable between groups (Supplementary Tables 1, 2, 3). Controls differed from PD subjects for some vaccinations, with PD having a higher rate of tetanus, diphtheria, and pertussis vaccinations and a lower rate of coronavirus disease 2019 vaccinations at time of enrollment (Supplementary Table S4).
TABLE 1.
Clinical assessment scores in patient cohort at baseline
| PD, n = 58 | Control, n = 62 | P | N | |
|---|---|---|---|---|
| Age | 66.1 (8.55) | 64.1 (9.10) | 0.180 | 120 |
| Gender | 0.270 | 120 | ||
| Female | 25 (43.1%) | 34 (54.8%) | ||
| Male | 33 (56.9%) | 28 (45.2%) | ||
| PDQ‐39 total | 17.7 (16.5) | n/a | n/a | 57 |
| MoCA total points | 25.5 (3.73) | 27.5 (1.73) | <0.001 | 115 |
| UPSIT total score | 22.8 (7.84) | 32.4 (5.03) | <0.001 | 119 |
| Schwab and England ADL score | 91.4 (10.2) | 97.9 (5.17) | <0.001 | 120 |
| Epworth sleepiness scale total | 5.67 (4.21) | 5.10 (3.50) | 0.419 | 120 |
| HAM‐A total score | 3.28 (3.09) | 2.61 (4.96) | 0.378 | 120 |
| HAM‐D total score | 2.64 (2.63) | 3.16 (2.38) | 0.256 | 120 |
| SCOPA‐AUT score | 10.4 (6.63) | 5.85 (4.29) | <0.001 | 120 |
| PSQI total | 5.14 (3.70) | 5.35 (3.43) | 0.740 | 120 |
| UPDRS total | 43.4 (14.8) | 8.66 (5.89) | <0.001 | 119 |
Note: Values for control and PD are mean values (SD).
Abbreviations: PD, Parkinson's disease; PDQ‐39, PD Quality of Life Questionnaire 39; MoCA, Montreal Cognitive Assessment; UPSIT, University of Pennsylvania Smell Identification Test; ADL, activities of daily living; SCOOPA‐AUT, Scales for Outcomes in Parkinson's Disease‐Autonomic Dysfunction; PSQI, Pittsburgh Sleep Quality Index; UPDRS, United Parkinson's Disease rating scale; SD, standard deviation.
TABLE 2.
Cognitive data in patient cohort at baseline
| Cognitive variable | PD, n = 56 | Control, n = 60 | P | N |
|---|---|---|---|---|
| Attention | 0.31 (0.89) | 0.52 (0.78) | 0.176 | 115 |
| Verbal memory | 0.00 (1.07) | 0.25 (0.92) | 0.171 | 116 |
| Visual memory | −0.01 (0.90) | 0.30 (0.82) | 0.054 | 115 |
| Visuospatial | 0.03 (0.93) | 0.34 (0.72) | 0.046 | 116 |
| Language | 0.34 (0.73) | 0.46 (0.66) | 0.348 | 115 |
| Processing speed | 0.10 (0.79) | 0.26 (0.58) | 0.234 | 115 |
| Executive function | 0.05 (0.91) | 0.36 (0.72) | 0.044 | 115 |
| Cognitive composite | 0.14 (0.60) | 0.36 (0.47) | 0.033 | 114 |
Note: Values for control and PD are mean z score (SD).
Abbreviations: PD, Parkinson's disease; SD, standard deviation.
TABLE 3.
Baseline cytokine levels in plasma and CSF
| Control | PD | P | N | |
|---|---|---|---|---|
| Plasma | n = 62 | n = 56 | ||
| Eotaxin | 192 (74.1) | 207 (79.7) | 0.302 | 118 |
| Eotaxin‐3 | 17.9 (13.7) | 18.8 (9.85) | 0.678 | 117 |
| IP‐10 | 265 (128) | 327 (256) | 0.109 | 118 |
| MCP‐1 | 87.9 (36.0) | 146 (474) | 0.368 | 118 |
| MCP‐4 | 123 (75.9) | 127 (57.4) | 0.734 | 118 |
| MDC | 1040 (378) | 1191 (1032) | 0.306 | 118 |
| MIP‐1α | 10.4 (3.55) | 55.1 (231) | 0.153 | 118 |
| MIP‐1β | 68.8 (23.3) | 78.4 (29.8) | 0.054 | 118 |
| TARC | 268 (224) | 265 (152) | 0.912 | 118 |
| IL‐10 | 0.28 (0.14) | 0.37 (0.42) | 0.118 | 118 |
| IL‐8 | 7.26 (4.71) | 6.47 (2.19) | 0.243 | 118 |
| TNF‐α | 1.40 (0.41) | 1.49 (0.51) | 0.304 | 118 |
| IFN‐γ | 5.62 (3.54) | 5.25 (3.25) | 0.555 | 118 a |
| IL‐6 | 1.08 (0.79) | 1.07 (0.88) | 0.916 | 118 a |
| CSF | n = 19 | n = 25 | ||
| IL‐2 | 0.23 (0.13) | 0.87 (2.17) | 0.156 | 44 |
| IL‐8 | 41.9 (10.3) | 40.2 (12.0) | 0.619 | 44 |
| Eotaxin | 16.5 (10.1) | 19.6 (6.73) | 0.254 | 44 a |
| IP‐10 | 341 (195) | 419 (265) | 0.270 | 44 a |
| MCP‐1 | 342 (66.7) | 324 (107) | 0.478 | 44 a |
| MDC | 9.68 (6.55) | 13.2 (5.73) | 0.073 | 44 a |
| MIP‐1α | 5.43 (2.58) | 6.90 (1.81) | 0.043 | 44 a |
| MIP‐1β | 9.25 (2.17) | 10.7 (4.07) | 0.139 | 44 a |
| TARC | 2.48 (1.48) | 3.51 (1.42) | 0.025 | 44 a |
| IL‐6 | 0.93 (0.52) | 1.17 (0.71) | 0.195 | 44 a |
Note: Values for control and PD are mean values (SD). For both plasma and CSF, those cytokines and chemokines were excluded in which levels were below detection for >30% of subjects. For plasma samples, IL‐2, IL‐4, IL‐13, IL‐1β, and IL‐12p70 were excluded. For CSF samples, IL‐4, IL‐10, IL12p70, IL‐13, IL‐1β, IFN‐γ, TNF‐α, eotaxin‐3, and MCP‐4.
A few subject samples had undetectable values for the measured cytokine or chemokine. These undetectable values were replaced with zeros.
PD subjects showed significant differences in UPSIT, Schwab and England Activities of Daily Living, SCOPA‐AUT, and MDS‐UPDRS total scores (Table 1). PD subjects showed worse performance on the MoCA (Table 1) and showed significant differences in executive function, visuospatial ability, and cognitive composite at baseline compared to controls (Table 2).
Inflammatory Measures in Biospecimens
We measured cytokines and chemokines in the plasma of all subjects and in the CSF of those participants who agreed to undergo lumbar puncture (n = 19 controls and 25 PD subjects) (Table 3). We excluded those cytokines and chemokines in which levels for these molecules were below detection for >30% of subjects. Five molecules were excluded from the plasma analysis; nine were excluded from the CSF analysis (Table 3). Increased plasma macrophage inflammatory protein‐1β (MIP1β; also known as chemokine ligand 4 [CCL4]) was noted among PD subjects compared to controls (P = 0.054) (Table 3). In the CSF, significant increases in macrophage inflammatory protein‐1α (MIP1α/CCL3) (P = 0.043) and thymus‐ and activation‐regulated chemokine (TARC/CCL17) (P = 0.025) and an increased trend in macrophage‐derived chemokine (MDC/CCL22) (P = 0.073) were seen in PD subjects compared to controls (Table 3).
Complete blood counts and flow cytometry were performed on peripheral blood. No significant differences were noted in white blood cell or platelet counts. Small, but statistically significant increases were seen in hemoglobin and hematocrit levels in PD subjects (Supplementary Table S5). PD participants demonstrated increased CD4+ T non‐regulatory cell percentages (CD4+CD25+CD127+/dim; P = 0.048) with decreased CD4+ T regulatory (Tregs) cell percentages (CD4+CD25brightCD127dim; P = 0.038) compared to controls (Fig. 1A,B). PD subjects showed a higher neutrophil to lymphocyte ratio (NLR) compared to controls (Fig. 1C) (P = 0.004). This increased NLR was related to both an increase in neutrophils and a decrease in lymphocytes in PD subjects (Supplementary Table S5). No changes in CD4+ or CD8+ T‐cell, CD19+ B‐cell, or monocyte percentages were observed at baseline (Supplementary Fig. S2).
FIG 1.
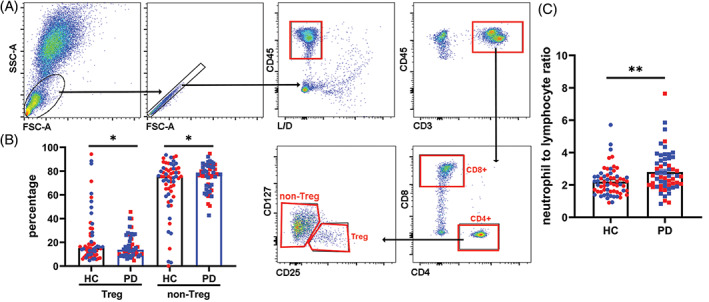
Alterations in T regulatory (Treg) subset, T non‐regulatory subset, and neutrophil to lymphocyte ratio (NLR) in Parkinson's disease (PD). (A) CD45+CD3+CD4+ cells were gated to CD25+CD127− Treg and CD25+CD127+ non‐Treg subsets. (B) Frequencies of Treg and non‐Treg subsets from PD and control subjects were analyzed and are shown as mean ± standard deviation (SD). *P < 0.05 (Student's t test). Red symbols are females, and blue symbols are males. (C) White blood cell count, including neutrophils, lymphocytes, monocytes, eosinophils, and basophils, was done as part of the complete blood count. The NLR was calculated as percentage of neutrophils divided by the percentage of lymphocytes and is shown as mean ± SD. **P < 0.01 (Student's t test). Red symbols are females, and blue symbols are males.
FIG 2.
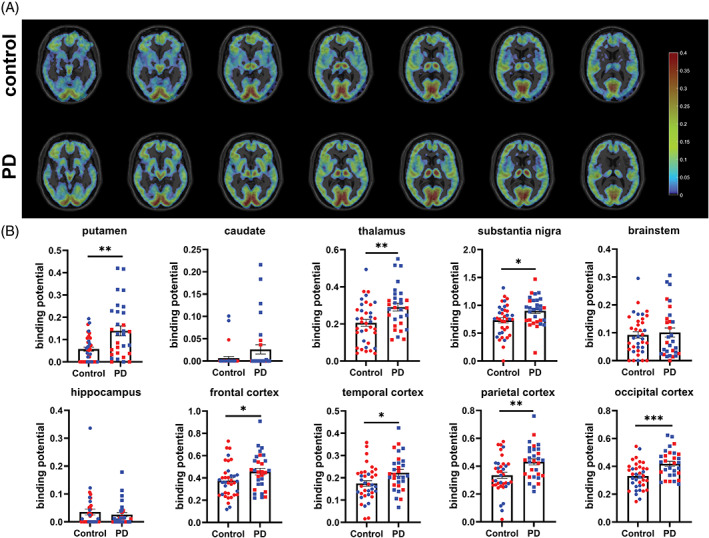
Parkinson's disease (PD) subjects show higher 18F‐DPA‐714 binding protein (BP) in the putamen, thalamus, substantia nigra, and cortical brain regions. (A) Comparison of the parametric images of binding potential between the control and PD cohorts. Mean of the BP images for high affinity binders (HAB) subjects is shown here. (B) Raw values for binding potential in control and PD subjects that is not adjusted for sex or translocator protein 18kd (TSPO) genotype. *P < 0.05, **P < 0.01, ***P < 0.001 (Student's t test with Welch's correction). Red symbols are females, and blue symbols are males. Using linear regression to adjust for TSPO genotype and sex, TSPO binding potential is higher in PD subjects in the putamen, thalamus, substantia nigra, and several cortical brain regions.
PET Imaging
Participants underwent TSPO SNP genotyping to determine eligibility for 18F‐DPA‐714 imaging. Among the 88 participants willing to undergo 18F‐DPA‐714 imaging, 14.8% were low affinity binders (LAB), 30.7% were mixed affinity binders (MAB), and 54.5% were high affinity binders (HAB). Only MAB and HAB subjects were imaged, with a total of 37 controls and 30 PD subjects who had 18F‐DPA‐714 imaging successfully completed. We observed a significant increase in unadjusted TSPO BP in PD participants at baseline in several brain regions (Fig. 2). Because TSPO genotype can affect BP, we examined the HAB and MAB binders separately. Differences between control and PD subjects were more prominent among HAB (Supplementary Table S6). Of note, the sample size was smaller and control and PD subjects were not well matched in the MAB group, which may account for the lack of differences in the MAB group.
We performed linear regression analysis including disease status, sex, and genotype in the same statistical model to determine the contributions of each predictor. After adjusting for TSPO genotype and sex, we found that PD subjects still had higher 18F‐DPA‐714 BP in the putamen, thalamus, SN, temporal cortex, parietal cortex, and occipital cortex compared to controls (Supplementary Table S7; P = 0.013 for putamen, P = 0.022 for thalamus, P = 0.045 for SN, P = 0.027 for temporal cortex, P = 0.012 for parietal cortex, P = 0.00093 for occipital cortex). As expected, TSPO genotype affected 18F‐DPA‐714 BP independent of diagnosis or sex in several brain regions (Supplementary Table S7) (P = 0.0085 for putamen, P = 0.0073 for brainstem, P = 0.00043 for frontal cortex, P = 0.023 for parietal cortex). We also observed a sex difference between male and female in 18F‐DPA 714 BP independent of diagnosis and TSPO genotype in the putamen and thalamus (Supplementary Table S7) (P = 0.011 in putamen, P = 0.0043 in thalamus).
Given the differences in 18F‐DPA‐714 imaging, we performed linear regression analyses to determine whether clinical measures, plasma or CSF cytokines and chemokines, or immune cell changes were associated with 18F‐DPA‐714 changes among PD subjects (Supplementary Table S8). We present the results for 18F‐DPA‐714 BP adjusted for TSPO genotype. After adjustment, we observed significant associations between 18F‐DPA‐714 BP in the thalamus with several cognitive domains, including visuospatial, language, verbal memory, and composite cognitive domain scores (Supplementary Table S8). We noted significant associations between the visuospatial domain and 18F‐DPA‐714 BP in the caudate, thalamus, and brainstem and between language domain scores and 18F‐DPA‐714 BP in the putamen and thalamus. As expected with the large number of variables examined in this discovery study, associations were no longer significant after full adjustment for multiple comparisons.
18F‐DPA‐714 BP also significantly associated with a subset of plasma and CSF cytokines and chemokines among PD participants. We observed significant associations between plasma eotaxin 3/CCL26 and 18F‐DPA‐714 BP in the putamen, thalamus, and hippocampus (Supplementary Table S8). We also noted significant associations between CSF MDC/CCL22 and 18F‐DPA‐714 BP in the putamen, thalamus, hippocampus, and brainstem (Supplementary Table S8). These associations were no longer significant after full adjustment for multiple comparisons. No significant associations were observed between PET measures and immune cell phenotyping by flow cytometry, except for NLR with 18F‐DPA‐714 BP in the SN (Supplementary Table S8).
Discussion
We enrolled subjects with de novo PD and controls in a longitudinal study designed to comprehensively measure markers of inflammation and track clinical outcomes. Baseline 18F‐DPA‐714 imaging revealed central inflammation in de novo PD patients. PD subjects demonstrated impairments in executive function, visual memory, and cognitive composite domains compared to controls at baseline. 18F‐DPA‐714 binding associated with certain cognitive domain and composite scores and with a subset of plasma and CSF chemokines.
Our study demonstrates elevations in TSPO binding in early, untreated PD. Previous studies examining TSPO binding in PD populations enrolled smaller numbers of PD subjects from a broad range of PD stage and duration and many who were already on active PD treatment. 27 , 28 , 29 , 30 , 31 , 32 Our data clearly demonstrate that increased TSPO binding is present in PD independent of treatment effects. Our multimodal study provides further evidence that TSPO signal as measured by 18F‐DPA‐714 is a marker of central inflammation, as we found correlations of 18F‐DPA‐714 signal with chemokine measures, in particular MDC/CCL22. This attractant for monocytes, Th2 T‐cells, and Treg cells is produced by microglia in experimental autoimmune encephalitis models. 70 The association between 18F‐DPA‐714 and MDC/CCL2 suggests that the 18F‐DPA‐714 signal is partly secondary to microglial activation, although the 18F‐DPA‐714 signal could mark peripheral immune cell infiltration in response to MDC/CCL2 release. The finding that increased 18F‐DPA‐714 binding was observed in most brain regions fits with this concept of peripheral immune cell infiltration early in PD. 71
With our baseline dataset, we performed a discovery‐based correlation analyses of PET with clinical measures to find whether any associations may be present at baseline within the PD group. The most interesting associations were found with cognitive data. 18F‐DPA‐714 BP was associated with the visuospatial domain score and the cognitive composite score in several brain regions. 18F‐DPA‐714 BP within the thalamus also associated with several cognitive domains, including verbal memory, visuospatial, and language domains. This observation suggests an important role for inflammation in the thalamus regarding cognitive findings early in PD. Previous MRI studies showed reduced thalamic volume and altered functional connectivity of the thalamus with cortical regions in PD subjects with MCI compared to PD subjects without MCI, and progressive loss of thalamic volume was associated with conversion to MCI in mild PD. 72 , 73 Neuronal loss and αsyn aggregates are seen in the intralaminar thalamic nuclei, which play important roles in cognition in PD. 74 A meta‐analysis of TSPO PET studies showed increased TSPO binding signal in the thalamus, 31 yet to our knowledge, PD subjects have not been evaluated extensively for inflammatory changes within the thalamus.
Other groups also observed an association between immune activation and cognitive changes. Immune markers were elevated in PD subjects at higher risk for dementia, and soluble TNF receptor levels correlated with poorer cognitive scores. 75 , 76 11C(R)PK11195 TSPO binding was negatively associated with MMSE scores in a small study of PD with dementia patients. 77 Although these data are supportive of pro‐inflammatory signals as predictive of cognitive decline, longitudinal studies measuring inflammatory signals and cognitive outcomes over time are missing. Longitudinal follow‐up of this cohort will be critical in understanding the significance of early inflammatory signals.
We noted an intriguing observation of sex differences in 18F‐DPA‐714 BP, with females showing reduced BP compared to males, independent of disease. This finding suggests that central inflammation as detected by TSPO PET differs between males and females. We previously noted sex‐related differences in the inflammatory response in PD, including sex differences in monocyte activation in PD. 7 Sex‐based differences in the immune response could point to potential reasons for the differences in PD prevalence observed between male and females. In a study examining age and sex effects on 11C‐PBR28 TSPO imaging, healthy females had higher total volume of distribution (Vt) compared to healthy males, but TSPO Vt increased with age in males. 78 Males and females were older in our study, which, in addition to structural differences between 11C‐PBR28 and 18F‐DPA‐714, may account for these differences in the effects of sex on TSPO imaging.
A limitation of TSPO PET is that it is unclear what cell type is responsible for the TSPO binding signal. TSPO is found not only in microglia, but also astrocytes and peripheral immune cells. 79 , 80 , 81 , 82 Recent studies in rodent models suggest that TSPO signal may be related more to microglial number than microglial activation. 83 Although our observations suggest that increased TSPO signal reflects central inflammation and correlates with cognitive measures, the TSPO signal we observed does not reveal which cell types are responsible. Additionally, second generation TSPO ligands, including 18F‐DPA‐714, are affected by the SNP rs6971 genotype. 63 We previously showed that 18F‐DPA‐714 PET can reveal the difference between TSPO binding in HAB and MAB normal controls. 84 When we examine our PET data by genotype, much of the difference between control and PD participants is driven by observations in the HAB subjects (Supplementary Table S6). The MAB group was only ~30% of the overall sample and poorly matched between controls and PD such that our MAB subset was underpowered. From a practical point of view, TSPO PET is likely to be most useful in HAB subjects. As HAB subjects are only half the population in our sample, alternative ligands not affected by this TSPO SNP are needed to bring PET imaging of neuroinflammation into the clinical arena.
The gold standard for PET imaging quantification involves arterial blood sampling to measure the arterial input function, yet this is invasive and difficult to perform in a large cohort. We used a reference region‐based approach using the cerebellar gray matter. Although 18F‐DPA‐714 can bind in cerebellum, 85 other studies point to BP estimated using cerebellar gray matter and SRTM as a feasible alternative for AIF‐derived BP. 69 , 86 Several groups used cerebellar gray matter or cerebellum as the reference region for TSPO‐PET quantification with 18F‐DPA‐714 and other TSPO tracers. 68 , 87 , 88 , 89 , 90 , 91 Cerebellar cortex time‐activity curves in our cohort showed no significant difference between HC and PD subjects (Supplementary Fig. S3), suggesting that the choice of our reference region did not influence our findings.
Previous studies of chemokine and cytokine levels in plasma or CSF pointed to elevations in several pro‐inflammatory molecules, although studies vary in the degree and particular cytokines or chemokines observed. 13 , 14 , 15 , 16 , 17 , 18 , 19 , 20 , 21 , 22 , 23 , 24 , 25 , 26 In blood, the most consistent changes are noted in interleukin (IL)‐1β, and some studies have also pointed to changes in IL‐2, interferon (IFN)‐γ, and TNF‐α. 26 Two recent studies have evaluated serum cytokines in early‐stage PD subjects. 13 , 25 In the ICICLE study, early stage PD subjects showed increased TNF‐α, IL‐1β, IL‐2, and IL‐10 in sera compared to controls, with subjects showing a “pro‐inflammatory” profile having faster progression on the mini mental status exam over 36 months. 25 In another study in early PD, Ahmad Rastegar et al 13 found that MIP‐1α and MCP‐1 predicted motor decline at 2 years in a cohort of PD patients with and without LRRK2 mutations. We found no significant differences in plasma cytokine levels between controls and PD subjects, although we saw a nearly significant increase in MIP‐1β and a trend in MIP‐1α. Potential differences between our findings and those studies performed at earlier stages include the smaller sample size in our group and the inclusion of a substantial number of LRRK2 mutation carriers in the Ahmad Rastegar study.
In the CSF, we observed increases in MIP‐1α and TARC in PD subjects compared to controls. Although elevations in specific inflammatory markers have differed between studies, most consistent changes have been noted in IL‐1β and IL‐6 in the CSF of PD patients. 14 , 16 , 19 , 21 , 26 In our cohort, we did see a non‐significant increase in IL‐6, and IL‐1β levels were below detection in a significant subset of subjects. Potential reasons for differences in our cohort and other published cohorts include differences in sample size, differences in disease duration and severity, and use of PD medication in other cohorts. Additionally, diurnal variations in CSF inflammatory molecules are greater in PD subjects compared to controls. 92
In our cohort, we observed an increase in the NLR in PD subjects; this marker of systemic inflammation has been observed in other PD cohorts. 93 We also saw a significant decrease in CD4+ Tregs in PD subjects. CD4+ Tregs are defined by the surface markers CD25+CD127− and have potent anti‐inflammatory and immunosuppressive properties. 94 , 95 , 96 In contrast, CD4+ non‐Tregs, defined by surface markers CD25+CD127+, were significantly increased in PD subjects. CD4+ non‐Tregs have pro‐inflammatory properties. 95 This decrease in Tregs and increase in non‐Tregs suggests a deficient anti‐inflammatory response, which may promote chronic inflammation in PD. These findings support previous observations of decreased percentages of Tregs in PD participants. 6 , 10 , 11 Of note, with regard to monocyte populations, we previously described a small difference in intermediate monocytes in males with PD, 7 but in this larger study we did not replicate this observation.
De novo PD is the earliest phase in which a clinical diagnosis of PD can be made. Rapid eye movement sleep behavior disorder (RBD) is viewed as a premotor stage of PD, as the vast majority of subjects with RBD eventually go on to develop PD. 97 , 98 Elevated TSPO binding is observed in the SN and occipital cortex in RBD subjects compared to controls, 99 , 100 two regions in which we observed increased TSPO BP. Changes in peripheral immune cell populations and plasma cytokines have been noted in RBD subjects. 101 , 102 These studies point to the likelihood of immune activation occurring even before the motor stages of PD.
In conclusion, we found elevated 18F‐DPA‐714 binding in newly diagnosed PD subjects, and this signal correlated with cognitive testing and a subset of plasma and CSF cytokines. This study supports the conclusion that central inflammation is observed early in the disease process in PD, is independent of treatment for PD, and is correlated with cognitive features and peripheral markers of inflammation. These findings suggest that early, inflammatory changes are associated with neurodegeneration in PD. Longitudinal follow‐up of this cohort will be critical to determine the significance of early inflammatory changes and to observe if certain inflammatory changes predict clinical progression. We will continue to collect biospecimens annually to determine if the inflammatory measures change over time in PD. Future studies will need to examine the potential causal relationship between inflammation and neurodegeneration.
Author Roles
(1) Research project: A. Conception, B. Organization, C. Execution; (2) Statistical Analysis: A. Design, B. Execution, C. Review and Critique; (3) Manuscript: A. Writing of the First Draft, B. Review and Critique.
T.A.Y., A.G., E.N.B., J.M., D.G.S.: conceptionalized the research.
T.A.Y., L.R.: organized the research.
T.A.Y., A.W.A., N.S., L.R., C.C., H.H., H.Q., J.M: executed research.
T.A.Y., Y.‐H.D.F., A.G., R.K., Y.Z., H.Q. designed, executed, and reviewed the statistical analysis.
T.A.Y., Y.‐H.D.F., A.G., R.K., Y.Z., E.N.B., D.G.S.: wrote the manuscript.
T.A.Y., Y.‐H.D.F., A.G., N.S., R.K., Y.Z., H.Q., E.N.B., J.M., D.G.S.; edited the final manuscript.
Financial Disclosures in Previous 12 Months
Authors have no financial conflicts of interest concerning the research in this manuscript.
T.A.Y. is a member of the faculty of the University of Alabama at Birmingham and is supported by endowment and University funds. She has a clinical practice and is compensated for these activities through the University of Alabama Health Services Foundation. She has active grants from the American Parkinson Disease Association, Travere Therapeutics, and the National Institutes for Health (NIH) (RF1NS115767‐A1, R01NS112203, P50NS108675, U01NS104326, R13GM109532, and T32GM008361). T.A.Y. serves on the Scientific Advisory Board for Parkinson's Foundation. T.A.Y. has received honorarium for presentations from the Movement Disorders Society and for grant reviews from NIH. She has a US Patent (7,919,262) on the use of 14–3‐3 s in neurodegeneration. Y.H.D.F. is a member of the faculty of the University of Alabama at Birmingham and is supported by University funds. He is an investigator in studies funded by NIH P50NS108675. He has received consulting fees from Popneuron. A.T.G. is a member of the faculty of the University of Alabama at Birmingham and is supported by University funds. A.T.G. is an investigator in studies funded by NIH (K23HD091849, RF1AG059009, and P50NS108675). He has a clinical practice and is compensated for these activities through the University of Alabama Health Services Foundation. Finally, he has received funds in payment for expert testimony and consultation he has provided in capacity, personal injury, and criminal legal cases. A.W.A. was a member of the faculty of the University of Alabama at Birmingham and is supported by University funds. She is currently employed by the University of Colorado and receives grant funding from the NIH (K23NS080912 and R01HD100670) and the McKnight Brain Institute. She has served as a site investigator for studies sponsored by The Michael J. Fox Foundation for Parkinson's Research, NeuroNEXT, Ely Lilly and Company, Biogen Idec and Jazz Pharmaceuticals. N.S. is a member of the faculty of the University of Alabama at Birmingham. She is an investigator in studies funded by F. Hoffmann‐LaRoche, Neuraly, UCB Biopharma SPRL, Cerevel Therapeutics, AbbVie, Praxis Precision Medicines, Dystonia Medical Research Foundation, and NIH grant P50NS108675. She has a clinical practice and is compensated for these activities through the University of Alabama Health Services Foundation. In the last year, she has been a consultant and received honoraria from The Huntington Study Group, and PSG EARSTIM DSMB. L.R. is employed by the University of Alabama at Birmingham. She is supported by studies funded by NIH (P50NS108675), Global Parkinson's Genetics Program (GP2), and The Michael J. Fox Foundation. C.C. is employed by the University of Alabama at Birmingham and is supported by University funds. He is also supported by studies funded by NIH (K23HD091849 and P50NS108675). He also has clinical duties and is compensated for these activities through the University of Alabama Health Services Foundation. R.K. is a member of the faculty of the University of Alabama at Birmingham He receives grant funding from the NIH (R01 NS102257, R01 AG060993, P50 NS108675, RF1 AG059009, R01 AG057684, R01 NS107316, R01 NR017181, and RF1 AG072773), the Veterans Health Administration (IIR 19–413‐2), and the Administration for Community Living (90DPTB0015). He also serves on the Data Safety and Monitoring Board for NIH (R61 AG065619). Y.Z. is an employee of the University of Alabama at Birmingham and is supported by NIH (R01AG057684, R01 NS102257, R01NS107316, P50NS108675, and R01AG060993). H.H. is employed by the University of Alabama at Birmingham and receives salary support from NIH (P50NS108675). H.Q. is a member of the faculty at the UAB and receives salary support through the University. She is an investigator in studies funded by the National Multiple Sclerosis Society, NIH (R01NS57563 and P50NS108675), and a grant from The Michael J. Fox Foundation for Parkinson Research. J.M. is a member of the faculty of the UAB and receives salary support through the University. He has a clinical practice and is compensated for these activities through the University of Alabama Health Services Foundation. He is an investigator in studies funded by the O'Neal Comprehensive Cancer Center, Eli Lilly/Avid, Blue Earth Diagnostics, GE Healthcare, Clovis Oncology, Cytosite Biopharma, and NIH (P50NS108675, R01NS109529, R21CA234764, P20AG068024, P01CA240307, R01CA240589, and U10CA180820). In addition, since January 1, 2021, he has served as a consultant for or received honoraria from Eli Lilly, GE Healthcare, ImaginAb, and Blue Earth Diagnostics. He has served on a scientific advisory board for Novartis/Advanced Accelerator Applications. E.N.B. is a member of the faculty of the UAB and is supported by endowment and University funds. She is an investigator in studies funded by The Michael J. Fox Foundation for Parkinson Research, the Department of Defense (W81CWH‐18‐1‐0036), and NIH (P30CA013148–49, P50NS108675, R01NS109529, R01CA246708, R01AI148711, and R01DK122986–02). In addition, since January 1, 2021, she has served as a consultant for or received honoraria from the SONTAG Brain Tumor Foundation, The Race to Erase MS Foundation, the NIH, the American Association for Medical Colleges, The National Multiple Sclerosis Society, and Emory University. D.G.S. is a member of the faculty of the University of Alabama at Birmingham and is supported by endowment and University funds. DGS is an investigator in studies funded by AbbVie, the American Parkinson Disease Association, The Michael J. Fox Foundation for Parkinson Research, Alabama Department of Commerce, Alabama Innovation Fund, the Department of Defense, and NIH (P50NS108675, R25NS079188, and T32NS095775). DGS has a clinical practice and is compensated for these activities through the University of Alabama Health Services Foundation. In addition, since January 1, 2021 he has served as a consultant for or received honoraria from AbbVie, Sutter Health, Curium Pharma, Appello, Theravance, Sanofi‐Aventis, Alnylam Pharmaceutics, Coave Therapeutics, BlueRock Therapeutics, and F. Hoffman‐La Roche.
Supporting information
Data S1. Supporting Information
Table S8. Regression analysis between regional PET binding potential and clinical, cognitive, cytokine/chemokine, and immune cell phenotyping measures in the PD subjects, adjusting for TSPO genotype. Separate excel file.
Acknowledgments
This work was supported by the National Institutes of Health (P50NS108675).
Relevant conflict of interest/financial disclosure: Authors have no financial conflicts of interest concerning the research in this manuscript.
Funding agency: The National Institute of Neurological Disorders and Stroke P50NS108675.
Data Availability Statement
Clinical data are uploaded to the NINDS Data Management Resource. Plasma, DNA, and CSF are stored at the NINDS BioSEND repository. Additional data are available to qualified investigators on request.
References
- 1. Brochard V, Combadiere B, Prigent A, et al. Infiltration of CD4+ lymphocytes into the brain contributes to neurodegeneration in a mouse model of Parkinson disease. J Clin Invest 2009;119(1):182–192. 10.1172/JCI36470 [DOI] [PMC free article] [PubMed] [Google Scholar]
- 2. McGeer PL, Itagaki S, Akiyama H, et al. Rate of cell death in parkinsonism indicates active neuropathological process. Ann Neurol 1988;24(4):574–576. 10.1002/ana.410240415 [DOI] [PubMed] [Google Scholar]
- 3. McGeer PL, Itagaki S, Boyes BE, et al. Reactive microglia are positive for HLA‐DR in the substantia nigra of Parkinson's and Alzheimer's disease brains. Neurology 1988;38(8):1285–1291. 10.1212/wnl.38.8.1285 [DOI] [PubMed] [Google Scholar]
- 4. Sommer A, Marxreiter F, Krach F, et al. Th17 lymphocytes induce neuronal cell death in a human iPSC‐based model of Parkinson's disease. Cell Stem Cell 2018;23(1):123–31 e6. 10.1016/j.stem.2018.06.015 [DOI] [PubMed] [Google Scholar]
- 5. Orr CF, Rowe DB, Mizuno Y, et al. A possible role for humoral immunity in the pathogenesis of Parkinson's disease. Brain 2005;128(Pt 11):2665–2674. 10.1093/brain/awh625 [DOI] [PubMed] [Google Scholar]
- 6. Alvarez‐Luquin DD, Arce‐Sillas A, Leyva‐Hernandez J, et al. Regulatory impairment in untreated Parkinson's disease is not restricted to Tregs: other regulatory populations are also involved. J Neuroinflammation 2019;16(1):212. 10.1186/s12974-019-1606-1 [DOI] [PMC free article] [PubMed] [Google Scholar]
- 7. Carlisle SM, Qin H, Hendrickson RC, et al. Sex‐based differences in the activation of peripheral blood monocytes in early Parkinson disease. npj Parkinsons Dis 2021;7(1):36. 10.1038/s41531-021-00180-z [DOI] [PMC free article] [PubMed] [Google Scholar]
- 8. Grozdanov V, Bliederhaeuser C, Ruf WP, et al. Inflammatory dysregulation of blood monocytes in Parkinson's disease patients. Acta Neuropathol 2014;128(5):651–663. 10.1007/s00401-014-1345-4 [DOI] [PMC free article] [PubMed] [Google Scholar]
- 9. Jiang S, Gao H, Luo Q, et al. The correlation of lymphocyte subsets, natural killer cell, and Parkinson's disease: a meta‐analysis. Neurol Sci 2017;38(8):1373–1380. 10.1007/s10072-017-2988-4 [DOI] [PubMed] [Google Scholar]
- 10. Saunders JA, Estes KA, Kosloski LM, et al. CD4+ regulatory and effector/memory T cell subsets profile motor dysfunction in Parkinson's disease. J Neuroimmune Pharmacol 2012;7(4):927–938. 10.1007/s11481-012-9402-z [DOI] [PMC free article] [PubMed] [Google Scholar]
- 11. Kustrimovic N, Rasini E, Legnaro M, et al. Dopaminergic receptors on CD4+ T naive and memory lymphocytes correlate with motor impairment in patients with Parkinson's disease. Sci Rep 2016;6:33738. 10.1038/srep33738 [DOI] [PMC free article] [PubMed] [Google Scholar]
- 12. Sulzer D, Alcalay RN, Garretti F, et al. T cells from patients with Parkinson's disease recognize alpha‐synuclein peptides. Nature 2017;546(7660):656–661. 10.1038/nature22815 [DOI] [PMC free article] [PubMed] [Google Scholar]
- 13. Ahmadi Rastegar D, Ho N, Halliday GM, et al. Parkinson's progression prediction using machine learning and serum cytokines. npj Parkinson's Dis 2019;5:14. 10.1038/s41531-019-0086-4 [DOI] [PMC free article] [PubMed] [Google Scholar]
- 14. Blum‐Degen D, Muller T, Kuhn W, et al. Interleukin‐1 beta and interleukin‐6 are elevated in the cerebrospinal fluid of Alzheimer's and de novo Parkinson's disease patients. Neurosci Lett 1995;202(1–2):17–20. 10.1016/0304-3940(95)12192-7 [DOI] [PubMed] [Google Scholar]
- 15. Brodacki B, Staszewski J, Toczylowska B, et al. Serum interleukin (IL‐2, IL‐10, IL‐6, IL‐4), TNFalpha, and INFgamma concentrations are elevated in patients with atypical and idiopathic parkinsonism. Neurosci Lett 2008;441(2):158–162. 10.1016/j.neulet.2008.06.040 [DOI] [PubMed] [Google Scholar]
- 16. Chen X, Hu Y, Cao Z, et al. Cerebrospinal fluid inflammatory cytokine aberrations in Alzheimer's disease, Parkinson's disease and amyotrophic lateral sclerosis: a systematic review and meta‐analysis. Front Immunol 2018;9:2122. 10.3389/fimmu.2018.02122 [DOI] [PMC free article] [PubMed] [Google Scholar]
- 17. Hall S, Janelidze S, Surova Y, et al. Cerebrospinal fluid concentrations of inflammatory markers in Parkinson's disease and atypical parkinsonian disorders. Sci Rep 2018;8(1):13276. 10.1038/s41598-018-31517-z [DOI] [PMC free article] [PubMed] [Google Scholar]
- 18. Karpenko MN, Vasilishina AA, Gromova EA, et al. Interleukin‐1beta, interleukin‐1 receptor antagonist, interleukin‐6, interleukin‐10, and tumor necrosis factor‐alpha levels in CSF and serum in relation to the clinical diversity of Parkinson's disease. Cell Immunol 2018;327:77–82. 10.1016/j.cellimm.2018.02.011 [DOI] [PubMed] [Google Scholar]
- 19. Mogi M, Harada M, Narabayashi H, et al. Interleukin (IL)‐1 beta, IL‐2, IL‐4, IL‐6 and transforming growth factor‐alpha levels are elevated in ventricular cerebrospinal fluid in juvenile parkinsonism and Parkinson's disease. Neurosci Lett 1996;211(1):13–16. 10.1016/0304-3940(96)12706-3 [DOI] [PubMed] [Google Scholar]
- 20. Mogi M, Harada M, Riederer P, et al. Tumor necrosis factor‐alpha (TNF‐alpha) increases both in the brain and in the cerebrospinal fluid from parkinsonian patients. Neurosci Lett 1994;165(1–2):208–210. 10.1016/0304-3940(94)90746-3 [DOI] [PubMed] [Google Scholar]
- 21. Muller T, Blum‐Degen D, Przuntek H, et al. Interleukin‐6 levels in cerebrospinal fluid inversely correlate to severity of Parkinson's disease. Acta Neurol Scand 1998;98(2):142–144. 10.1111/j.1600-0404.1998.tb01736.x [DOI] [PubMed] [Google Scholar]
- 22. Qin XY, Zhang SP, Cao C, et al. Aberrations in peripheral inflammatory cytokine levels in Parkinson disease: a systematic review and meta‐analysis. JAMA Neurol 2016;73(11):1316–1324. 10.1001/jamaneurol.2016.2742 [DOI] [PubMed] [Google Scholar]
- 23. Reale M, Iarlori C, Thomas A, et al. Peripheral cytokines profile in Parkinson's disease. Brain Behav Immun 2009;23(1):55–63. 10.1016/j.bbi.2008.07.003 [DOI] [PubMed] [Google Scholar]
- 24. Scalzo P, Kummer A, Cardoso F, et al. Serum levels of interleukin‐6 are elevated in patients with Parkinson's disease and correlate with physical performance. Neurosci Lett 2010;468(1):56–58. 10.1016/j.neulet.2009.10.062 [DOI] [PubMed] [Google Scholar]
- 25. Williams‐Gray CH, Wijeyekoon R, Yarnall AJ, et al. Serum immune markers and disease progression in an incident Parkinson's disease cohort (ICICLE‐PD). Mov Disord 2016;31(7):995–1003. 10.1002/mds.26563 [DOI] [PMC free article] [PubMed] [Google Scholar]
- 26. Zimmermann M, Brockmann K. Blood and cerebrospinal fluid biomarkers of inflammation in Parkinson's disease. J Parkinsons Dis 2022;12:S183–S200. 10.3233/JPD-223277 [DOI] [PMC free article] [PubMed] [Google Scholar]
- 27. Iannaccone S, Cerami C, Alessio M, et al. In vivo microglia activation in very early dementia with Lewy bodies, comparison with Parkinson's disease. Parkinsonism Relat Disord 2013;19(1):47–52. 10.1016/j.parkreldis.2012.07.002 [DOI] [PubMed] [Google Scholar]
- 28. Lavisse S, Goutal S, Wimberley C, et al. Increased microglial activation in patients with Parkinson disease using [(18)F]‐DPA714 TSPO PET imaging. Parkinsonism Relat Disord 2021;82:29–36. 10.1016/j.parkreldis.2020.11.011 [DOI] [PubMed] [Google Scholar]
- 29. Ouchi Y, Yoshikawa E, Sekine Y, et al. Microglial activation and dopamine terminal loss in early Parkinson's disease. Ann Neurol 2005;57(2):168–175. 10.1002/ana.20338 [DOI] [PubMed] [Google Scholar]
- 30. Terada T, Yokokura M, Yoshikawa E, et al. Extrastriatal spreading of microglial activation in Parkinson's disease: a positron emission tomography study. Ann Nucl Med 2016;30(8):579–587. 10.1007/s12149-016-1099-2 [DOI] [PubMed] [Google Scholar]
- 31. Zhang PF, Gao F. Neuroinflammation in Parkinson's disease: a meta‐analysis of PET imaging studies. J Neurol 2022;269(5):2304–2314. 10.1007/s00415-021-10877-z [DOI] [PubMed] [Google Scholar]
- 32. Liu S‐Y, Qiao H‐W, Song T‐B, et al. Brain microglia activation and peripheral adaptive immunity in Parkinson's disease: a multimodal PET study. J Neuroinflammation 2022;19(1):209. 10.1186/s12974-022-02574-z [DOI] [PMC free article] [PubMed] [Google Scholar]
- 33. Qin H, Buckley JA, Li X, et al. Inhibition of the JAK/STAT pathway protects against α‐synuclein‐induced neuroinflammation and dopaminergic neurodegeneration. J Neurosci 2016;36(18):5144–5159. 10.1523/jneurosci.4658-15.2016 [DOI] [PMC free article] [PubMed] [Google Scholar]
- 34. Tansey MG, Wallings RL, Houser MC, et al. Inflammation and immune dysfunction in Parkinson disease. Nat Rev Immunol 2022;22:657–673. 10.1038/s41577-022-00684-6 [DOI] [PMC free article] [PubMed] [Google Scholar]
- 35. Weiss F, Labrador‐Garrido A, Dzamko N, et al. Immune responses in the Parkinson's disease brain. Neurobiol Dis 2022;168:105700. 10.1016/j.nbd.2022.105700 [DOI] [PubMed] [Google Scholar]
- 36. Chen H, Jacobs E, Schwarzschild MA, et al. Nonsteroidal antiinflammatory drug use and the risk for Parkinson's disease. Ann Neurol 2005;58(6):963–967. 10.1002/ana.20682 [DOI] [PubMed] [Google Scholar]
- 37. Chen H, Zhang SM, Hernan MA, et al. Nonsteroidal anti‐inflammatory drugs and the risk of Parkinson disease. Arch Neurol 2003;60(8):1059–1064. 10.1001/archneur.60.8.1059 [DOI] [PubMed] [Google Scholar]
- 38. Samii A, Etminan M, Wiens MO, et al. NSAID use and the risk of Parkinson's disease: systematic review and meta‐analysis of observational studies. Drugs Aging 2009;26(9):769–779. 10.2165/11316780-000000000-00000 [DOI] [PubMed] [Google Scholar]
- 39. Park S, Kim J, Chun J, et al. Patients with inflammatory bowel disease are at an increased risk of Parkinson's disease: a south Korean Nationwide population‐based study. J Clin Med 2019;8(8):1191. 10.3390/jcm8081191 [DOI] [PMC free article] [PubMed] [Google Scholar]
- 40. Peter I, Dubinsky M, Bressman S, et al. Anti‐tumor necrosis factor therapy and incidence of Parkinson disease among patients with inflammatory bowel disease. JAMA Neurol 2018;75(8):939–946. 10.1001/jamaneurol.2018.0605 [DOI] [PMC free article] [PubMed] [Google Scholar]
- 41. Hamza TH, Zabetian CP, Tenesa A, et al. Common genetic variation in the HLA region is associated with late‐onset sporadic Parkinson's disease. Nat Genet 2010;42(9):781–785. 10.1038/ng.642 [DOI] [PMC free article] [PubMed] [Google Scholar]
- 42. Kannarkat GT, Cook DA, Lee JK, et al. Common genetic variant association with altered HLA expression, synergy with pyrethroid exposure, and risk for Parkinson's disease: an observational and case‐control study. npj Parkinson's Dis 2015;1:15002. 10.1038/npjparkd.2015.2 [DOI] [PMC free article] [PubMed] [Google Scholar]
- 43. Nalls MA, Pankratz N, Lill CM, et al. Large‐scale meta‐analysis of genome‐wide association data identifies six new risk loci for Parkinson's disease. Nat Genet 2014;46(9):989–993. 10.1038/ng.3043 [DOI] [PMC free article] [PubMed] [Google Scholar]
- 44. Wissemann WT, Hill‐Burns EM, Zabetian CP, et al. Association of Parkinson disease with structural and regulatory variants in the HLA region. Am J Hum Genet 2013;93(5):984–993. 10.1016/j.ajhg.2013.10.009 [DOI] [PMC free article] [PubMed] [Google Scholar]
- 45. Smeyne RJ, Noyce AJ, Byrne M, et al. Infection and risk of Parkinson's disease. J Parkinsons Dis 2021;11(1):31–43. 10.3233/JPD-202279 [DOI] [PMC free article] [PubMed] [Google Scholar]
- 46. Beatman EL, Massey A, Shives KD, et al. Alpha‐Synuclein expression restricts RNA viral infections in the brain. J Virol 2015;90(6):2767–2782. 10.1128/JVI.02949-15 [DOI] [PMC free article] [PubMed] [Google Scholar]
- 47. Stolzenberg E, Berry D, Yang DE, et al. A role for neuronal alpha‐Synuclein in gastrointestinal immunity. J Innate Immun 2017;9(5):456–463. 10.1159/000477990 [DOI] [PMC free article] [PubMed] [Google Scholar]
- 48. Lindestam Arlehamn CS, Dhanwani R, Pham J, et al. α‐Synuclein‐specific T cell reactivity is associated with preclinical and early Parkinson's disease. Nat Commun 2020;11(1):1875. 10.1038/s41467-020-15626-w [DOI] [PMC free article] [PubMed] [Google Scholar]
- 49. Li M, Zhou L, Sun X, et al. Dopamine, a co‐regulatory component, bridges the central nervous system and the immune system. Biomed Pharmacother 2022;145:112458. 10.1016/j.biopha.2021.112458 [DOI] [PubMed] [Google Scholar]
- 50. Litvan I, Goldman JG, Troster AI, et al. Diagnostic criteria for mild cognitive impairment in Parkinson's disease: Movement Disorder Society task force guidelines. Mov Disord 2012;27(3):349–356. 10.1002/mds.24893 [DOI] [PMC free article] [PubMed] [Google Scholar]
- 51. Hughes AJ, Daniel SE, Kilford L, et al. Accuracy of clinical diagnosis of idiopathic Parkinson's disease: a clinico‐pathological study of 100 cases. J Neurol Neurosurg Psychiatry 1992;55(3):181–184. 10.1136/jnnp.55.3.181 [DOI] [PMC free article] [PubMed] [Google Scholar]
- 52. Rocca WA, Maraganore DM, McDonnell SK, et al. Validation of a telephone questionnaire for Parkinson's disease. J Clin Epidemiol 1998;51(6):517–523. 10.1016/s0895-4356(98)00017-1 [DOI] [PubMed] [Google Scholar]
- 53. Wechsler D, Psychological C. PsychCorp. WAIS‐IV Technical and Interpretive Manual. San Antonio, Tex: Pearson; 2008. [Google Scholar]
- 54. Brandt J, Benedict R. Hopkins Verbal Learning Test‐Revised: Professional Manual. Florida: PAR; 2001. [Google Scholar]
- 55. Rao SM, Cognitive Function Study Group N . A manual for the Brief Repeatable Battery of Neuropsychological Tests in Multiple Sclerosis. New York: National Multiple Sclerosis Society; 1990. [Google Scholar]
- 56. Benton AI, Sivan AB, Hamsher K, et al. Contributions to Neuropsychological Assessment: A Clinical Manual. 2nd ed. Oxford: New York, NY; 1994. [Google Scholar]
- 57. Hooper HE. Hooper Visual Organization Test. Western Psychological Services: Los Angeles, CA; 1983. [Google Scholar]
- 58. Kaplan E, Goodlass H, Weintraub S. The Boston Naming Test. Philadelphia, PA: Lea & Febiger; 1983. [Google Scholar]
- 59. Ruff RM, Light RH, Parker SB, et al. Benton controlled Oral word association test: reliability and updated norms. Arch Clin Neuropsychol 1996;11(4):329–338. [PubMed] [Google Scholar]
- 60. Delis DC, Kaplan E, Kramer JH. Delis‐Kaplin Executive Function System (D‐KEFS): Examiner's Manual. San Antonio, TX: The Psychological Corporation; 2001. [Google Scholar]
- 61. Spreen O, Strauss E. A Compendium of Neuropsychological Tests: Administration, Norms and Commentary. 2nd ed. New York: Oxford University Press; 1998. [Google Scholar]
- 62. Yan Z, Yang W, Parkitny L, et al. Deficiency of Socs3 leads to brain‐targeted EAE via enhanced neutrophil activation and ROS production. JCI Insight 2019;5(9):e126520. 10.1172/jci.insight.126520 [DOI] [PMC free article] [PubMed] [Google Scholar]
- 63. Owen DR, Yeo AJ, Gunn RN, et al. An 18‐kDa translocator protein (TSPO) polymorphism explains differences in binding affinity of the PET radioligand PBR28. J Cereb Blood Flow Metab 2012;32(1):1–5. 10.1038/jcbfm.2011.147 [DOI] [PMC free article] [PubMed] [Google Scholar]
- 64. Sekine T, Ter Voert EE, Warnock G, et al. Clinical evaluation of zero‐Echo‐time attenuation correction for brain 18F‐FDG PET/MRI: comparison with atlas attenuation correction. J Nucl Med 2016;57(12):1927–1932. 10.2967/jnumed.116.175398 [DOI] [PubMed] [Google Scholar]
- 65. Fischl B. FreeSurfer. Neuroimage 2012;62(2):774–781. 10.1016/j.neuroimage.2012.01.021 [DOI] [PMC free article] [PubMed] [Google Scholar]
- 66. Rousset OG, Ma Y, Evans AC. Correction for partial volume effects in PET: principle and validation. J Nucl Med 1998;39(5):904–911. [PubMed] [Google Scholar]
- 67. Thomas BA, Cuplov V, Bousse A, et al. PETPVC: a toolbox for performing partial volume correction techniques in positron emission tomography. Phys Med Biol 2016;61(22):7975–7993. 10.1088/0031-9155/61/22/7975 [DOI] [PubMed] [Google Scholar]
- 68. Hamelin L, Lagarde J, Dorothée G, et al. Early and protective microglial activation in Alzheimer's disease: a prospective study using 18F‐DPA‐714 PET imaging. Brain 2016;139(Pt 4):1252–1264. 10.1093/brain/aww017 [DOI] [PubMed] [Google Scholar]
- 69. Golla SS, Boellaard R, Oikonen V, et al. Quantification of [18F]DPA‐714 binding in the human brain: initial studies in healthy controls and Alzheimer's disease patients. J Cereb Blood Flow Metab 2015;35(5):766–772. 10.1038/jcbfm.2014.261 [DOI] [PMC free article] [PubMed] [Google Scholar]
- 70. Columba‐Cabezas S, Serafini B, Ambrosini E, et al. Induction of macrophage‐derived chemokine/CCL22 expression in experimental autoimmune encephalomyelitis and cultured microglia: implications for disease regulation. J Neuroimmunol 2002;130(1–2):10–21. 10.1016/s0165-5728(02)00170-4 [DOI] [PubMed] [Google Scholar]
- 71. Harms AS, Thome AD, Yan Z, et al. Peripheral monocyte entry is required for alpha‐Synuclein induced inflammation and neurodegeneration in a model of Parkinson disease. Exp Neurol 2018;300:179–187. 10.1016/j.expneurol.2017.11.010 [DOI] [PMC free article] [PubMed] [Google Scholar]
- 72. Foo H, Mak E, Yong TT, et al. Progression of subcortical atrophy in mild Parkinson's disease and its impact on cognition. Eur J Neurol 2017;24(2):341–348. 10.1111/ene.13205 [DOI] [PubMed] [Google Scholar]
- 73. Li MG, He JF, Liu XY, et al. Structural and functional thalamic changes in Parkinson's disease with mild cognitive impairment. J Magn Reson Imaging 2020;52(4):1207–1215. 10.1002/jmri.27195 [DOI] [PubMed] [Google Scholar]
- 74. Halliday GM. Thalamic changes in Parkinson's disease. Parkinsonism Relat Disord 2009;15(Suppl 3):S152–S155. 10.1016/s1353-8020(09)70804-1 [DOI] [PubMed] [Google Scholar]
- 75. Rocha NP, Teixeira AL, Scalzo PL, et al. Plasma levels of soluble tumor necrosis factor receptors are associated with cognitive performance in Parkinson's disease. Mov Disord 2014;29(4):527–531. 10.1002/mds.25752 [DOI] [PubMed] [Google Scholar]
- 76. Wijeyekoon RS, Kronenberg‐Versteeg D, Scott KM, et al. Peripheral innate immune and bacterial signals relate to clinical heterogeneity in Parkinson's disease. Brain Behav Immun 2020;87:473–488. 10.1016/j.bbi.2020.01.018 [DOI] [PMC free article] [PubMed] [Google Scholar]
- 77. Fan Z, Aman Y, Ahmed I, et al. Influence of microglial activation on neuronal function in Alzheimer's and Parkinson's disease dementia. Alzheimers Dement 2015;11(6):608–21.e7. 10.1016/j.jalz.2014.06.016 [DOI] [PubMed] [Google Scholar]
- 78. Tuisku J, Plavén‐Sigray P, Gaiser EC, et al. Effects of age, BMI and sex on the glial cell marker TSPO — a multicentre [11C]PBR28 HRRT PET study. Eur J Nucl Med Mol Imaging 2019;46(11):2329–2338. 10.1007/s00259-019-04403-7 [DOI] [PMC free article] [PubMed] [Google Scholar]
- 79. Vicente‐Rodriguez M, Singh N, Turkheimer F, et al. Resolving the cellular specificity of TSPO imaging in a rat model of peripherally‐induced neuroinflammation. Brain Behav Immun 2021;96:154–167. 10.1016/j.bbi.2021.05.025 [DOI] [PMC free article] [PubMed] [Google Scholar]
- 80. Werry EL, Bright FM, Piguet O, et al. Recent developments in TSPO PET imaging as a biomarker of Neuroinflammation in neurodegenerative disorders. Int J Mol Sci 2019;20(13):3161. 10.3390/ijms20133161 [DOI] [PMC free article] [PubMed] [Google Scholar]
- 81. Wimberley C, Lavisse S, Brulon V, et al. Impact of endothelial 18‐kDa translocator protein on the quantification of (18)F‐DPA‐714. J Nucl Med 2018;59(2):307–314. 10.2967/jnumed.117.195396 [DOI] [PubMed] [Google Scholar]
- 82. Zhou R, Ji B, Kong Y, et al. PET imaging of Neuroinflammation in Alzheimer's disease. Front Immunol 2021;12:739130. 10.3389/fimmu.2021.739130 [DOI] [PMC free article] [PubMed] [Google Scholar]
- 83. Nutma E, Fancy N, Weinert M, et al. Translocator protein is a marker of activated microglia in rodent models but not human neurodegenerative diseases. bioRxiv 2022. 10.1101/2022.05.11.491453 [DOI] [PMC free article] [PubMed] [Google Scholar]
- 84. Fang YD, McConathy JE, Yacoubian TA, et al. Image quantification for TSPO PET with a novel image‐derived input function method. Diagnostics 2022;12(5):1161. 10.3390/diagnostics12051161 [DOI] [PMC free article] [PubMed] [Google Scholar]
- 85. Schuitemaker A, van der Doef TF, Boellaard R, et al. Microglial activation in healthy aging. Neurobiol Aging 2012;33(6):1067–1072. 10.1016/j.neurobiolaging.2010.09.016 [DOI] [PubMed] [Google Scholar]
- 86. Golla SS, Boellaard R, Oikonen V, et al. Parametric binding images of the TSPO ligand 18F‐DPA‐714. J Nucl Med 2016;57(10):1543–1547. 10.2967/jnumed.116.173013 [DOI] [PubMed] [Google Scholar]
- 87. Hamelin L, Lagarde J, Dorothée G, et al. Distinct dynamic profiles of microglial activation are associated with progression of Alzheimer's disease. Brain 2018;141(6):1855–1870. 10.1093/brain/awy079 [DOI] [PubMed] [Google Scholar]
- 88. Arlicot N, Vercouillie J, Ribeiro M‐J, et al. Initial evaluation in healthy humans of [18F]DPA‐714, a potential PET biomarker for neuroinflammation. Nucl Med Biol 2012;39(4):570–578. 10.1016/j.nucmedbio.2011.10.012 [DOI] [PubMed] [Google Scholar]
- 89. Schuitemaker A, van Berckel BN, Kropholler MA, et al. Evaluation of methods for generating parametric (R)‐[11C]PK11195 binding images. J Cereb Blood Flow Metab 2007;27(9):1603–1615. 10.1038/sj.jcbfm.9600459 [DOI] [PubMed] [Google Scholar]
- 90. Gerhard A, Schwarz J, Myers R, et al. Evolution of microglial activation in patients after ischemic stroke: a [11C](R)‐PK11195 PET study. Neuroimage 2005;24(2):591–595. 10.1016/j.neuroimage.2004.09.034 [DOI] [PubMed] [Google Scholar]
- 91. Lyoo CH, Ikawa M, Liow J‐S, et al. Cerebellum can serve As a pseudo‐reference region in Alzheimer disease to detect Neuroinflammation measured with PET Radioligand binding to translocator protein. J Nucl Med 2015;56(5):701–706. 10.2967/jnumed.114.146027 [DOI] [PMC free article] [PubMed] [Google Scholar]
- 92. Eidson LN, Kannarkat GT, Barnum CJ, et al. Candidate inflammatory biomarkers display unique relationships with alpha‐synuclein and correlate with measures of disease severity in subjects with Parkinson's disease. J Neuroinflammation 2017;14(1):164. 10.1186/s12974-017-0935-1 [DOI] [PMC free article] [PubMed] [Google Scholar]
- 93. Muñoz‐Delgado L, Macías‐García D, Jesús S, et al. Peripheral immune profile and neutrophil‐to‐lymphocyte ratio in Parkinson's disease. Mov Disord 2021;36(10):2426–2430. 10.1002/mds.28685 [DOI] [PubMed] [Google Scholar]
- 94. Yu N, Li X, Song W, et al. CD4(+)CD25 (+)CD127 (low/−) T cells: a more specific Treg population in human peripheral blood. Inflammation 2012;35(6):1773–1780. 10.1007/s10753-012-9496-8 [DOI] [PubMed] [Google Scholar]
- 95. Rocamora‐Reverte L, Melzer FL, Wurzner R, et al. The complex role of regulatory T cells in immunity and aging. Front Immunol 2020;11:616949. 10.3389/fimmu.2020.616949 [DOI] [PMC free article] [PubMed] [Google Scholar]
- 96. Dominguez‐Villar M, Hafler DA. Regulatory T cells in autoimmune disease. Nat Immunol 2018;19(7):665–673. 10.1038/s41590-018-0120-4 [DOI] [PMC free article] [PubMed] [Google Scholar]
- 97. Högl B, Stefani A, Videnovic A. Idiopathic REM sleep behaviour disorder and neurodegeneration—an update. Nat Rev Neurol 2018;14(1):40–55. 10.1038/nrneurol.2017.157 [DOI] [PubMed] [Google Scholar]
- 98. Postuma RB, Gagnon JF, Bertrand JA, et al. Parkinson risk in idiopathic REM sleep behavior disorder: preparing for neuroprotective trials. Neurology 2015;84(11):1104–1113. 10.1212/wnl.0000000000001364 [DOI] [PMC free article] [PubMed] [Google Scholar]
- 99. Stokholm MG, Iranzo A, Østergaard K, et al. Extrastriatal monoaminergic dysfunction and enhanced microglial activation in idiopathic rapid eye movement sleep behaviour disorder. Neurobiol Dis 2018;115:9–16. 10.1016/j.nbd.2018.02.017 [DOI] [PubMed] [Google Scholar]
- 100. Stokholm MG, Iranzo A, Østergaard K, et al. Assessment of neuroinflammation in patients with idiopathic rapid‐eye‐movement sleep behaviour disorder: a case‐control study. Lancet Neurol 2017;16(10):789–796. 10.1016/s1474-4422(17)30173-4 [DOI] [PubMed] [Google Scholar]
- 101. Farmen K, Nissen SK, Stokholm MG, et al. Monocyte markers correlate with immune and neuronal brain changes in REM sleep behavior disorder. Proc Natl Acad Sci U S A 2021;118(10):e2020858118. 10.1073/pnas.2020858118 [DOI] [PMC free article] [PubMed] [Google Scholar]
- 102. Zhang H, Wang T, Li Y, et al. Plasma immune markers in an idiopathic REM sleep behavior disorder cohort. Parkinsonism Relat Disord 2020;78:145–150. 10.1016/j.parkreldis.2020.07.017 [DOI] [PubMed] [Google Scholar]
Associated Data
This section collects any data citations, data availability statements, or supplementary materials included in this article.
Supplementary Materials
Data S1. Supporting Information
Table S8. Regression analysis between regional PET binding potential and clinical, cognitive, cytokine/chemokine, and immune cell phenotyping measures in the PD subjects, adjusting for TSPO genotype. Separate excel file.
Data Availability Statement
Clinical data are uploaded to the NINDS Data Management Resource. Plasma, DNA, and CSF are stored at the NINDS BioSEND repository. Additional data are available to qualified investigators on request.