Abstract
Landslides are a rare but hazardous geological phenomenon in Egypt, with the El Mokattam plateau situated in the eastern part of Cairo covering approximately 64 km2 and ranging in elevation from 50 to 205 m. This study aims to identify and monitor landslides in the area using various geophysical methods. Twelve Electrical resistivity tomography (ERT) profiles,twenty-two P-wave Seismic Refraction profiles, twenty-two Refraction microtremors profiles, three ground penetrating radar (GPR) profiles and borehole data were utilized to analyze the occurrence of landslides in the El Mokattam Plateau. Additionally, we employed a relatively new geophysical method, studying high-frequency microtremor sounds emitted from landslide collapses at 22 stations. Our analysis identified steep slopes, jointed or fractured rocks, and irrigation water as primary factors contributing to landslides, with irrigation water acting as a lubricant for clays and promoting ground sliding. Examination of high-frequency microtremor sounds revealed a potential correlation between vertical high-frequency spectra at 100 Hz and landslide collapses, which aids in the identification of landslide-prone zones. Therefore, we conclude that seismological studies, particularly spectral analysis of high-frequency and low-amplitude sounds (microtremors) emitted from soil, offer a promising approach for investigating landslides.
Keywords: Landslides, Spectrograms, High frequency, Microtremors, Seismic refraction, Remi, ERT, GPR
1. Introduction
Extensive geological studies supplemented by geophysical techniques are widely used to detect the different geological hazards. In line with this, the construction of a new cities atop rocky hills becomes an engineering challenge. It requires substantial and integrated knowledge and information about the geology, the seismic activity, and the climate of the site, as well as the present and the expected future human activities. Ignoring these factors would risk the risk that it will be subject to mass wasting. The Mokattam plateau area, eastern part of Cairo city, is characterized by numerous brittle features such as fractures, joints, faults, damage zones, voids, small caves and other dissolution-related features[[74], [75], [76],92]. Historical background demonstrate that the plateau has been the subject of many mass wasting features, such as landslides and toppling, ([29,31,52,76,103,104] and hence, from the geo-hazard perspective, the highly populated plateau is classified as a hazardous zone. The current research is the first study dealing with the rotational landslide in Mokattam Plateau, and the previous works dealt with toppling only as a mechanism of landslides. This study represents an integrated approach of the geology and geophysics. Worldwide, a similar phenomenon has been addressed [8,11,65,89,95,99,110]. The present study included integrated geological and geophysical studies to detect a set of non-tectonic curve-planar fractures and joints cutting through debris deposits, and study the sliding potential along these mega-discontinuities. Electrical Resistivity Tomography (ERT), Seismic Refraction Tomography (SRT), Multi-channel Analysis of Surface Waves (MASW), Microtremors, and Ground Penetrating Radar (GPR) are the most commonly used and robust techniques to examine the geological hazard. ERT is a very helpful shallow geophysical techniques applicable in geo-hazards (landslides, sinkholes, and cavity) detection, in groundwater exploration, mining, landfill sites investigation, and in infrastructure assessment [2,15,18,25,40,58,88,102,104,107,113,117]. It is a new method of the traditional vertical electrical sounding and gives very high resolution images of the subsurface strata vertically and horizontally [49,77] by detecting the variation in their electrical conductivity (reciprocal of resistance) [77]. SRT is a powerful tool used in rock competence detection, depth-to-bedrock investigation, groundwater exploration, seismic velocity correction, and crustal-scale structures and tectonics detection. The mechanism of the technique is based on wave refraction methods wherein the arrival times of the initial ground movement generated by a source are received by multi-stations receptors distances apart. The data is then interpreted in terms of depths to the subsurface interfaces and the speeds at which the waves travel through the subsurface layers. MASW is powerful non-destructive seismic techniques helpful in dealing with wave interferences from striatal heterogeneities [2,34,38,42,[81], [82], [83]]. This method is based on the propagation of the Rayleigh wave that travels with various velocities at different frequencies within the subsurface strata due to the heterogeneity. This phenomenon results in dispersion curve (frequency versus phase velocity), wherein using inversion and assembling several shear wave velocity profiles can deduce the shear wave velocity (1D) and construct a shear wave velocity cross section (2D). GPR is an effective shallow geophysical methods applicable for soil and hydrogeological studies, sinkhole investigation, archeology, cavity detection, groundwater contamination and bedrock mapping [3,4,6,7,10,14,20,22,96,101,108]. GPR relies upon radiating short high frequency pulses (10 MHz–1000 MHz) of electromagnetic pulse into the subsurface, the propagation of which depends on the subsurface strata's electrical properties. The conductive soils attenuate the electromagnetic energy, limiting of penetration depth of the radar signals. Because of the subsurface's heterogeneity, the radar signals are reflected at the discontinuities in the subsurface strata. [3,101]. In this context, this study aims to delineate and monitor landslides and detect the geological hazard in the area using various geophysical methods. The recorded signals are then processed and interpreted.
2. Geological setting and lithostratigraphy
Mokattam area consists geomorphologically of Middle-to Upper Eocene carbonate-dominated three plateaus at variable elevations. The upper plateau lies at the northern part of the area, and has a relatively high elevation ranging between 170 and 205 m (a. s. l), whereas the middle and lower plateaux have elevations of about 110–150 m and 50–80 m (a. s. l), respectively, [1,78]. The middle plateau, known as El-Mokattam plateau, is located east of Cairo city (Fig. 1) and covers an area of about 64 km2. Stratigraphically, Mokattam plateau consists predominantly of two sedimentary Eocene successions overlain unconformably by reworked Pliocene rocks. The lower succession, the lower unit belongs to the Middle Eocene carbonate-dominated Mokattam Formation, whereas the upper succession is clastic-dominated and belongs to the Upper Eocene Maadi Formation. The stratigraphic column of the rocks exposed at the study area is shown in (Fig. 2). Mokattam Formation is 60 m in thickness, and made up of white to yellowish white highly jointed limestone (Fig. 3). The lower part of the Maadi Formation attains a thickness of 30 m, and consists of soft marl and calystone intercalations (Fig. 4) with frequent sandstone. The upper part of Maadi Formation consists of vuggy, hard, sandy and brown dolomitic limestone (Fig. 4, Fig. 5), 10 m in thickness. This brown dolomitic limestone bed is known as Ain Musa bed, Mokattam city was built on the top of this bed where it forms the nearly flat top of El-Mokattam Plateau. The section lying between the Ain Musa Bed and the Middle Eocene limestones of Mokattam Formation includes five claystone beds [74]. Reworked Pliocene rocks, about 30 m in thickness, unconformably overlies the Eocene successions, and are represented by poorly-sorted alluvial fan deposits (debris deposits) hosting numerous reworked up to boulder size limestone fragments embedded in fine sands and clayey matrix (Fig. 5). It is the zone where numerous landslides and mass wasting have been recorded.
Fig. 1.
Location map and landsat landsat image of the highly-populated Mokattam plateau. Note the luxurious houses and compounds built on the top of the plateau.
Fig. 2.
Composite stratigraphic column of the exposed rocks in the study area.
Fig. 3.
Highly fractured yellowish white limestone of the Mokattam Formation.
Fig. 4.
The contact between the claystone and the overlying brown dolomitic limestone (Ain Musa bed) of the Maadi Formation. Note the extensive fractures which disturb the dolomitic limestone bed.
Fig. 5.
Close up view shows the poorly sorted alluvial fan deposits (debris deposits) in the study area. Note the boulder size of the reworked rock fragments and the width of the depression opening, 60 cm.
3. Field investigation of the landslides
Landslides are a naturally occurring phenomenon whose effect on the infrastructures and urban planning can be significantly devastating. Common areas prone to such phenomenon include hillsides and beachfronts. Although research concerning the engineering properties of the rock units constituting Mokattam Plateau are numerous [[74], [75], [76]] studies concerning landslides and landslide potential of the plateau are scarce. However, studies dealing with rock failure mechanism, assessment and mitigation throughout the plateau have been locally addressed [[28], [29], [30], [31],103,113]. In the strict sense, landslides refer only to mass movements where there is a distinct zone of weakness separating the downward-moving materials from the more stable underlying materials. According to the geometry of the surface of rupture, there are two major types of slides: rotational and translational [109]. Landslides, whether rotational or translational, together with rock fall, earth slump, debris flow and toppling comprise the most common categories of mass wasting that result in the downward movement of slope-forming materials under the influence of gravity [5,16,43], and differ markedly according to the kinds of material involved and the mode of movement [17,23,50,109]. In Mokatam plateau, the investigated landslide is of the rotational type with the material being moved are mainly debris deposits of a recent alluvial fan. The latter is composed of gravel, cobbles and boulders derived from the limestone of the Mokattam Formation and younger rocks. Generally, the materials of the slide are weakly cemented with a low proportion of fine grain matrix. The rupture surface has a spoon-shaped geometry (Fig. 6), with an axis of rotation that is parallel to the ground surface and transverse to the slide.
Fig. 6.
Block diagram shows the main morphologic features that associates the multiple debris rotational landslide in the study area. Note the spoon-shaped geometry of the main rupture surface.
Rotational landslides are characterized by a number of diagnostic morphologic features such as the crown, main scarp, minor scarps, tension cracks, foot and toe [17,59] (Fig. 7, Fig. 8, Fig. 9). The head of the concerned landside is followed downslope by a number of transverse minor scarps forming a stair-step pattern of the displaced blocks (Fig. 9, Fig. 10). Movement along the synthetic secondary curvi-planar rupture surfaces is responsible for the diagnostic head-ward depressions (Fig. 11). However, backward head-ward rotation of the blocks cannot ruled out [45]. The minor scarps reveal an array of multiple rotational debris landslides. In multiple rotational landslides [17,99], the movement involves sliding along multiple crescent-shaped secondary rupture surfaces (Fig. 7). The toe-ward propagation of the slide results in an overall increase of the width of the damage zone (i.e. the area to be affected by the landslides). Movement along the rupture surfaces is strongly reflected on the surface by a set of non-tectonic crescent-shaped fractures (Fig. 7, Fig. 11, Fig. 12). Some of the latters have progressed into faults with considerable displacements and associated depressions (Fig. 7, Fig. 11). Like other natural hazards, for a landslide to take place, two main factors must temporally and spatially integrate: susceptibility of the formation, and a trigger. Susceptibility is the probability that a landslide would occur in a given area based on terrain conditions without any temporal consideration [9]. It follows that future slope failure is more likely to occur under the same conditions that have triggered past and present slope failures [32]. The triggers are the external stimulus that caused the slide. Intense rainfall, rapid snowmelt, earthquake, volcanic eruption, or stream or coastal erosion are the most common triggers [17,109,117].
Fig. 7.
A well-defined main scarp developed along crescent-shaped non-tectonic minor fault with a few centimeters displacement. A well-developed 20 cm width depression developed between the two walls of the fault.
Fig. 8.
A half-meter wide tensional cracks developed in the debris deposits, and exhibits no vertical displacement.
Fig. 9.
Minor scarps developed by minor displacements along a stair-step patterned fractures.
Fig. 10.
A sketch shows the schematic evolution of multiple rotational landslides with well-developed depressions [99].
Fig. 11.
A well-defined crescent-shaped fracture and the associated half a meter depression. The meter-scale blocks (indicated by arrows) within the depression are indicative of the activity of the slide.
Fig. 12.
A Landsat image shows a set of crescent-shaped NNE-SSW to N–S-trending fractures very close and almost parallel to the western bank of Ain Musa spring.
Generally, the triggers initiate slope failure through increasing the shear stresses or reducing the shear strength of the slope materials (e.g. Ref. [117]. In a specific area, inherited geologic conditions of a rock mass such as steep slopes, joints, presence of a lubricating materials as the clay or shale play a crucial role in the initiation and recurrence of a landslide [45]. The rotational landslides in Mokattam area are triggered by the ground water erosion as well as the lubrication effect of clay. The source of the ground water in the area is represented by Ain Musa natural spring whose narrow course flows at the foot of the investigated landslide (Fig. 12). Along its banks, the ground water erodes the soft clay (or marl) of the lower unit of the Maadi Formation, that acts as a support for the overlying brown limestone unit on which the alluvial fan debris deposits rests. Withdrawal of the soft clay unit and removal of the underlying supporting layer at the foot of the slope is most likely the main trigger of the slide. Moreover, the ground water of Ain Musa penetrates the rock and weakens the binding strength between individual mineral grains of the basal clay, which acts as a slippery surface that promotes downslope movement of materials and failure. Successive sliding of the overlying brown limestone bed and the overlying debris fan deposits along the basal clayey unit caused the multiple rotational landslides. Whether a landslide is active or inactive depends greatly on the change in the morphological features (main scarp, minor scarps, depressions, etc.) demonstrated by a landslide with time [49]. The latter authors proposed seven states of activity for rotational landslides: active, suspended, reactivated, dormant, abandoned, stabilized and relict. In the investigated landslide, the morphological features are sharply defined and distinct and hence represent an active to recently active landslide. The latter conclusion classifies Mokattam area a hazardous zone that represents a real threat to human life and infrastructures.
In fact, the reported crescentic cracks on top of the slope in the study area are a warning alarm for initiation of a slope failure (landslide). The hazard can be chiefly avoided through a perfect site selection for all the types of constructions. The selection should be preceded by a preliminary and a comprehensive study of the surface and subsurface geology, and consequently should not target the landslide-prone areas. For highly populated sites, like the case we have, landslide mitigation is the sole solution. This involves avoiding construction on steep slopes and on existing landslides, draining ground water away from the landslide, using the advanced irrigation techniques, and avoiding and/or minimizing surface leakage from swimming pools and water resources.
4. The Borehole data
The study area is a steep slope area as mentioned in the geological study (Fig. 13). Borehole cross section A-A’ (Fig. 13) suggests that there are three layers arranged from up to down as follows; fossiliferous limestone, crushed limestone with clay, and silty clay (Fig. 14).
Fig. 13.
3D map showing the elevation difference in the study area, locations of the landslides area and cracks and also the locations of the Boreholes cross section A-A’.
Fig. 14.
Geological cross-section for Line A-A′ described in Fig. 16 from the available boreholes. The cross section is showing top layer of weak fossiliferous L.S followed by crushed L.S and ends with silty clay.
5. Methodology
The following flowchart described the different geophysics methods/techniques employed in the study area (Fig. 15).
Fig. 15.

Flowchart showed the methodological applied in the study area.
5.1. Ground penetrating radar survey
Three GPR profiles were taken on three different levels of the study area to show the landslides damages in the subsurface (Fig. 16). Main antennas 450 MHz and 110 MHz were deployed for two-way time of about 80 ns and 280 ns respectively. The velocity is 0.1 m/ns that give depths 5m and 15 m. The band-pass filter and the Dewow filter were applied to the GPR raw data.
Fig. 16.
Base map of the study area showing electrical resistivity tomography profiles, ground penetrating radar profiles, seismic refraction, ReMi profiles, and microtremors stations.
5.2. Electrical resistivity tomography survey (ERT)
Twelve ERT profiles were distributed in the study area (Fig. 16). The diploe-diploe array was deployed with 28 electrodes cable, with different electrodes spacing, based on the availability of space in the site. In this context, the total profiles lengths are ranges from 170 m, 108 m, 81 m, 54 m and 32 m. A total of 252 data points were taken for each profile. The data points were arranged over different depths as to cover the entire depth.
5.3. Seismic Refraction Tomography (SRT)
Twenty-two seismic profiles were acquired for the study area (Fig. 16) by using 12 receivers, 14 Hz P-wave type, geophones spacing is 5 m and shoot five shots times. The shot locations used are forward, reverses, split/central, offset forward and offset reverse. The external shots were taken at 35m distance from both ends of the seismic line (Fig. 17).The seismic source used was a 10 kg sledgehammer.
Fig. 17.
Seismic data acquisition for P-wave seismic velocity using the 14Hz geophones and 10 kg sledgehammer taken in the sliding area at the eastern part of the study area.
5.4. Multichannel analysis surface wave (MASW)
The same locations of P-wave seismic refraction profiles were used to determine the variation of shear wave seismic velocity with depth using ReMi technique [69,90]. ReMi method uses the background ‘noise’ to determine the shear wave seismic velocity. The method is based on spectral analysis of Rayleigh-wave velocity. A time-domain velocity analysis is applied to separate the Rayleigh waves from body waves and other coherent noise. The method transforms the time-domain velocity results into the frequency domain and traces the arrivals over a long period of time allowing for easy recognition of dispersive surface waves. This dispersion is displayed in p-f space where dispersion curve picks can be made.
5.5. Using high quality sound spectrograms as an early warning systems for landslides collapses for EL Mokattam plateau
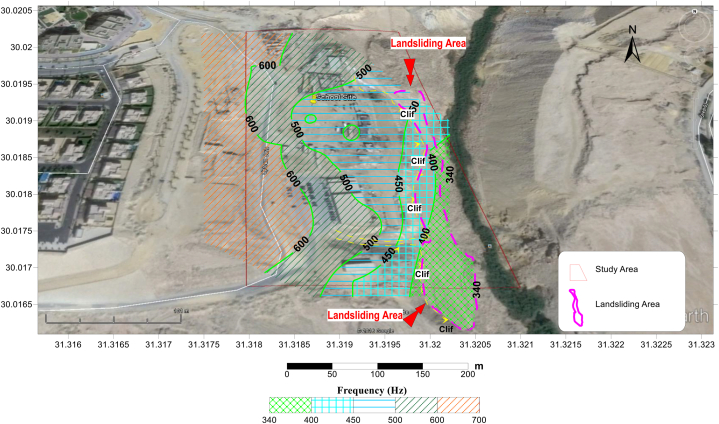
Twenty-two microtremors stations were collected to study how the soil spectrum is affected due to the sliding process that occurs in EL Mokattam Plateau (Fig. 18). A triaxial geophone was deployed to collect microtremors samples (Fig. 19). Each recorded sample was about 90 s, 500 sample/second in the vertical, north-south and east-west directions. The sound wave spectrum is varying over time so need to represent that; for that a graphical representation in three dimensions (frequency, time, and amplitude of sounds) is called spectrogram is used in this study. Sometimes scientists call it sonographs, voiceprints or voicegrams and is usually used in the analysis of sound. The spectrogram plot is composed from sequence of spectra by stacking them together in time, always time on the x-axis, frequency on the y-axis and amount of energy increase (Power frequency) is displayed from cold color (like blue) to hot color (like red). Spectrograms provide a standard, powerful technique for analyzing the frequency content of sound recordings as well as seismograms. Spectrograms for the sliding area which is composed of crushed clayey limestone are showed very different effects than those taken over relatively stable areas which is composed of fossiliferous limestone.
Fig. 18.
Maximum resonance pitches obtained for the study area using three components microtremors stations showing good separation for the sliding area with the highest resonance frequency between 100 and 110 Hz.
Fig. 19.
Triaxial geophone 4Hz was used to collect microtremors data in this study.
6. Results
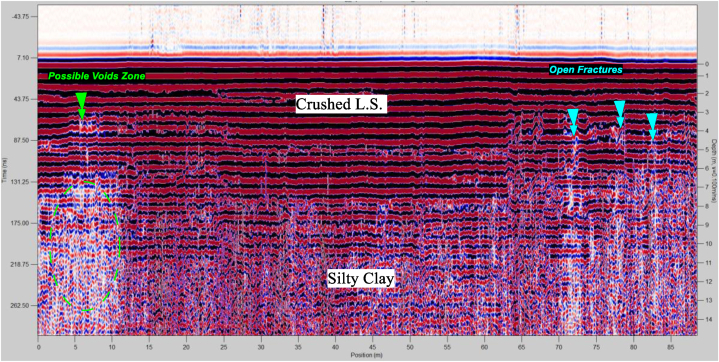
In this context, we will display the results which obtained from geophysical work. The radargram will be able to show different geologic features such as the vertical fractions in subsurface, damaged zones, and differentiated between stronger fossiliferous limestone and weaker crushed limestone layers. The ground penetrating radar profile GPR1 (Fig. 20) was taken over the highest plateau of the studied area which revealed that the upper 5 m is full of vertical fractures as can be seen from the exposed rocks (Fig. 21). Profile GPR2 which was taken over the middle plateau in the study area showed how the relatively weaker silty clay and crushed L.S. (Fig. 22). Profile GPR3 was taken over the lowest level of the plateau where the landslides process occurs (Fig. 23).
Fig. 20.
Shallow Radargram GPR1 extended for about 4m depth using 450 MHz Pulse EKKO GPR, showing limestone layer full of vertical fractures (GPR1).
Fig. 21.
An example vertical fractures and Altered L.S found at EL Mokatam Plateau.
Fig. 22.
Profile GPR2 showed the relatively stronger Fossiliferous L.S. underlain by weaker silty clay mixed with crushed L.S. Note the existence of vertical fractures and damaged zones.
Fig. 23.
Profile GPR3 showed relatively stronger crushed L.S. underlain by relatively weaker silty clay. Note the existence of some separated zones most probably due to the vertical fractures, and voids.
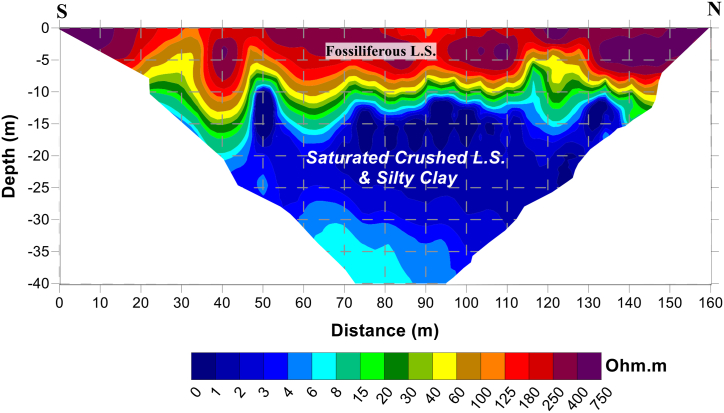
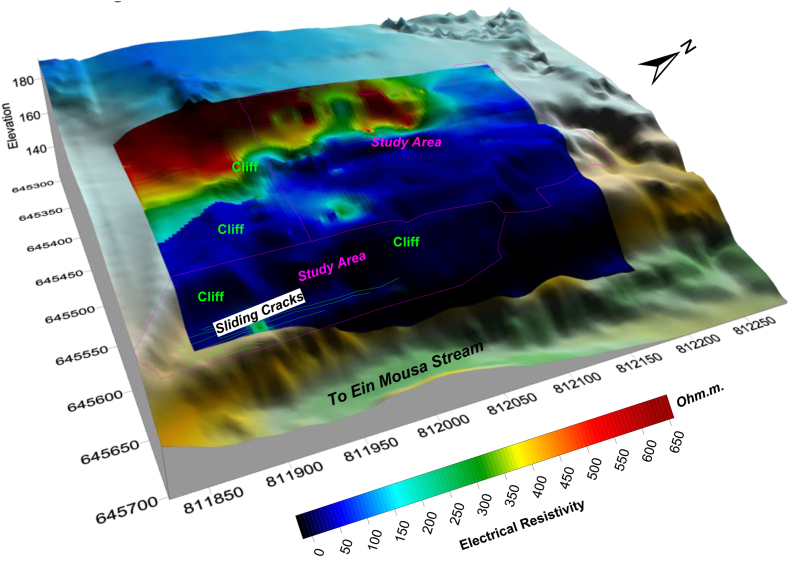
From entire electric resistivity profiles (Fig. 16), 2D resistivity images were done (Fig. 24) for each site [67]. Also produced a contour map of the average resistivity and then overlain on 3D elevation map to show the effect of the variation of true electrical resistivity with the entire area and slope. 2D resistivity images were done (Fig. 25) for each site [67].
Fig. 24.
Electrical resistivity tomography inversion model for profile E2 (Fig. 16). Most of the profile show very low resistivity range <4 Ohm.m especially after 10 m depth for crushed Limestone rock with Clay intercalations most probably due to saline irrigation coming from irrigation water in higher lands.
Fig. 25.
3D plot showed the variation of average electrical resistivity with slope obtained from ERT method [67] for about 30m depth for all 12 profiles described in Fig. 16, showed nearly the entire site is saturated with brackish water due to drainage of irrigation water of about 1–25 Ohm.m. While the highest electrical resistivity is about 650 Ω m at the Western part of the study area which is the highest part.
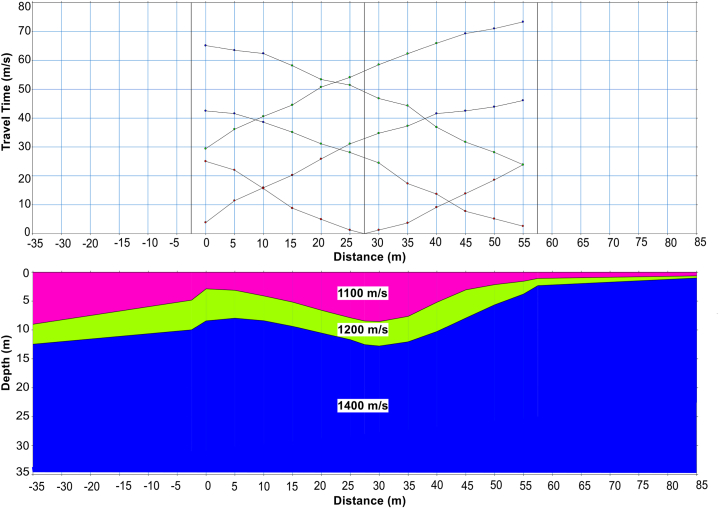
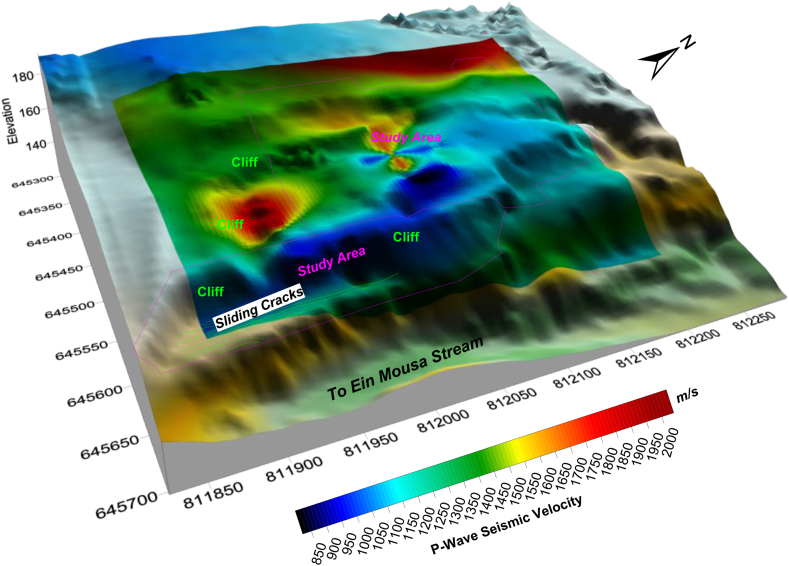
The seismic refraction data was picked and the GRM method was used to make the final models [80] (Fig. 26, Fig. 27). The entire seismic data (Fig. 16) was used to produce a contour map of the average P-wave seismic velocity, then overlain on 3D elevation map to show the effect of the variation of P-wave seismic velocity with the entire area and slope (Fig. 28).
Fig. 26.
Example of recorded seismograms for [A] forward, [B] Reverse, [C] split/central and [D] external shot taken for each seismic profile for El Mokattam plateau seismic survey.
Fig. 27.
Travel Time curve and its corresponding Geoseismic model for Profile #S8.
Fig. 28.
Average P-wave seismic velocity obtained from seismic refraction profiles for about 20–30 m depth for all 22 profiles described in Fig. 16, showed the lowest P-wave seismic velocity is 850 m/s at the sliding zone in the Eastern part. While the highest P-wave seismic velocity is about 2000 m/s at the Western part of the study area.
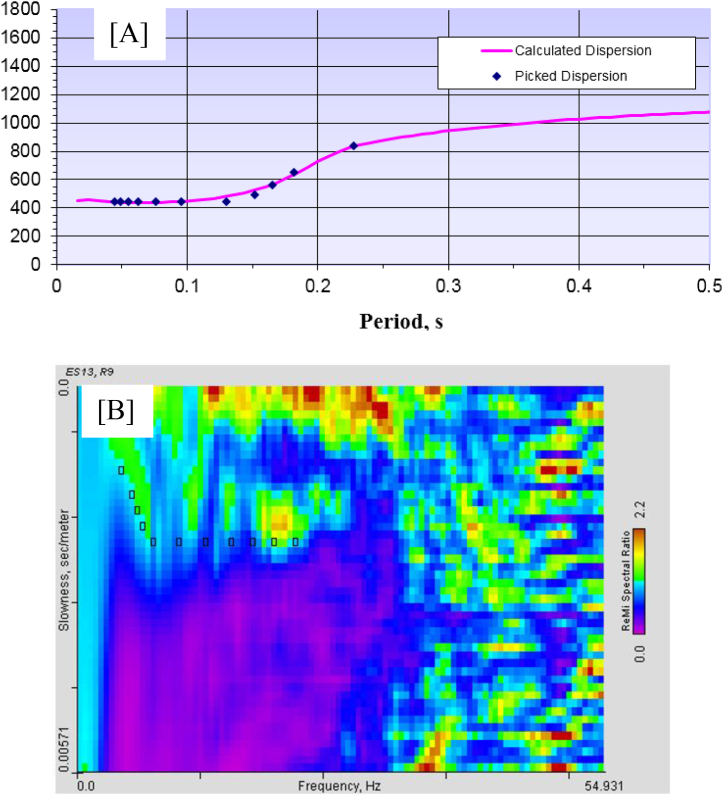
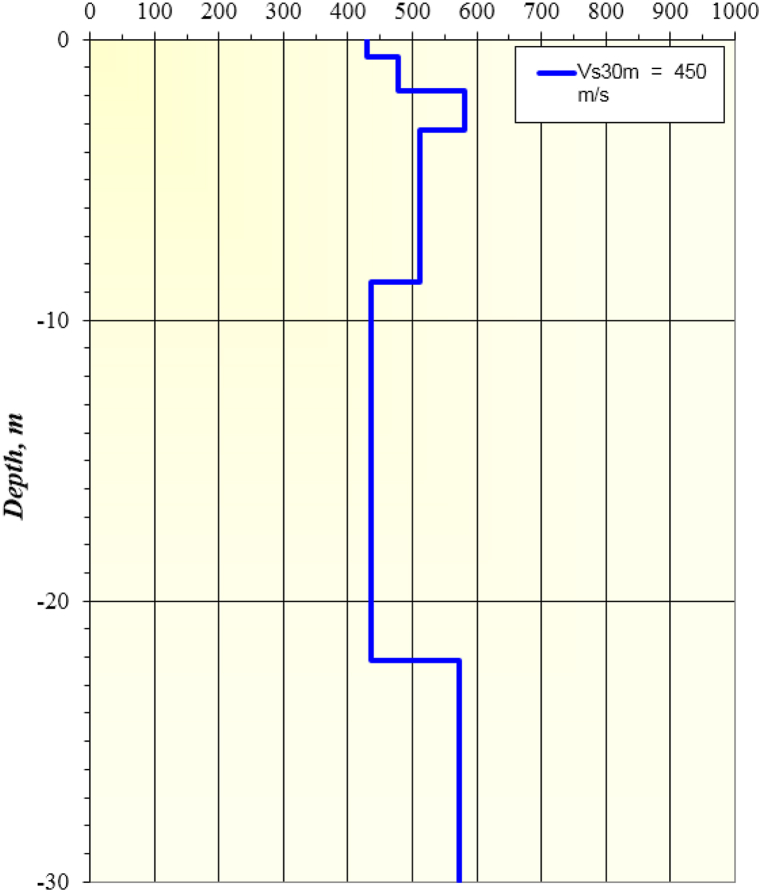
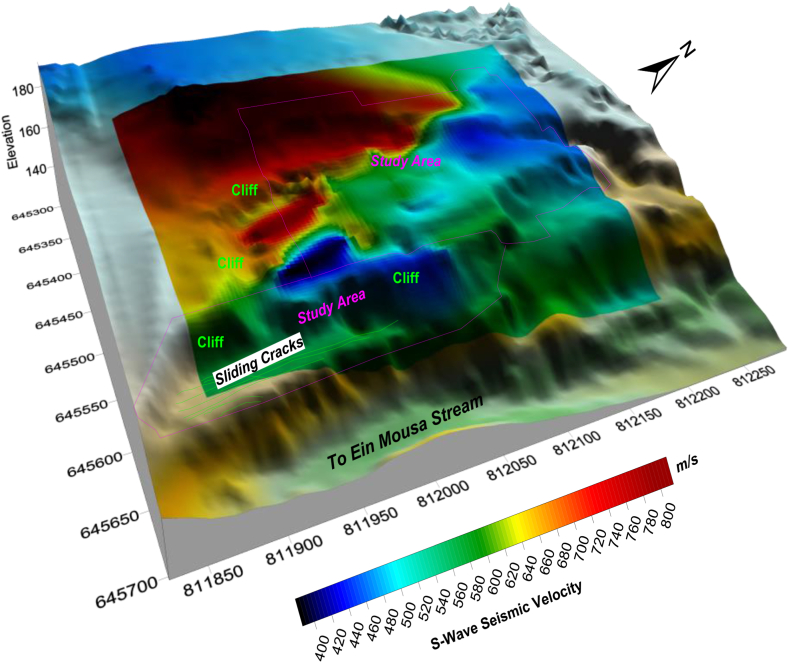
In ReMi technique the dispersion curve was picked which used to determine the variation of shear wave velocities with depth (Fig. 29A and B). The recorded ‘Noises in this study are about 20 files X, 20 s. The success of the ReMi method mainly depend on the high noises at each site. Almost all the sites were noisy, with noise coming from construction machines and cars. The ReMi analysis presented here was developed from 12 geophones array (14 Hz). Again the entire S-wave seismic data (Fig. 16) were used to produce a contour map of the average S-wave seismic velocity, then overlain on 3D elevation map to show the effect of the variation of S-wave seismic velocity with the entire area and slope (Fig. 30). The average shear wave velocity VS30 was calculated for the entire area using NBCC code (Fig. 31, Fig. 32).
Fig. 29.
[A] Dispersion curve showed picks and Fit, [B] p-f image with dispersion modeling picks for shear wave seismic profile S13.
Fig. 30.
Shear wave velocity model calculated for ReMi Profile S13 (please refer to Fig. 16 for profile location).
Fig. 31.
Average S-wave seismic velocity obtained from ReMi method for about 30m depth for all 22 profiles described in Fig. 16, showed the lowest S-wave seismic velocity is between 400 and 580 m/s at the sliding zone. While the highest S-wave seismic velocity is about 800 m/s at the western part of the study area.
Fig. 32.
Map showed the distribution of VS30 for the sliding area and its surroundings.
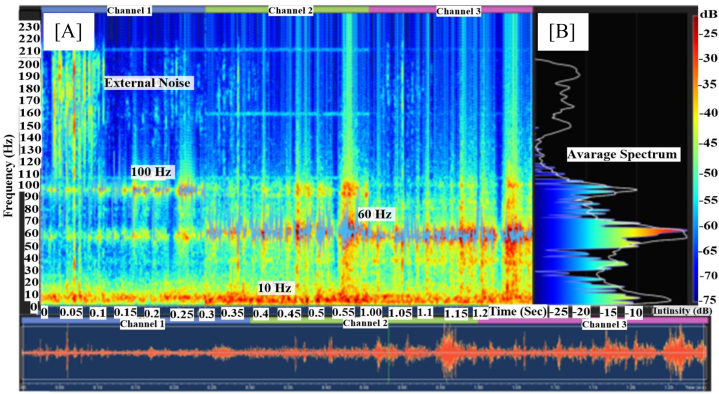
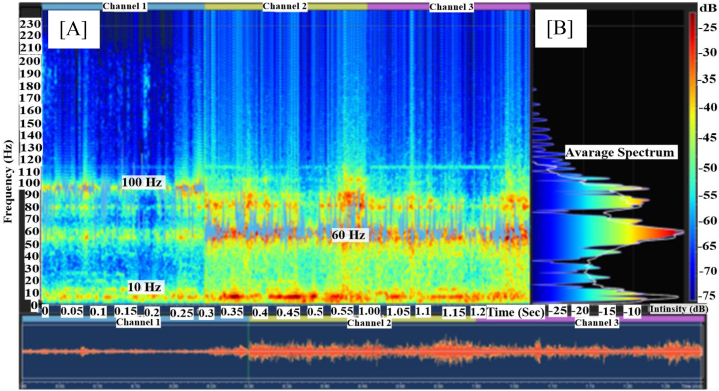
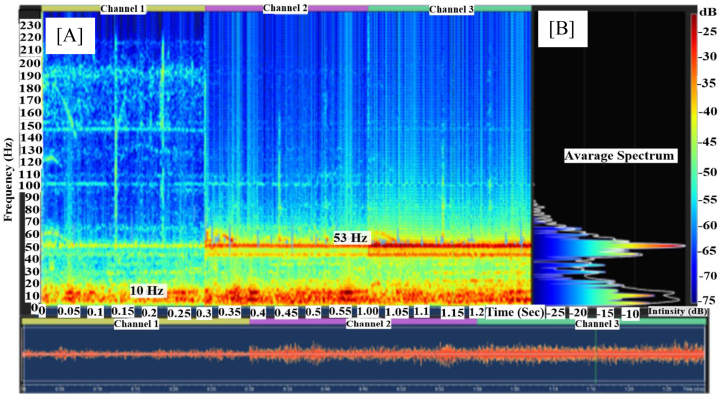
The Fast Fourier Transform technique (FFT), is the simplest way used by scientist to convert the signal data of microtremors from time domain (time versus amplitude) into frequency domain (frequency versus amplitude). In sliding area, when calculated the spectrograms both horizontal components (channel 2 and 3, Fig. 33, Fig. 34A, B) are showed two fundamental resonance frequencies at 10Hz and 60Hz, while the vertical component (channel 1) is showed a high resonance pitch at about 100 Hz. The landslides area is characterized by the increase in the number of resonance pitches and sound energy especially in the vertical component. The relatively stable areas composed of stable fossiliferous limestone are showed only two resonance pitches at 10 Hz and 50 Hz in the horizontal components with negligible effect in the vertical component at which sliding occurs (Fig. 35A and B). Another very important notice is that the overall energy is higher in the sliding areas more than in the stable non sliding area, especially in the vertical component. Field observations showed that, the sliding area fits very well with the resonance frequency range of 100–110 Hz obtained from the spectral analysis study. Therefore the obtained spectrograms are considered as the most accurate and successful geophysical method that can be used as an early warning system for landslides processes.
Fig. 33.
Spectrogram taken over the sliding area (S11 Fig. 18) showed a three resonance peaks at 10 Hz, 60 Hz and 100 Hz. [A] Spectrogram for sliding crushed clayey limestone and relatively high sound energy about 15 dB. [B] The corresponding average Fourier spectrum.
Fig. 34.
Spectrogram taken over the sliding area (S7 Fig. 18 showed a three resonance peaks at 10 Hz, 60 Hz and 100 Hz. [A] Spectrogram for sliding crushed clayey limestone and relatively high sound energy in dB at 60 Hz and 100 Hz.[B] the corresponding average Fourier spectrum.
Fig. 35.
Spectrogram taken over the Stable non-sliding area (S4 Fig. 18) showed two resonance peaks 10 Hz, 53 Hz. [A] Spectrogram for stable fossiliferous. [B] the corresponding Fourier spectrum.
7. Discussion
In this section, we discussed and interpreted the results obtained from employed the different geophysical methods. GPR sections are successful to detect lithology. Radargram provided 2D image for subsurface structures included the vertical fractions, voids zones and distinguished between the crushed limestone and weaker silty clay. ERT profiles were indicated the entire area is affected by irrigation water coming from the relatively higher lands that the electrical resistivity was ranged from between 1 and 25 Ohm.m, while the only part which is did not affected by water is the highest plateau in the western area which show electrical resistivity reached up to 650 Ohm.m. From SRT data, the lowest P-wave seismic velocity was found to be 850 m/s at the sliding zone in the eastern part. While the highest P-wave seismic velocity was found to be about 2000 m/s at the western part of the study area. The lowest S-wave seismic velocity was found to be between 400 and 580 m/s at the sliding zone. While the highest S-wave seismic velocity is about 800 m/s at the western part of the study area. When calculated the Vs30 value we found it was ranged from 350 to 450 m/s in the sliding area which is described by seismic regulations for new buildings [72] as very dense soil or soft rock. While the Vs30 value was ranged from 600 to 700 m/s at the western part of the study area. This result is not giving the effect of the sliding nor any of the above applied geophysical methods. Spectrogram was gave higher frequency reach up to 100 Hz in the sliding area whereas in stable non-sliding area reach up to 53 Hz.
8. Conclusion
Integrated geophysical study 12 electrical resistivity tomography (ERT) profiles, 22 P-wave seismic refraction profiles, 22 refraction microtremors profiles, 3 ground penetrating radar (GPR) profiles and borehole data were employed to describe the landslides in the EL Mokattam Plateau. Another relatively new geophysical approach was used, which is the study of high frequency microtremos sounds emitted from the landslides collapses for 22 stations. All geophysical techniques concluded some important findings. GPR study showed subsurface is very heterogeneous with lots of weak friable crushed limestone zones and vertical fractures especially in the central part of the study area. At the sliding zone, the GPR lots of vertical open fractures and possible void zones. The average electrical resistivity showed that most of the sloping area is a low resistivity areas comprise low resistivity zones (1–25 Ohm.m). This is most probably due to saturation of the sloping area with brackish water coming from irrigation water in the upper lands. The higher lands are relatively dry with electrical resistivity of about 650 Ω m. No sharp line can be detected from the electrical resistivity study between the sliding and non-sliding areas.
The average P-wave and S-wave seismic velocities are relatively low in the sliding area (about 850 m/s and 400 m/s respectively), whereas the uppermost part of the study area in the western part reach up to 2000 m/s and 800 m/s. Again, the average seismic velocities the exact areas at which sliding are occurring. The study of Vs30 calculated from the ReMi method is relatively a good method for determining the line between sliding and non-sliding zones. The Vs30 between 340 and 400 m/s the sliding area. The only drawback of this method is that this shear wave will change with the change of the sliding area and cannot be taken as constant reference velocity for sliding.
However, Microtremors resonance method can be considered as the best method that can be used to give spectral analysis for different parts of the soil and detect sliding zones. Sliding zones showed a big change in the amount of energy and also the number of resonance peaks in the sliding zones. This is most probably because of sound trapping and magnified in the vertical fractures and voids which are abundant in the sliding zones or due to increased microtremors emitted from the sliding process itself. Field observations showed that, the sliding area fits very well with the resonance frequency range 100–110 Hz obtained from the spectral analysis study. For that, the obtained spectrograms can be considered as the most accurate and successful geophysical approach that can be used as an early warning system for landslides processes.
Data availability statement
The data that has been used is confidential, cannot sharing.
Additional information
No additional information is available for this paper.
CRediT authorship contribution statement
Mohamed A. Gamal: Writing – review & editing, Writing – original draft, Resources, Project administration, Methodology, Funding acquisition. Mohamed Abdelfattah: Writing – review & editing, Validation, Resources, Project administration. George Maher: Writing – review & editing, Writing – original draft, Software, Methodology, Investigation, Funding acquisition.
Declaration of competing interest
The authors declare that they have no known competing financial interests or personal relationships that could have appeared to influence the work reported in this paper.
Contributor Information
Mohamed A. Gamal, Email: magamal@sci.cu.edu.eg.
Mohamed Abdelfattah, Email: Fattahshad@yahoo.com.
George Maher, Email: georgemaher55@yahoo.com, georgemaher55@cu.edu.eg.
References
- 1.Ahmed E., Ahmed M.S., Ali E.O. Geoengineering characteristics modeling of Eocene limestone beds of the upper plateau of mokattam area, Egypt using GIS techniques. Environ. Earth Sci. 2022;81:81. [Google Scholar]
- 2.Al-Heety E.A., Mohammad O.J. The reliance of the earthquake B-value on depth and focal mechanism. The Iraqi Geological Journal. 2021:1–10. [Google Scholar]
- 3.Alvin K. Applications of ground penetrating radar in assessing some geological hazards: examples of groundwater contamination, faults, cavities. J. Appl. Geophys. 1995;33:177–193. [Google Scholar]
- 4.Annan A.P., Davis J.L. Impulse radar sounding in permafrost. Radio Sci. 1976;11(4):383–394. [Google Scholar]
- 5.Bates R.L., Jackson J.A. third ed. American geological institute; Alexandria: 1987. Glossary of Geology; p. 788pp. [Google Scholar]
- 6.Benson R., La Fountain L. Evaluation of subsidence or collapse potential due to subsurface cavities. Proc. 1st interdisciplinary Symposium on sinkholes, Orlando. 1984:201–215. [Google Scholar]
- 7.Beres Jr.M., Haeni F.P. Application of ground‐penetrating‐radar methods in hydrogeologie studies. Groundwater. 1991;29(3):375–386. [Google Scholar]
- 8.Bichler A., Bobrowsky P., Best M., Douma M., Hunter J., Calvert T., Burns R. Three-dimensional mapping of a landslide using a multi-geophysical approach: the Quesnel Forks landslide. Landslide. 2004;1:29–40. [Google Scholar]
- 9.Brabb E.E. Proceedings 4th International Symposium on Landslides. Canadian Geotechnical Society; Toronto, ON, Canada: 1984. Innovative approaches to landslide hazard and risk mapping; pp. 307–324. [Google Scholar]
- 10.Cagnoli B., Ulrych T.J. Singular value decomposition and wavy reflections in ground-penetrating radar images of base surge deposits. J. Appl. Geophys. 2001;48(3):175–182. [Google Scholar]
- 11.Carpentier S., Konz M., Fischer R., Anagnostopoulos G., Meusburger K., Schoeck K. Geophysical imaging of shallow subsurface topography and its implication for shallow landslide susceptibility in the Urseren Valley, Switzerland. J. Appl. Geophys. 2012;83:46–56. [Google Scholar]
- 14.Cook J.C. Radar transparencies of mine and tunnel rocks. Geophysics. 1975;40(5):865–885. [Google Scholar]
- 15.Crawford M.M., Bryson L.S. Assessment of active landslides using field electrical measurements. Eng. Geol. 2018;233:146–159. [Google Scholar]
- 16.Cruden D.M. A simple definition of a landslide. Bulletin of the International Association of Engineering Geology - Bulletin de l’Association Internationale de Géologie de l’Ingénieur. 1991;43:27–29. [Google Scholar]
- 17.Cruden D.M., Varnes D.J. In: Landslides-Investigation and Mitigation: Transportation Research Board, Special Report No. 247. Turner A. Keith, Schuster Robert L., editors. National Research Council, National Academy Press; Washington, D.C.: 1996. Landslide types and processes; pp. 36–75. [Google Scholar]
- 18.Dahlin T., Owen R. 4th Meeting Environmental and Engineering Geophysics. 1998, September. Geophysical investigation of alluvial aquifer in Zimbabwe, Procs; pp. 14–17. Barcelona, Spain. [Google Scholar]
- 20.Davis J.L., Annan A.P. Ground‐penetrating radar for high‐resolution mapping of soil and rock stratigraphy 1. Geophys. Prospect. 1989;37(5):531–551. [Google Scholar]
- 22.Dentith M., O'Neill A., Clark D. Ground penetrating radar as a means of studying palaeofault scarps in a deeply weathered terrain, southwestern Western Australia. J. Appl. Geophys. 2010;72(2):92–101. [Google Scholar]
- 23.Dikau R., Brunsden D., Schrott L., Ibsen M.L., editors. vol. 1996. Wiley; New York: 1996. p. 210p. (Landslide Recognition: Identification, Movement, and Causes). [Google Scholar]
- 25.Drahor M.G., Göktürkler G., Berge M.A., Kurtulmuş T.Ö. Application of electrical resistivity tomography technique for investigation of landslides: a case from Turkey. Environmental Geology. 2006;50(2):147–155. [Google Scholar]
- 28.EGSMA. (Geological Survey of Egypt) 1996. Engineering Geological Report on Mokattam Upper Hill. [Google Scholar]
- 29.Elleboudy A.M. Proc. Of 11 Th. Int. Conf. On SMFE; San Francisco: 1985. Analysis of Mokattam rock falls; pp. 2321–2324. [Google Scholar]
- 30.El-Sohby M.A., Elleboudy A.M., Aboushook M. 9th African Regional Conference of ISSMFE, Lagos. 1987. Swelling and shear strength characteristics of Mokattam shale; pp. 143–146. [Google Scholar]
- 31.El- Sohby M.A., Elleboudy A.M. Instability of natural slope in interbedded limestone and shale. Proc. Of 15th Int. Symp. On Landslides. 1988:121–123. Lausanne. [Google Scholar]
- 32.Fell R., Corominas J., Bonnard C., Cascini L., Leroi E., Savage W.Z. Guidelines for landslide susceptibility, hazard and risk zoning for land-use planning. Eng. Geol. 2008;102:85–98. [Google Scholar]
- 34.Foti S., Parolai S., Albarello D., Picozzi M. Application of surface wave methods for seismic site characterization. Surv. Geophys. 2011;32(6):777–825. [Google Scholar]
- 38.Gamal M.A., Elhussein M. Microseismic zonation maps for Egypt using shear wave velocity (Vs 30), and standard penetration resistance value (N30) Bull. Eng. Geol. Environ. 2021;80(8):6473–6495. [Google Scholar]
- 40.Gance J., Malet J.P., Supper R., Sailhac P., Ottowitz D., Jochum B. Permanent electrical resistivity measurements for monitoring water circulation in clayey landslides. J. Appl. Geophys. 2016;126:98–115. [Google Scholar]
- 42.Geraldine A., Amin k, Abduallah K. Evaluating the effectiveness of the MASW technique in geologically complex terrain. J. Phys. Conf. 2018;995(1) [Google Scholar]
- 43.Glade T., Crozier M. In: Landslide Hazard and Risk. Glade T., Anderson M., Crozier M., editors. John Wiley and Sons Ltd.; West Sussex: 2005. The nature of landslide hazard impact; pp. 43–74. [Google Scholar]
- 45.Hansen M.C. Ohio Department of Natural Resources Division of Geological Survey; 1995. Geofacts. No. 8. [Google Scholar]
- 49.Hung Y., Chou H., Lin C. Appraisal of the spatial resolution of 2D electrical resistivity tomography for geotechnical investigation. Appl. Sci. 2020;10:4394. [Google Scholar]
- 50.Hungr O., Leroueil S., Picarelli L. The Varnes classification of landslide types, an update. Landslides. 2014;11:167–194. [Google Scholar]
- 52.Jaher A.A., Mashhour I.M., Akl S.A., Amer M. Stability improvement against toppling failure in the upper plateau of gebel mokattam. Geotech. Geol. Eng. 2023 [Google Scholar]
- 58.Lapenna V., Lorenzo P., Perrone A., Piscitelli S., Sdao F., Rizzo E. High-resolution geoelectrical tomographies in the study of Giarrossa landslide (southern Italy) Bull. Eng. Geol. Environ. 2003;62(3):259–268. [Google Scholar]
- 59.Lee E.M., Jones D.K.C. Thomas Telford; London: 2004. Landslide Risk Assessment. [Google Scholar]
- 65.Lissak C., Maquaire O., Malet J., Lavigne F., Virmoux C., Gomez C., Davidson R. Ground-penetrating radar observations for estimating the vertical displacement of rotational landslides. Nat. Hazards Earth Syst. Sci. 2015;15:1399–1406. [Google Scholar]
- 67.Loke M.H., Barker R.D. Rapid least‐squares inversion of apparent resistivity pseudosections by a quasi‐Newton method1. Geophys. Prospect. 1996;44(1):131–152. [Google Scholar]
- 69.Louie J.N. Faster, Better: shear-wave velocity to 100 meters depth from refraction microtremor arrays. Bull. Seismol. Soc. Am. 2001;91:347–364. [Google Scholar]
- 72.Miyakoshi K., Kagawa T., Kinoshita S. Estimation of geological structures under the Kobe area using the array recordings of microtremors. 2nd International Symposium on the Effect of Surface Geology on Seismic Motion. 1998;2:691–696. Yokohama, Japan. [Google Scholar]
- 74.Moustafa A.R., Yehia A., Abdel Twaab S. Structural setting of the area east Cairo, Maadi and helwan, Middle East research center, Ain shams university. Sci. Res. 1985;5:40–64. [Google Scholar]
- 75.Moustafa A.R., Abdel Twaab S. Morphostructures and nontectonic of gabel mokattam, Middle East research center, Ain shams uni. Sci. Res. 1985;5:p68–p78. [Google Scholar]
- 76.Moustafa A.R., El-Nahhas F., Abdel Twaab S. Engineering geology of Mokattam city and vicinity, eastern Greater Cairo, Egypt. Eng. Geol. 1991;31:327–344. [Google Scholar]
- 77.Muhammad H., Yanjun S., Peng S. Application of electrical resistivity tomography (ERT) for rock mass quality evaluation nature portfolio. Sci. Rep. 2021;11 doi: 10.1038/s41598-021-03217-8. [DOI] [PMC free article] [PubMed] [Google Scholar]
- 78.NARSS . 1997. National Authority for Remote Sensing and Space Sciences. [Google Scholar]
- 80.Palmer D. Society of Exploration Geophysicists (SEG); 1980. The Generalized Reciprocal Method of Seismic Refraction Interpretation; p. 113. [Google Scholar]
- 81.Park C.B., Miller R.D., Xia J. Multichannel analysis of surface waves. Geophysics. 1999;64(3):800–808. [Google Scholar]
- 82.Park C.B., Shawver J.B. Symposium on the Application of Geophysics to Engineering and Environmental Problems 2009. Society of Exploration Geophysicists; 2009, March. MASW survey using multiple source offsets; pp. 15–19. [Google Scholar]
- 83.Park C.B., Miller R.D. Site Characterization and Modeling. 2005. Multichannel analysis of passive surface waves–modeling and processing schemes; pp. 1–14. [Google Scholar]
- 88.Perrone D., Sullivan C.J., Pratt T.C., Margaryan S. Parental efficacy, self-control, and delinquency: a test of a general theory of crime on a nationally representative sample of youth. Int. J. Offender Ther. Comp. Criminol. 2004;48(3):298–312. doi: 10.1177/0306624X03262513. [DOI] [PubMed] [Google Scholar]
- 89.Pratiwi E.S., Sartohadi J., Wahyudi Geoelectrical prediction for sliding plane layers of rotational landslide at the volcanic transitional landscapes in Indonesia. Earth and Environmental Science. 2019;286 [Google Scholar]
- 90.Pullammanappallil S., Honjas B., Louie J., Siemens J.A., Miura H. Proceedings of the 6th SEGJ International Symposium (January 2003, Tokyo) 2003. Comparative study of the refraction microtremor method: using seismic noise and standard P-wave refraction equipment for deriving 1D shear-wave profiles; pp. 192–197. [Google Scholar]
- 92.Said R. Elsevier; 1962. The Geology of Egypt; p. 377pp. [Google Scholar]
- 95.Santoso B., Hasanah M.U., Setianto Landslide investigation using self-potential method and electrical resistivity tomography (Pasanggrahan, South Sumedang, Indonesia) Earth and Environmental Science. 2019;311 [Google Scholar]
- 96.Scaife J.E., Annan A.P. 93rd CIM Annual General Meeting. 1991, April. Ground penetrating radar—a powerful, high resolution tool for mining engineering and environmental problems. Vancouver, BC. [Google Scholar]
- 99.Shuyue M., Haijun Q., Yaru Z., Dongdong Y., Bingzhe T., Daozheng W., Luyao W., Mingming C. Topographic changes, surface deformation and movement process before, during and after a rotational landslide. Rem. Sens. 2023;15:662. [Google Scholar]
- 101.Sonkamble S., Chandra S. GPR for earth and environmental applications: case studies from India. J. Appl. Geophys. 2021;193 [Google Scholar]
- 102.Soupios P.M., Georgakopoulos P., Papadopoulos N., Saltas V., Andreadakis A., Vallianatos F., Makris J.P. Use of engineering geophysics to investigate a site for a building foundation. J. Geophys. Eng. 2007;4(1):94–103. [Google Scholar]
- 103.Sultan A.S. Geophysical investigation for shallow subsurface geotechnical problems of Mokattam area, Cairo, Egypt. Environ. Earth Sci. 2010;59:1195–1207. [Google Scholar]
- 104.Sultan A.S., Gobashy M.M., Mohamed M., Khalil H., Abdelaal A. Integration of geophysical techniques to detect geotechnical hazards: a case study in Mokattam, Cairo, Egypt. Bull. Eng. Geol. Environ. 2021;80(3):3. [Google Scholar]
- 107.Uhlemann S., Wilkinson P.B., Maurer H., Wagner F.M., Johnson T.C., Chambers J.E. Optimized survey design for electrical resistivity tomography: combined optimization of measurement configuration and electrode placement. Geophys. J. Int. 2018;214(1):108–121. [Google Scholar]
- 108.Ulriksen C. Univ. Lund. P175; 1982. Application of Impulse Radar to Civil Engineering. PH.D Thesis. [Google Scholar]
- 109.Varnes D.J. In: Schuster R.L., Krizek R.J., editors. vol. 176. National Academy Press, Transportation Research Board, National Academy of Sciences, Special Report; Washington, D.C.: 1978. Slope movement types and processes; pp. 12–33. (Landslide Analysis and Control). [Google Scholar]
- 110.Yamamoto H. Proceedings of the 12th World Conference on Earthquake Engineering. Auckland; New Zealand: 2000. Estimation of shallow S-wave velocity structures from phase velocities of Love-and Rayleigh-waves in microtremors. [Google Scholar]
- 113.Yousif M.S.M. Cairo University; Egypt: 2000. Slope Stability of the Middle Eocene Rocks of Gebel Mokattam, ICEHM2000; pp. 14–22. [Google Scholar]
- 117.Wieczorek G.F., Snyder J.B. In: Geological Monitoring. Young R., Norby L., editors. Geological Society of America; Boulder, Colorado: 2009. Monitoring slope movements; pp. 245–271. [Google Scholar]
Further reading
- 12.Cerveny V., Ravindra R. University of Toronto Press; Toronto: 1971. Theory of Seismic Head Waves. [Google Scholar]
- 13.Chalikakis K., Plagnes V., Guerin R., Valois R., Bosch F.P. Contribution of geophysical methods to karst-system exploration: an overview. Hydrogeol. J. 2011;19(6):1169–1180. [Google Scholar]
- 19.Davis S., Mermelstein P. Comparison of parametric representations for monosyllabic word recognition in continuously spoken sentences. IEEE Trans. Acoust. Speech Signal Process. 1980;28(4):357–366. [Google Scholar]
- 21.Debeglia N., Bitri A., Thierry P. Karst investigations using microgravity and MASW; Application to Orléans, France. Near Surf. Geophys. 2006;4(4):215–225. [Google Scholar]
- 24.Doctor D.H., Doctor K.Z. Spatial analysis of geologic and hydrologic features relating to sinkhole occurrence in Jefferson County, West Virginia. Carbonates Evaporites. 2012;27(2):143–152. [Google Scholar]
- 26.ECP (Egyptian Code of Practice) Housing and Building National Research Center. Ministry of Housing, Utilities and Urban Planning; Cairo: 1993. ECP-201: Egyptian code for calculating loads and forces in structural work and masonry. [Google Scholar]
- 27.Egyptian geological Survey. Geological map of Egypt, the Egyptian mineral resources authority (Previously EGSMA) Abbassiya, Cairo, Egypt.
- 33.Festa V., Fiore A., Parise M., Siniscalchi A. Sinkhole evolution in the Apulian karst of southern Italy: a case study, with some considerations on sinkhole hazards. J. Cave Karst Stud. 2012;74(2):137–147. [Google Scholar]
- 35.Gamal M.A. Using microtremors for microseismic zonation in Cairo's crowded, urban areas. J. Seismol. 2009;13(1):13–30. [Google Scholar]
- 36.Gamal M.A., Mohamed H.K., Maher G. Using microtremors to delineate subsurface structures in port said, north eastern Egypt, international technology and science publications (ITS) Environment. 2019;3:11–26. [Google Scholar]
- 37.Gamal M.A., Khalil M.H., Maher G. Monitoring and studying audible sounds inside different types of soil and great expectations for its future applications. Pure Appl. Geophys. 2020;177(11):5397–5416. [Google Scholar]
- 39.Gamal M.A., Maher G. How to differentiate between various soil strength, using audio processing methods (1-1000 HZ) EGYPTION JOURNAL OF APPLIED GEOPHYSICS. 2022;1 [Google Scholar]
- 41.Geometrics Inc. and OYO . 2009. SeisImager Manual Version 3.3. [Computer program manual]: Japan: OYO Corporation. [Google Scholar]
- 44.Hadi A.I., Brotopuspito K.S., Pramumijoyo S., Hardiyatmo H.C. Regional landslide potential mapping in earthquake-prone areas of kepahiang regency, bengkulu province, Indonesia. Geosciences. 2018;8:219. doi: 10.3390/geosciences8060219. [DOI] [Google Scholar]
- 46.Hasan M., Shang Y.J., Jin W.J., Akhter G. Investigation of fractured rock aquifer in South China using electrical resistivity tomography and self-potential methods. J. Mt. Sci. 2019;16(4):850–869. [Google Scholar]
- 47.Horike M. Inversion of phase velocity of long-period microtremors to the S-wave-velocity structure down to the basement in urbanized areas. J. Phys. Earth. 1985;33(2):59–96. [Google Scholar]
- 48.Huang X., Acero A., Hon H.W., Reddy R. Prentice hall PTR; 2001. Spoken Language Processing: A Guide to Theory, Algorithm, and System Development. [Google Scholar]
- 51.Hunstad I., Marsili A., Casale P., Vallocchia M., Burrato P. Seismic waves and sound waves: from earthquakes to music. Seismol Res. Lett. 2013;84(3):532–535. [Google Scholar]
- 53.Johnson C.W., Meng H., Vernon F., Ben‐Zion Y. Characteristics of ground motion generated by wind interaction with trees, structures, and other surface obstacles. J. Geophys. Res. Solid Earth. 2019;124(8):8519–8539. [Google Scholar]
- 54.Kagami H., Duke C.M., Liang G.C., Ohta Y. Observation of 1-to 5-second microtremors and their application to earthquake engineering. Part II. Evaluation of site effect upon seismic wave amplification due to extremely deep soil deposits. Bull. Seismol. Soc. Am. 1982;72(3):987–998. [Google Scholar]
- 55.Keaton J.R., Degraaf J.V. Landslides Investigation and Mitigation. Transportation Research Board – National Research Council; Washington, D.C.: 1996. Surface observation and geologic mapping; pp. 178–230. National Academy Press. [Google Scholar]
- 56.Kelly S.F. vol. 117. McGraw-Hill; 1953. pp. 65–66. (Introduction to Geophysical Prospecting. Milton B. Dobrin. New York-London). 3029. [Google Scholar]
- 57.Kidanu S.T., Torgashov E.V., Varnavina A.V., Anderson N.L. ERT-based investigation of a sinkhole in Greene County, Missouri. AIMS Geosci. 2016;2(2):99–115. [Google Scholar]
- 60.Lee R., Callahan P., Shelly B., Iqbal A., Kribbs G. GeoFlorida 2010: Advances in Analysis, Modeling & Design. 2010. MASW survey identifies causes of sink activity along I-476 (Blue Route), Montgomery County, Pennsylvania; pp. 1350–1359. [Google Scholar]
- 61.Lermo J., Chávez-García F.J. Site effect evaluation using spectral ratios with only one station. Bull. Seismol. Soc. Am. 1993;83(5):1574–1594. [Google Scholar]
- 62.Lermo J., Rodriguez M., Singh S.K. The Mexico earthquake of September 19, 1985—natural period of sites in the valley of Mexico from microtremor measurements and strong motion data. Earthq. Spectra. 1988;4(4):805–814. [Google Scholar]
- 63.Levitin D.J. In: Cognition, and Computerized Sound. Perry R., editor. 1999. Memory for musical attributes” from music. [Google Scholar]
- 64.Lloyd S. Least squares quantization in PCM. IEEE Trans. Inf. Theor. 1982;28(2):129–137. [Google Scholar]
- 66.Loke M.H. vol. 66p. Advanced Geosciences, Inc.; 1998. (RES2DINV, Rapid 2D Resistivity and IP Inversion Using Least Squares Methods, User Manual, Austin Tex). [Google Scholar]
- 68.Lossent J., Di Iorio L., Valentini-Poirier C.A., Boissery P., Gervaise C. Mapping the diversity of spectral shapes discriminates between adjacent benthic biophonies. Mar. Ecol. Prog. Ser. 2017;585:31–48. [Google Scholar]
- 70.Mahajan A.K., Mundepi A.K., Chauhan N., Jasrotia A.S., Rai N., Gachhayat T.K. Active seismic and passive microtremor HVSR for assessing site effects in Jammu city, NW Himalaya, India—a case study. J. Appl. Geophys. 2012;77:51–62. [Google Scholar]
- 71.McMechan G.A., Yedlin M.J. Analysis of dispersive waves by wave field transformation. Geophysics. 1981;46:869–874. [Google Scholar]
- 73.Moser T.J. Shortest path calculation of seismic rays. Geophysics. 1991;56(1):59–67. [Google Scholar]
- 79.NEHRP . Building Seismic Safety Council; Washington, DC: 2003. NEHRP Recommended Provisions for Seismic Regulations for New Buildings and Other Structures (FEMA 450) [Google Scholar]
- 84.Park C.B., Miller R.D. Open File Report. Kansas Geological Survey, University of Kansas; 2005. Seismic characterization of wind turbine sites near Lawton, Oklahoma, by the MASW method. [Google Scholar]
- 85.Park C.B., Miller R.D., Xia J. SEG Technical Program Expanded Abstracts 1998. Society of Exploration Geophysicists; 1998. Imaging dispersion curves of surface waves on multi-channel record; pp. 1377–1380. [Google Scholar]
- 86.Park C.B., Miller R.D., Xia J. Multichannel analysis of surface waves. Geophysics. 1999;64(3):800–808. [Google Scholar]
- 87.Park C.B. MASW analysis of bedrock velocities (Vs and Vp): 76th Ann. Internat. Mtng. Soc. Expl. Geophys., Exp. Abs. 2016:4966–4970. [Google Scholar]
- 91.Rogers A.M., Borcherdt R.D., Covington P.A., Perkins D.M. A comparative ground response study near Los Angeles using recordings of Nevada nuclear tests and the 1971 San Fernando earthquake. Bull. Seismol. Soc. Am. 1984;74(5):1925–1949. [Google Scholar]
- 93.Said R. Conoco Hurghada Inc. and Repsol Exploration, S. A. by A. A. Baklema; Rotterdam, Brookfiekd: 1990. Geology of Egypt. Published for the Egyptian Petroleum Corporation. [Google Scholar]
- 94.Sakr M., Mashhour M., Hanna A. GeoCongress 2008: Geosustainability and Geohazard Mitigation. 2008. Egyptian collapsible soils and their improvement; pp. 654–661. [Google Scholar]
- 97.Scherbaum F., Riepl J., Bettig B., Ohnberger M., Cornou C., Cotton F., Bard P.Y. Dense array measurements of ambient vibrations in the Grenoble basin to study local site effects. EOS, Transactions, AGU. 1999;80(46) [Google Scholar]
- 98.Seber G.A. John Wiley & Sons; 2009. Multivariate Observations. [Google Scholar]
- 100.Singh A.P., Parmar A., Chopra S. Microtremor study for evaluating the site response characteristics in the Surat City of western India. Nat. Hazards. 2017;89(3):1145–1166. [Google Scholar]
- 105.Suzuki K., Higashi S. Groundwater flow after heavy rain in landslide-slope area from 2-D inversion of resistivity monitoring data. Geophysics. 2001;66(3):733–743. [Google Scholar]
- 106.Toomey D.R., Solomon S.C., Purdy G.M. Tomographic imaging of the shallow crustal structure of the East Pacific Rise at 9° 30′ N. J. Geophys. Res. Solid Earth. 1994;99(B12):24135–24157. [Google Scholar]
- 111.Yatini Y., Suyanto I. Identification of slip surface based on geoelectrical dipoledipole in the landslides hazardous area of gedangsari district, gunungkidul regency, province of daerah istimewa yogyakarta, Indonesia. Earth and Environmental Science. 2018;212 [Google Scholar]
- 112.Young S., Evermann G., Gales M., Hain T., Kershaw D., Liu X., Woodland P. The HTK book. Cambridge university engineering department. 2002;3(175):12. [Google Scholar]
- 114.Yilmaz O. SEG Annual Meeting. society of exploration geophysicists; 2007. Earthquake seismology, exploration seismology, and engineering seismology. [Google Scholar]
- 115.Waltham T., Bell F.G., Culshaw M.G., Knez M., Slabe T. vol. 382. Springer; Berlin: 2005. (Sinkholes and Subsidence: Karst and Cavernous Rocks in Engineering and Construction). [Google Scholar]
- 116.Wieczorek G.F. In: Landslides: Investigation and Mitigation. Turner A.K., Schuster R.L., editors. Transportation Research Board, National Research Council; Washington DC: 1996. Landslide triggering mechanisms; pp. 76–90. Special Report. [Google Scholar]
- 118.Zaidi F.K., Kassem O.M.K. Use of electrical resistivity tomography in delineating zones of groundwater potential in arid regions: a case study from Diriyah region of Saudi Arabia. Arabian J. Geosci. 2012;5(2):327–333. [Google Scholar]
- 119.Zhang J., Toksöz M.N. Nonlinear refraction travel time tomography. Geophysics. 1998;63(5):1726–1737. [Google Scholar]
Associated Data
This section collects any data citations, data availability statements, or supplementary materials included in this article.
Data Availability Statement
The data that has been used is confidential, cannot sharing.


