

Abstract
The bile salt export pump (BSEP) assay is widely used to evaluate the potential for drug-induced liver injury (DILI) early in the drug discovery process. While traditional liquid chromatography–mass spectrometry (LC-MS)-based approaches have been utilized for BSEP activity testing, they have intrinsic limitations in either throughput or the requirement for sample preparation and are difficult to scale up in order to screen drug candidates. Here we demonstrate the use of two different high-throughput MS methods based on solid-phase extraction (SPE) and desorption electrospray ionization (DESI) for high-throughput BSEP activity assessment in a label-free manner, with minimal needs for sample workup, at sampling rates of ∼11 and ∼5.5 s/sample, respectively. Both approaches were validated, compared, and successfully applied to the evaluation of 96 drug candidates for the inhibition of taurocholic acid (TCA) transport using BSEP vesicles.
Keywords: High-throughput experimentation, Ambient ionization, Desorption electrospray ionization, Solid-phase extraction, Drug-induced liver injury
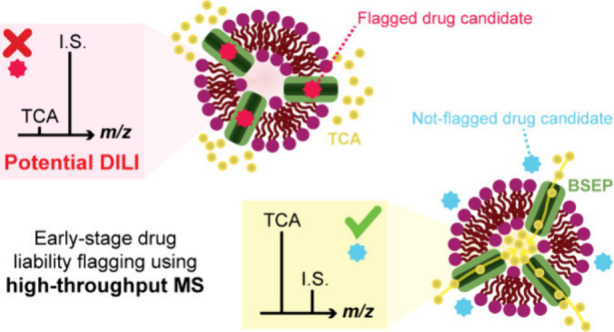
Drug-induced liver injury (DILI)1,2 is a significant indicator of drug safety problems in drug discovery that frequently leads to drug candidate withdrawal from further testing.3−5 Thus, drugmakers typically evaluate the potential hepatotoxicity of compounds in early discovery at the hit-to-lead and lead optimization stages to ensure their safety and avoid possible future DILI-based failure. One approach to doing so relies on screening compounds against the bile salt export pump (BSEP),6 a primary target related to DILI, which actively transports bile acids from the liver to the bile. Inhibition of the BSEP-mediated transport causes the accumulation of bile acids in the liver, resulting in liver injury.7 A number of approved drugs, such as nefazodone, bosentan, and troglitazone, have been reported to inhibit BSEP activity and induce human cholestatic liver injury.8,9 For this reason, the BSEP assay is widely used to evaluate drug-induced liabilities in early stages of drug discovery to reduce the risk of BSEP-mediated DILI. Moreover, this assay can be carried out in vitro by measuring the drug-induced modulation of taurocholic acid (TCA) transport to BSEP vesicles3 (Figure 1A).
Figure 1.

Overall concept and workflow of the BSEP assay for identifying the potential DILI of drug candidates using high-throughput mass spectrometry (HTMS). (A) Illustration of a vesicle-based in vitro assay to test drug candidates via the MS quantitation of transported TCA. (B) Workflow developed for the BSEP assay, including preparation, incubation, quenching, and filtering of assay plates followed by HTMS quantitative analysis via DESI-MS or RapidFire-MS. Densities are 1536 and 384, respectively; sample volumes and throughputs of both MS approaches are indicated.
Diverse label-based methodologies, such as radiometric3 and fluorometric10 approaches, have been developed to screen compounds against BSEP, enabling earlier liability flagging. However, current radiometric methods have limited applications, as they are typically labor-intensive and involve costly radiolabeled substrates, which introduce inherent safety concerns.11 Similarly, despite enabling rapid screening, fluorometric strategies have limited flexibility, as they rely on fluorescent bile acid derivatives and thus require extensive synthetic efforts as well as substrate-specific assay development.10
Mass spectrometry (MS) is a fast and label-free technique widely used in drug discovery12−15 that can be applied to assess BSEP inhibition. MS provides high specificity and sensitivity with a wide dynamic range,14,15 although its throughput is typically limited due to coupling with separation techniques to reduce sample complexity. For example, liquid chromatography–mass spectrometry (LC-MS) analysis of bile acids has demonstrated throughput at sampling rates of ∼1.5–10 min/sample.3,16 Shorter analysis times (<1 min/sample) can be achieved by combining dual staggered LC systems with multiple injections for MS acquisition.11 However, further increase in analysis speed for LC-MS-based assays, which is required for high-throughput screening, is limited by the chromatographic separation step.17 To provide a possible solution, chromatography-free MS approaches have emerged,18 with examples including those based on matrix-assisted laser desorption/ionization (MALDI)19 and acoustic ejection, which provide throughputs typically around 1 s/sample20,21 and in some cases down to 0.3 s/sample,22,23 respectively. However, MALDI requires laborious sample preparation and nonambient analysis conditions while suffering from ion suppression from the matrix.18 This ion suppression limitation is also encountered in acoustic ejection methods, despite efforts to address it (i.e., diluting samples ∼1000 times at the open port interface before injecting to the MS inlet22), particularly in samples that contain high concentrations of salts and buffers,14 which are typical in biological matrices.20,24 Alternative chromatography-free approaches using automated solid-phase microextraction (SPME) have also been proposed for complex sample analysis, albeit with more modest throughputs (∼75 s/sample).25−29
In recent years, solid-phase extraction (SPE)-based RapidFire-MS and desorption electrospray ionization (DESI)-MS have been reported as label-free, high-throughput MS (HTMS) techniques to rapidly screen a large number of compounds with minimum sample preparation and high tolerance for complex biological matrices. These two techniques address the moderate speed and intrinsic limits of other techniques but have yet to be applied to evaluate BSEP-associated DILI for drug safety. RapidFire-MS typically achieves a screening throughput of 2.5–15 s/sample18,30,31 and requires no prior sample preparation due to the online SPE step that confers tolerance to salts and buffers. The applications of RapidFire-MS range from the identification of inhibitors17,32 and lead discovery33−35 to the study of potential drug–drug interactions.36 DESI-MS, an ambient ionization technique,37 has been broadly applied in molecular profiling, tissue analysis, microdroplet-accelerated reactions, and high-throughput experimentation.38 Samples containing high concentrations of nonvolatile salts, buffers, and detergents can be analyzed directly by DESI-MS without any sample preparation at throughputs above 1 s/sample.20,39−41 In addition to the very rapid analysis speed, DESI-MS has been successfully implemented in organic reaction screening and nanoscale synthesis using crude reaction mixtures.20,42,43
Here we demonstrate the first application of RapidFire-MS and DESI-MS for high-throughput assessment of BSEP activity to evaluate the potential DILI of drug candidates during early-stage drug discovery (Figure 1). We describe the development of both methodologies, their validation against traditional assays, and their application to a pilot screening campaign of 96 drug candidates. We also compare their performance in terms of TCA quantitation, throughput, and scalability as well as solvent and sample consumption.
To develop these assays, we first established BSEP-HEK293 cell clones that stably express the BSEP protein by transfecting a BSEP cDNA expression vector into HEK293 cells. The developed cell line was used to isolate BSEP vesicles with an inside-out configuration and thus a reverse orientation that allows TCA to be transported into and retained in the vesicles3 (Figure 1A). These vesicles were then successfully incorporated into an automated 384-well plate-based workflow for assessment of BSEP inhibition as a proxy for evaluating potential DILI. The workflow culminated in the quantification of the transported TCA (retained in the vesicles after filtering) by using both RapidFire-MS and DESI-MS in parallel (Figure 1B). Both MS strategies allowed for the high-throughput evaluation of a large number of drug candidates and the kinetic characterization of the biological system without the need for additional sample purification. RapidFire-MS allows rapid analysis of complex samples using an online SPE step, whereas DESI-MS takes advantage of the online microextraction event that occurs during the contactless DESI process to reduce the sample processing time, concentrate analytes from the sample, and minimize matrix effects. Overall, the total cycle time of RapidFire-MS, including loading, wash, elution, and re-equilibration, was approximately ∼11 s/sample, facilitating the analysis of 384 samples in ca. 70 min. DESI-MS, as a chromatography-free approach, provided screening rates better than 1 s/replicate, as no sample enrichment is required. DESI-MS involves use of a pin tool to transfer samples from assay plates to DESI plates, achieving an overall analysis time of ∼35 min for 1536 measurements (four replicates of 384 samples), including ∼10 min to pin and dry the samples.
We evaluated the quantitative performance of RapidFire-MS and DESI-MS for the high-throughput analysis of the transported TCA (Figure 2A,B). Both methodologies provided excellent linear response, as observed in the calibration curves created using TCA standards (DESI-MS, R2 = 0.99759; RapidFire-MS, R2 = 0.99967; Figure 2C,D), allowing in both cases for detection of TCA down to at least 20 nM, which is enough sensitivity to carry out the BSEP activity assessment. It is noteworthy that despite the lower sample consumption with DESI-MS versus RapidFire-MS (0.5 μL vs 20 μL, respectively), the sensitivity achieved with these techniques is comparable. This establishes the scalability of DESI-MS for sample-limited assays. Also, higher detection sensitivity can be achieved for DESI when coupled with triple-quadrupole MS using multiple reaction monitoring,44,45 rather than the full MS scan utilized here for the DESI-MS TCA determination.
Figure 2.

Method development for RapidFire-MS and DESI-MS assays and their performance for TCA quantitation and Michaelis–Menten studies. (A) Representative MS/MS spectra of TCA standard from RapidFire-MS. (B) Representative MS spectra of TCA (5 nM, 10 nM, 50 nM, 100 nM) and TCA-d4 from DESI-MS. (C) Calibration curve of TCA standard (10 nM to 2.5 μM, R2 = 0.99967) using RapidFire-MS. (D) Calibration curve of TCA standard (5 nM to 20 μM, R2 = 0.99759) using DESI-MS. (E) Titration curve of Michaelis–Menten equation for TCA using RapidFire-MS. The transport rate of TCA was calculated by subtracting the transport rate of TCA under AMP (considered as background) from the transport rate of TCA under ATP. The values of Km and Vmax were 5.19 μM and 0.84 nM/min, respectively. The variance (R2) for the curve fitting was 0.9843 for the titration range of 0–50 μM. (F) Titration curve of the Michaelis–Menten equation for TCA using DESI-MS. The transport rate of TCA was calculated in the same way as shown in (E). The values of Km and Vmax were 3.29 μM and 1.42 nM/min, respectively. R2 for the curve fitting was 0.9999 for the titration range of 0–50 μM.
We applied the developed high-throughput MS methods to determine the Michaelis–Menten constant (Km) of the BSEP-TCA system in the presence of ATP, which is necessary for the active uptake of TCA into the BSEP vesicles. The initial transport rate of TCA at a variety of TCA concentrations was corrected by subtracting the contribution from nonspecific TCA uptake to the BSEP vesicles,46 which was determined by a control experiment in the presence of AMP instead of ATP. Through a plot of initial transport rate versus substrate concentration, the Km values were determined to be 5.19 ± 0.86 μM (Figure 2E) and 3.29 ± 1.02 μM (Figure 2F) using RapidFire-MS and DESI-MS, respectively. Accordingly, the Vmax values determined using RapidFire-MS and DESI-MS were 0.84 ± 0.04 nM/min and 1.42 ± 0.12 nM/min, respectively. The comparable (within 2-fold)47Km and Vmax values of these two HTMS techniques demonstrate the robustness of the developed BSEP assay protocol as well as the reliability of the two MS-based high-throughput analysis techniques for kinetic studies. To further apply the RapidFire-MS and DESI-MS high-throughput methods to evaluate potential DILI of new drug candidates, we first validated the two approaches using seven benchmark compounds with known IC50 values against BSEP: glafenine, zafirlukast, glyburide, nefazodone, ritonavir, rosiglitazone, and cyclosporin A. These reference compounds are drugs approved by the U.S. Food and Drug Administration and had been identified to be associated with DILI liabilities.7,48 Each reference compound was titrated in the BSEP assay at various concentrations from 100 μM to 1.7 nM in 3-fold dilution, resulting in an 11-point dose–response curve. The resulting IC50 values from both HTMS platforms as well as reported values from existing techniques are summarized in Table 1. In the case of glafenine, an IC50 value could not be estimated using either RapidFire-MS or DESI-MS, though radiometric and LC-MS-based studies have reported IC50 values at 53.8 μM and 28.1 μM, respectively,3 due to the weak activity of glafenine and the narrow concentration range titrated, as only one or two concentration points were above the reported IC50 value, which affected the curve fitting. For the other six compounds, the IC50 values obtained with RapidFire-MS and DESI-MS were all under 10 μM and in agreement with data from previous studies,7,48 which reported compounds with strong association with drug-induced hepatotoxicity in human. In general, the results obtained with RapidFire-MS and DESI-MS fall within less than 3-fold of the literature-reported values. This demonstrates that the developed high-throughput MS approaches can be used to screen new drug candidates for BSEP inhibition. For a single compound, glyburide, the RapidFire-MS and DESI-MS methods provided different IC50 values, with the one estimated by DESI-MS (3.78 ± 1.83 μM) being in better agreement with the values reported in the literature (4–7 μM) than the one obtained with RapidFire-MS (21.36 ± 6.94 μM). Note, however, that in both cases the compound would have been flagged for potential DILI due to BSEP inhibition with IC50 values under 25 μM.7
Table 1. IC50 Values for Seven Reference Compounds Obtained by Four Different Techniques: RapidFire-MS, DESI-MS, Radioassay,3 and LC-MS3.
| IC50 (μM) |
||||
|---|---|---|---|---|
| compound | RapidFire-MS | DESI-MS) | radioassay | LC-MS |
| glafenine | N/Aa | N/Aa | 53.8 ± 14 | 28.1 ± 8.4 |
| zafirlukast | 7.30 ± 1.41 | 2.96 ± 1.99 | 8.57 ± 1.7 | 20.4 ± 10 |
| glyburide | 21.36 ± 6.94 | 3.78 ± 1.83 | 6.79 ± 2.3 | 4.26 ± 0.8 |
| nefazodone | 6.69 ± 1.36 | 4.16 ± 2.76 | 7.11 ± 4.8 | 3.61 ± 0.5 |
| ritonavir | 0.90 ± 0.35 | 0.61 ± 0.54 | 2.92 ± 0.7 | 2.49 ± 0.9 |
| rosiglitazone | 2.26 ± 0.22 | 7.59 ± 3.29 | 5.47 ± 0.5 | 2.60 ± 0.4 |
| cyclosporin A | 5.38 ± 1.46 | 4.49 ± 2.13 | not tested | not tested |
N/A means that it was not possible to reliably fit a sigmoidal dose–response curve to determine the IC50 value.
Next, we applied the two validated high-throughput MS techniques to screen 96 drug candidates for potential DILI via BSEP inhibition. The dose–response evaluation was carried out following the same procedure that was used for benchmark compounds. The overall results obtained for the two MS approaches (Figure 3A,B) were in agreement, with a Spearman’s correlation coefficient of 0.824, indicating a close match in the IC50 values determined.49 A representative example of the dose–response curves obtained with the two methods for a single candidate is shown in Figure 3C. No bias was observed in the relationship between the results of the two methods, with evenly distributed IC50 values across the correlation line (Figure 3D). Fourteen of the evaluated compounds out of the tested 96 compounds showed no IC50 values from either RapidFire-MS or DESI-MS due to weak BSEP inhibition and the lack of reliable curve fitting from the limited compound concentrations evaluated. Only two compounds provided IC50 values with a fold change greater than 3 between the two methods, although in both cases the IC50 values measured were under 5 μM; they would therefore be flagged with strong potential DILI using either method.
Figure 3.

IC50 determination for 96 drug candidates using both RapidFire-MS and DESI-MS. (A) Representative heatmap of the intensity ratio for TCA (m/z 514) and TCA-d4 (m/z 518) from RapidFire-MS for one 384-well plate containing 32 test compounds. (B) Representative heatmap of the intensity ratio for TCA (m/z 514) and TCA-d4 (m/z 518) from DESI-MS for one 384-well plate containing 32 tested compounds. (C) Example showing the curve fitting of inhibition to determine the IC50 value for one drug candidate. The black symbols and black curve are for RapidFire-MS. The red symbols and red curve are for DESI-MS. (D) pIC50 plot for tested drug candidates using RapidFire-MS and DESI-MS. The X axis plots pIC50 values from RapidFire-MS, and the Y axis plots pIC50 values from DESI-MS. Dark gray dots indicate 81 compounds out of the 96 tested drug candidates with obtained IC50 values from both RapidFire-MS and DESI-MS. The green line is Y = X; the red lines show 3-fold change.
Overall, the results obtained in this study demonstrate the capability of these two high-throughput MS approaches to provide reliable results for early-stage drug liability flagging. Across multiple experiments, including the evaluation of quantitative performance, Km determinations, dose–response studies, and IC50 value determination, the newly developed RapidFire-MS and DESI-MS methodologies provided comparable results, indicating that either technology will work for high-throughput DILI flagging within the drug discovery workflow. It is worth highlighting that DESI-MS provided these similar results at an analysis rate an order of magnitude faster (1 s/replicate vs 11 s/replicate required for RapidFire-MS) due to the required SPE enrichment step within the RapidFire protocol. Also note that in this study, DESI-MS was implemented with the analysis of four technical replicates of each sample, providing more robust measurements to lower the %CV from ∼25% to <10% and still achieving an ∼2-fold higher throughput compared to RapidFire-MS. This advantage extends to the low assay volumes required for the generation of DESI microarrays (10 μL; enough for more than four replicate measurements) compared to the amount needed for RapidFire-MS injections (40 μL for a single measurement) and even to the actual sample consumption in each measurement, which is 40-fold less with DESI-MS (0.5 μL) compared with RapidFire-MS (20 μL). Additionally, DESI-MS involves a dramatic reduction in solvent consumption (1.75 μL/min for the DESI spray) in comparison with the RapidFire-MS methodology (≥0.8 mL/min). In comparison with the established techniques for BSEP assay3 (radioassay and LC-MS/MS; Table 2), the analysis throughput of the newly developed RapidFire-MS and DESI-MS methods show at least ∼6-fold and ∼12-fold improvement, respectively. Moreover, the advantages of the two newly developed HTMS techniques extend to minimal sample preparation, label-free analysis, and less solvent consumption, as summarized in Table 2. It is noted, though, that the established methods have well-documented reliability and that the investment costs of the two newer methods are high.
Table 2. Comparison of the Two Newer HTMS Techniques with Established Techniques3 (Radioassay and LC-MS/MS) for BSEP Assay.
| metric | RapidFire-MS | DESI-MS | radioassay | LC-MS/MS |
|---|---|---|---|---|
| throughput (per measurement) | ∼11 s | ∼1.4 s | 1 min | 1.5 min |
| label-free | yes | yes | no | yes |
| sample enrichment | yes | no | N/Aa | yes |
| ion suppression | strong | weak | N/Aa | strong |
| sample consumption | 20 μL | 0.5 μL | 15 μL | 10 μL |
| solvent consumption (per sample) | ∼150 μL | <0.12 μL | N/Aa | ∼1200 μL |
N/A = not applicable.
Through this proof-of-concept study, we introduced both RapidFire-MS and DESI-MS to the high-throughput analysis toolbox for the screening of drug candidates via a BSEP transport assay, demonstrating their potential for early evaluation of drug liability during drug discovery campaigns. Despite this singular focus, the high throughput of both RapidFire-MS and DESI-MS enables the screening of a large number of compounds, making these HTMS methodologies suitable for drug discovery.43
Acknowledgments
This work was funded by a Collaborative Research Agreement between Janssen Research and Development, LLC, a Johnson & Johnson Company, and Purdue University. The authors acknowledge use of the Purdue High Throughput DESI-MS Facility for High Throughput Synthesis and Bioanalysis, a component of the Metabolite Profiling Facility of the Bindley Biosciences Center, a core facility of the NIH-funded Indiana Clinical and Translational Sciences Institute. The DESI-MS Facility is supported in part by the Purdue Institute for Cancer Research. We acknowledge Dr. John Masucci for his contribution to the collaboration between Johnson & Johnson and Purdue University. We thank Dr. Nico Vervoort, Dr. Karel Goossens, Dr. Harsha Gunawardena, and Dr. Bo Hao for discussions and comments. J.L. acknowledges support from the Discovery, Product Development & Supply (DPDS) Postdoctoral Fellowship Program within Janssen Research and Development, LLC of Johnson & Johnson.
Glossary
Abbreviations
- BSEP
bile salt export pump
- DESI
desorption electrospray ionization
- DILI
drug-induced liver injury
- HTMS
high-throughput mass spectrometry
- LC-MS
liquid chromatography–mass spectrometry
- MALDI
matrix-assisted laser desorption/ionization
- TCA
taurocholic acid
- SPE
solid-phase extraction
- SPME
solid-phase microextraction
Supporting Information Available
The Supporting Information is available free of charge at https://pubs.acs.org/doi/10.1021/acsmedchemlett.4c00302.
Details of materials and reagents used in this study, cloning human BSEP expression vector, BSEP vesicle preparation, RapidFire-MS and DESI-MS method development and data analysis, and compound profiling (PDF)
Safety Statement: All chemicals were handled with caution, wearing proper personal protective equipment and following general safety protocols. Potential electrical shock hazards were prevented by shielding electrically conductive parts involved in the experiments.
The authors declare no competing financial interest.
Supplementary Material
References
- David S.; Hamilton J. P. Drug-induced liver injury. US Gastroenterol. Hepatol. Rev. 2010, 6, 73–80. [PMC free article] [PubMed] [Google Scholar]
- Andrade R. J.; Chalasani N.; Björnsson E. S.; Suzuki A.; Kullak-Ublick G. A.; Watkins P. B.; Devarbhavi H.; Merz M.; Lucena M. I.; Kaplowitz N.; et al. Drug-induced liver injury. Nat. Rev. Dis. Primers 2019, 5 (1), 58. 10.1038/s41572-019-0105-0. [DOI] [PubMed] [Google Scholar]
- Marroquin L. D.; Bonin P. D.; Keefer J.; Schroeter T. Assessment of bile salt export pump (BSEP) inhibition in membrane vesicles using radioactive and LC/MS-based detection methods. Curr. Protoc. Toxicol. 2017, 71, 14.14.11–14.14.20. 10.1002/cptx.15. [DOI] [PubMed] [Google Scholar]
- Bleibel W.; Kim S.; D’Silva K.; Lemmer E. R. Drug-induced liver injury: review article. Dig. Dis. Sci. 2007, 52 (10), 2463–2471. 10.1007/s10620-006-9472-y. [DOI] [PubMed] [Google Scholar]
- Schadt S.; Simon S.; Kustermann S.; Boess F.; McGinnis C.; Brink A.; Lieven R.; Fowler S.; Youdim K.; Ullah M.; et al. Minimizing DILI risk in drug discovery - A screening tool for drug candidates. Toxicol. Vitro 2015, 30 (1), 429–437. 10.1016/j.tiv.2015.09.019. [DOI] [PubMed] [Google Scholar]
- Deng R.Bile salt export pump: drug-induced liver injury and assessment approaches. In Drug-Induced Liver Toxicity; Chen M., Will Y., Eds.; Methods in Pharmacology and Toxicology; Humana Press, 2018; pp 301–329. [Google Scholar]
- Morgan R. E.; Trauner M.; van Staden C. J.; Lee P. H.; Ramachandran B.; Eschenberg M.; Afshari C. A.; Qualls C. W.; Lightfoot-Dunn R.; Hamadeh H. K. Interference with bile salt export pump function is a susceptibility factor for human liver injury in drug development. Toxicol. Sci. 2010, 118 (2), 485–500. 10.1093/toxsci/kfq269. [DOI] [PubMed] [Google Scholar]
- Kostrubsky S. E.; Strom S. C.; Kalgutkar A. S.; Kulkarni S.; Atherton J.; Mireles R.; Feng B.; Kubik R.; Hanson J.; Urda E.; et al. Inhibition of hepatobiliary transport as a predictive method for clinical hepatotoxicity of nefazodone. Toxicol. Sci. 2006, 90 (2), 451–459. 10.1093/toxsci/kfj095. [DOI] [PubMed] [Google Scholar]
- Woodhead J. L.; Yang K.; Siler S. Q.; Watkins P. B.; Brouwer K. L. R.; Barton H. A.; Howell B. A. Exploring BSEP inhibition-mediated toxicity with a mechanistic model of drug-induced liver injury. Front. Pharmacol. 2014, 5, 11. 10.3389/fphar.2014.00240. [DOI] [PMC free article] [PubMed] [Google Scholar]
- Yamaguchi K.; Murai T.; Yabuuchi H.; Hui S. P.; Kurosawa T. Measurement of bile salt export pump transport activities using a fluorescent bile acid derivative. Drug Metab. Pharmacokinet. 2010, 25 (2), 214–219. 10.2133/dmpk.25.214. [DOI] [PubMed] [Google Scholar]
- Vath M.; Gallagher L.; Shou W.; Weller H.; Elkin L.; Zhang J. Development of an LC-MS/MS method for high throughput quantification of metformin uptake in transporter inhibition assays. J. Chromatogr. B 2014, 967, 211–218. 10.1016/j.jchromb.2014.07.024. [DOI] [PubMed] [Google Scholar]
- Kaltashov I. A.; Ivanov D. G.; Yang Y. Mass spectrometry-based methods to characterize highly heterogeneous biopharmaceuticals, vaccines, and nonbiological complex drugs at the intact-mass level. Mass Spectrom. Rev. 2024, 43 (1), 139–165. 10.1002/mas.21829. [DOI] [PMC free article] [PubMed] [Google Scholar]
- Niu C. D.; Du Y.; Kaltashov I. A. Towards better understanding of the heparin role in NETosis: Feasibility of using native mass spectrometry to monitor interactions of neutrophil elastase with heparin oligomers. Int. J. Mass Spectrom. 2021, 463, 116550. 10.1016/j.ijms.2021.116550. [DOI] [PMC free article] [PubMed] [Google Scholar]
- Glish G. L.; Vachet R. W. The basics of mass spectrometry in the twenty-first century. Nat. Rev. Drug Discovery 2003, 2 (2), 140–150. 10.1038/nrd1011. [DOI] [PubMed] [Google Scholar]
- Zenobi R. Single-cell metabolomics: analytical and biological perspectives. Science 2013, 342 (6163), 1201. 10.1126/science.1243259. [DOI] [PubMed] [Google Scholar]
- Ding J.; Lund E. T.; Zulkoski J.; Lindsay J. P.; McKenzie D. L. High-throughput bioanalysis of bile acids and their conjugates using UHPLC coupled to HRMS. Bioanalysis 2013, 5 (20), 2481–2494. 10.4155/bio.13.215. [DOI] [PubMed] [Google Scholar]
- Meng J. C.; Lai M. T.; Munshi V.; Grobler J.; McCauley J.; Zuck P.; Johnson E. N.; Uebele V. N.; Hermes J. D.; Adam G. C. Screening of HIV-1 protease using a combination of an ultra-high-throughput fluorescent-based assay and RapidFire mass spectrometry. J. Biomol. Screening 2015, 20 (5), 606–615. 10.1177/1087057115570838. [DOI] [PubMed] [Google Scholar]
- Pu F.; Elsen N. L.; Williams J. D. Emerging chromatography-free high-throughput mass spectrometry technologies for generating hits and leads. ACS Med. Chem. Lett. 2020, 11 (11), 2108–2113. 10.1021/acsmedchemlett.0c00314. [DOI] [PMC free article] [PubMed] [Google Scholar]
- Cornett D. S.; Scholle M. D. Advances in MALDI mass spectrometry within drug discovery. SLAS Discovery 2017, 22 (10), 1179–1181. 10.1177/2472555217735067. [DOI] [PubMed] [Google Scholar]
- Morato N. M.; Le M. T.; Holden D. T.; Cooks R. G. Automated high-throughput system combining small-scale synthesis with bioassays and reaction screening. SLAS Technol. 2021, 26 (6), 555–571. 10.1177/24726303211047839. [DOI] [PubMed] [Google Scholar]
- Chin J.; Wood E.; Peters G. S.; Drexler D. M. Acoustic sample deposition MALDI-MS (ASD-MALDI-MS): a novel process flow for quality control screening of compound libraries. J. Lab. Autom. 2016, 21 (1), 204–207. 10.1177/2211068215594769. [DOI] [PubMed] [Google Scholar]
- Zhang H.; Liu C.; Hua W. Y.; Ghislain L. P.; Liu J. H.; Aschenbrenner L.; Noell S.; Dirico K. J.; Lanyon L. F.; Steppan C. M.; et al. Acoustic ejection mass spectrometry for high-throughput analysis. Anal. Chem. 2021, 93 (31), 10850–10861. 10.1021/acs.analchem.1c01137. [DOI] [PubMed] [Google Scholar]
- Simon R. P.; Häbe T. T.; Ries R.; Winter M.; Wang Y. T.; Fernandez-Montalvan A.; Bischoff D.; Runge F.; Reindl W.; Luippold A. H.; et al. Acoustic ejection mass spectrometry: a fully automatable technology for high-throughput screening in drug discovery. SLAS Discovery 2021, 26 (8), 961–973. 10.1177/24725552211028135. [DOI] [PubMed] [Google Scholar]
- Niu Z. L.; Zhang W. W.; Yu C. W.; Zhang J.; Wen Y. Y. Recent advances in biological sample preparation methods coupled with chromatography, spectrometry and electrochemistry analysis techniques. TrAC, Trends Anal. Chem. 2018, 102, 123–146. 10.1016/j.trac.2018.02.005. [DOI] [Google Scholar]
- Zhou W.; Nazdrajic E.; Pawliszyn J. High-throughput and rapid screening of drugs of abuse in Saliva by multi-segment injection using solid-phase microextraction-automated microfluidic open interface-mass spectrometry. Anal. Chem. 2023, 95 (15), 6367–6373. 10.1021/acs.analchem.2c05782. [DOI] [PMC free article] [PubMed] [Google Scholar]
- Nazdrajic E.; Murtada K.; Rickert D. A.; Pawliszyn J. Coupling of solid-phase microextraction directly to mass spectrometry via an improved microfluidic open interface to facilitate high-throughput determinations. J. Am. Soc. Mass Spectrom. 2023, 34 (6), 1006–1014. 10.1021/jasms.2c00380. [DOI] [PubMed] [Google Scholar]
- Piri-Moghadam H.; Alam M. N.; Pawliszyn J. Review of geometries and coating materials in solid phase microextraction: Opportunities, limitations, and future perspectives. Anal. Chim. Acta 2017, 984, 42–65. 10.1016/j.aca.2017.05.035. [DOI] [PubMed] [Google Scholar]
- Huba A. K.; Mirabelli M. F.; Zenobi R. High-throughput screening of PAHs and polar trace contaminants in water matrices by direct solid-phase microextraction coupled to a dielectric barrier discharge ionization source. Anal. Chim. Acta 2018, 1030, 125–132. 10.1016/j.aca.2018.05.050. [DOI] [PubMed] [Google Scholar]
- Ghiasikhou S.; Cazzamalli S.; Scheuermann J.; Neri D.; Zenobi R. Automated and enhanced extraction of a small molecule-drug conjugate using an enzyme-inhibitor interaction based SPME tool followed by direct analysis by ESI-MS. Anal. Bioanal. Chem. 2019, 411 (28), 7387–7398. 10.1007/s00216-019-02165-7. [DOI] [PubMed] [Google Scholar]
- Sawyer W. S.; Srikumar N.; Carver J.; Chu P. Y.; Shen A.; Xu A. K.; Williams A. J.; Spiess C.; Wu C.; Liu Y. C.; et al. High-throughput antibody screening from complex matrices using intact protein electrospray mass spectrometry. Proc. Natl. Acad. Sci. U. S. A. 2020, 117 (18), 9851–9856. 10.1073/pnas.1917383117. [DOI] [PMC free article] [PubMed] [Google Scholar]
- Bretschneider T.; Ozbal C.; Holstein M.; Winter M.; Buettner F. H.; Thamm S.; Bischoff D.; Luippold A. H. RapidFire BLAZE-mode is boosting ESI-MS toward high-throughput-screening. SLAS Technol. 2019, 24 (4), 386–393. 10.1177/2472630318822449. [DOI] [PubMed] [Google Scholar]
- Izquierdo M.; Lin D.; O’Neill S.; Zoltner M.; Webster L.; Hope A.; Gray D. W.; Field M. C.; González-Bacerio J. Development of a high-throughput screening assay to identify inhibitors of the major M17-leucyl aminopeptidase from Trypanosoma cruzi using RapidFire mass spectrometry. SLAS Discovery 2020, 25 (9), 1064–1071. 10.1177/2472555220923367. [DOI] [PubMed] [Google Scholar]
- Leveridge M. V.; Bardera A. I.; LaMarr W.; Billinton A.; Bellenie B.; Edge C.; Francis P.; Christodoulou E.; Shillings A.; Hibbs M.; et al. Lead discovery for microsomal prostaglandin E synthase using a combination of high-throughput fluorescent-based assays and RapidFire mass spectrometry. J. Biomol. Screening 2012, 17 (5), 641–650. 10.1177/1087057111435700. [DOI] [PubMed] [Google Scholar]
- Hutchinson S. E.; Leveridge M. V.; Heathcote M. L.; Francis P.; Williams L.; Gee M.; Munoz-Muriedas J.; Leavens B.; Shillings A.; Jones E.; et al. Enabling lead discovery for histone lysine demethylases by high-throughput RapidFire mass spectrometry. J. Biomol. Screening 2012, 17 (1), 39–48. 10.1177/1087057111416660. [DOI] [PubMed] [Google Scholar]
- Lowe D. M.; Gee M.; Haslam C.; Leavens B.; Christodoulou E.; Hissey P.; Hardwicke P.; Argyrou A.; Webster S. P.; Mole D. J.; et al. Lead discovery for human kynurenine 3-monooxygenase by high-throughput RapidFire mass spectrometry. J. Biomol. Screening 2014, 19 (4), 508–515. 10.1177/1087057113518069. [DOI] [PubMed] [Google Scholar]
- Wu X.; Wang J.; Tan L.; Bui J.; Gjerstad E.; McMillan K.; Zhang W. T. In vitro ADME profiling using high-throughput RapidFire mass spectrometry: cytochrome P450 inhibition and metabolic stability assays. J. Biomol. Screening 2012, 17 (6), 761–772. 10.1177/1087057112441013. [DOI] [PubMed] [Google Scholar]
- Takáts Z.; Wiseman J. M.; Gologan B.; Cooks R. G. Mass spectrometry sampling under ambient conditions with desorption electrospray ionization. Science 2004, 306 (5695), 471–473. 10.1126/science.1104404. [DOI] [PubMed] [Google Scholar]
- Morato N. M.; Cooks R. G. Desorption electrospray ionization mass spectrometry: 20 years. Acc. Chem. Res. 2023, 56 (18), 2526–2536. 10.1021/acs.accounts.3c00382. [DOI] [PMC free article] [PubMed] [Google Scholar]
- Morato N. M.; Cooks R. G. Inter-platform assessment of performance of high-throughput desorption electrospray ionization mass spectrometry. Talanta Open 2021, 4, 100046 10.1016/j.talo.2021.100046. [DOI] [Google Scholar]
- Morato N. M.; Holden D. T.; Cooks R. G. High-throughput label-free enzymatic assays using desorption electrospray-ionization mass spectrometry. Angew. Chem., Int. Ed. 2020, 59 (46), 20459–20464. 10.1002/anie.202009598. [DOI] [PubMed] [Google Scholar]
- Kulathunga S. C.; Morato N. M.; Zhou Q.; Cooks R. G.; Mesecar A. D. Desorption electrospray ionization mass spectrometry assay for label-free characterization of SULT2B1b enzyme kinetics. ChemMedChem 2022, 17 (9), 10. 10.1002/cmdc.202200043. [DOI] [PMC free article] [PubMed] [Google Scholar]
- Huang K. H.; Morato N. M.; Feng Y. F.; Cooks R. G. High-throughput diversification of complex bioactive molecules by accelerated synthesis in microdroplets. Angew. Chem., Int. Ed. 2023, 62 (22), e202300956. 10.1002/anie.202300956. [DOI] [PMC free article] [PubMed] [Google Scholar]
- Cooks R. G.; Feng Y. F.; Huang K. H.; Morato N. M.; Qiu L. Q. Re-imagining drug discovery using mass spectrometry. Isr. J. Chem. 2023, 63 (7–8), 9. 10.1002/ijch.202300034. [DOI] [PMC free article] [PubMed] [Google Scholar]
- Yost R. A.; Enke C. G. Triple quadrupole mass-spectrometry for direct mixture analysis and structure elucidation. Anal. Chem. 1979, 51 (12), 1251–1264. 10.1021/ac50048a002. [DOI] [PubMed] [Google Scholar]
- Kitteringham N. R.; Jenkins R. E.; Lane C. S.; Elliott V. L.; Park B. K. Multiple reaction monitoring for quantitative biomarker analysis in proteomics and metabolomics. J. Chromatogr. B 2009, 877 (13), 1229–1239. 10.1016/j.jchromb.2008.11.013. [DOI] [PubMed] [Google Scholar]
- Kenna J. G.; Taskar K. S.; Battista C.; Bourdet D. L.; Brouwer K. L. R.; Brouwer K. R.; Dai D.; Funk C.; Hafey M. J.; Lai Y. R.; et al. Can bile salt export pump inhibition testing in drug discovery and development reduce liver injury risk? An international transporter consortium perspective. Clin. Pharmacol. Ther. 2018, 104 (5), 916–932. 10.1002/cpt.1222. [DOI] [PMC free article] [PubMed] [Google Scholar]
- Vivian D.; Polli J. E. Mechanistic interpretation of conventional Michaelis-Menten parameters in a transporter system. Eur. J. Pharm. Sci. 2014, 64, 44–52. 10.1016/j.ejps.2014.08.007. [DOI] [PMC free article] [PubMed] [Google Scholar]
- Chen M. J.; Suzuki A.; Thakkar S.; Yu K.; Hu C. C.; Tong W. D. DILIrank: the largest reference drug list ranked by the risk for developing drug-induced liver injury in humans. Drug Discovery Today 2016, 21 (4), 648–653. 10.1016/j.drudis.2016.02.015. [DOI] [PubMed] [Google Scholar]
- Akoglu H. User’s guide to correlation coefficients. Turk. J. Emerg. Med. 2018, 18 (3), 91–93. 10.1016/j.tjem.2018.08.001. [DOI] [PMC free article] [PubMed] [Google Scholar]
Associated Data
This section collects any data citations, data availability statements, or supplementary materials included in this article.