

Abstract

Hematopoietic progenitor kinase 1 (HPK1) serves a key immunosuppressive role as a negative regulator of T-cell receptor (TCR) signaling. HPK1 loss-of-function is associated with augmentation of immune function and has demonstrated synergy with immune checkpoint inhibitors in syngeneic mouse cancer models. These data offer compelling evidence for the use of selective small molecule inhibitors of HPK1 in cancer immunotherapy. We identified a novel series of isoquinoline HPK1 inhibitors through fragment-based screening that displayed promising levels of biochemical potency and activity in functional cell-based assays. We used structure-based drug design to introduce key selectivity elements while simultaneously addressing pharmacokinetic liabilities. These efforts culminated in a molecule demonstrating subnanomolar biochemical inhibition of HPK1 and strong in vitro augmentation of TCR signaling in primary human T-cells. Further profiling of this molecule revealed excellent kinase selectivity (347/356 kinases <50% inhibition @ 0.1 μM), a favorable in vitro safety profile, and good projected human pharmacokinetics.
Keywords: HPK1, kinase inhibitor, MAP4K1, cancer immunology
The approval and use of immunomodulatory agents in oncology have transformed cancer treatment over the past decade.1 Starting with the approval of CTLA-4 and PD-1/PD-L1 antibodies in 2014 and 2015, the cancer immunotherapy (CI) field has gained significant attention. While many successful CI treatments are monoclonal antibodies, small molecules offer opportunities to target intracellular pathways inaccessible to large molecules.2
One such target is hematopoietic progenitor kinase 1 (HPK1), also known as MAP4K1. HPK1, a member of the Ste20 serine/threonine kinase family, negatively regulates T-cell receptor (TCR) signaling by phosphorylating and degrading the SH2 domain containing leukocyte protein of 76 kDa (SLP76).3 Inhibiting HPK1 is expected to enhance CI agents by amplifying TCR signaling. Encouragingly, HPK1 kinase-dead knock-in mice show increased TCR signaling and cytokine production, and synergy between HPK1 loss-of-function and immune checkpoint inhibitors has been demonstrated in mouse models.4 Based on these data, we aimed to discover small molecule inhibitors of HPK1 that could be combined with immune checkpoint inhibitors for treating CI-refractory cancers.5 Here, we describe the development of GNE-6893, a potent and selective HPK1 inhibitor with favorable pharmacokinetic properties in preclinical species.
Our efforts began with compound 1 (Figure 1), identified through an SPR fragment screen using an HPK1 kinase domain construct. This compound showed promising biochemical potency, inhibiting HPK1 kinase activity with a Ki of 4.9 nM. In Jurkat cells, compound 1 inhibited anti-CD3/anti-CD28-induced SLP76 phosphorylation with an IC50 of 280 nM. A key functional readout of HPK1 inhibition is elevated IL2 secretion in primary human T-cells after treatment with the compound and stimulation with anti-CD3 and anti-CD28. Compound 1 induced a nearly 5-fold increase in IL2 production compared to that in untreated cells. However, further development was complicated by two issues: (1) the IL2 assay dose–response curve displayed a bell shape, and (2) the cyclopropyl amide moiety was prone to non-NADPH-dependent hydrolytic cleavage, leading to high turnover rates in human liver microsomes and hepatocytes (Figure 1).
Figure 1.
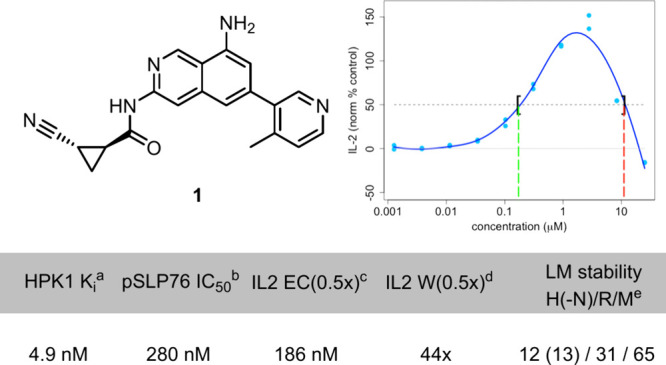
Initial lead compound 1: biochemical and cellular potency, including primary human T-cell IL2 assay, and liver microsome stability. aHTRF enzymatic assay (n > 2). bJurkat cell assay measuring phosphorylation of SLP76. cPrimary human T-cell assay measuring IL2 secretion after CD3/CD28 stimulation and compound treatment; IL2 EC(0.5×) = the concentration at which the response surpasses 50% of the response of a control compound (green dotted line). dIL2 W(0.5×) = the ratio of the concentration at which the response passes below 50% of the control compound (red dotted line) and the IL2 EC(0.5×). eLM = liver microsome predicted clearance (mL/min/kg), H = Human, R = Rat, M = Mouse, N = NADPH.
Bell-shaped dose–response curves present significant challenges for efficacy and clinical development. Such curves do not allow for maximal functional activation of the TCR pathway throughout a dosing regimen, except for compounds with an exceptionally long half-life. Moreover, at the highest concentrations tested, many molecules, including compound 1, suppress IL2 concentrations below baseline levels, which would be antagonistic to checkpoint inhibitors and would complicate combination therapies. These complications are further amplified by patient-to-patient variability in the exposure, half-life, and pathway sensitivity. Therefore, maximizing the IL2 curve width was a critical goal in our optimization of the HPK1 inhibitors.
We hypothesized that the bell-shaped dose–response curve could result from polypharmacology, i.e., inhibition of any one of the multiple off-target kinases (or other proteins or pathways) that positively regulate IL2 expression, thereby antagonizing the T-cell augmentation effects of HPK1 inhibition at higher compound concentrations. Notably, structurally diverse HPK1 inhibitors with different kinome selectivity profiles all showed bell-shaped IL2 curves, but a significant degree of overall selectivity for HPK1 is uniformly required before enhancement of IL2 production is observed.5b We attempted to deconvolve the selectivity data from a panel of molecules to determine if specific off-target kinases could be responsible for the IL2 suppression effect but were unable to reach a satisfactory conclusion. However, a few key kinases were identified whose inhibition should be specifically avoided. Among these, we identified Lck, a signaling kinase upstream of HPK1 in the TCR signaling pathway, as a critical antitarget.6 HPK1 inhibitors with poor Lck selectivity nearly invariably showed poor response in the IL2 assay. However, while a significant selectivity ratio for HPK1 over Lck (typically >200-fold) is necessary, it is not sufficient to achieve robust enhancement of IL2 production in stimulated human T-cells in vitro (Supporting Information, Figure S1).
Although the absence of any one specific off-target was initially challenging, we interpret the bell-shaped IL2 response curve as an integrated readout of proteome-wide selectivity. Depicted in Figure 2 is the theoretical relationship between the on-target and off-target activity on the IL2 curve. The green curve represents the theoretical sigmoidal on-target activity of a perfectly selective HPK1 inhibitor on IL2 secretion, while the red curves represent the theoretical off-target activity of the same molecule on any and all antagonistic targets. Notably, in this analysis, “activity” refers to functional activity on the IL2 pathway in primary human T cells and, as such, accounts for any and all complexities of biochemical-to-cell and target-binding-to-functional-effect shifts.
Figure 2.

Modeling of a bell-shaped dose–response curve by combination of HPK1 inhibition and antagonistic off-target effect. A/B (left): Predicted dose–response curves for two hypothetical compounds: A – equivalent potencies for inhibition of HPK1 (green curve) and unknown antagonistic off-target (red curve); B – compound with 100× selectivity between HPK1 and off-target. Solid blue line shows combined effect as observed increase in IL2 production above stimulated non-compound-treated cells. C/D (right): Illustration of the use of reference compound normalization to compare IL2 peak width for compounds inducing different maximal response; IL2 level is normalized relative to the maximal level produced by reference compound. Compound doses generating an IL2 response equal to half-maximal control compound response are estimated for the activating (EC(0.5×), green dashed line) and inhibitory (IC(0.5×), red dashed line) components of the dose–response curve. The ratio W(0.5×) (black arrow) indicates the relative selectivity window.
The composite effect of the agonistic and antagonistic activities for compounds with different degrees of selectivity is illustrated by the blue curves in Figure 2. Based on this analysis, the span of the curve can be utilized as a metric that denotes selectivity for HPK1 over all other immunosuppressive off-targets. Therefore, we defined three parameters: EC(0.5×), the concentration required to induce an increase of IL2 equivalent to the half-maximal effect of the reference compound; IC(0.5×), the inhibitory concentration at which IL2 production is decreased to half-maximal effect of the reference compound; and W(0.5×), the peak width, or ratio between the effective and inhibitory concentrations.
We sought to improve the selectivity of 1 with a structure-based design while simultaneously addressing the PK liabilities of the amide solvent-exposed group. An X-ray cocrystal structure of the compound bound to the HPK1 kinase domain showed the expected interactions of the aminoisoquinoline with the hinge region (Figure 3A). The C8 amine forms two apparent hydrogen bonds, one with the hinge (Glu92) and the other with the methionine gatekeeper residue (Met91). The pyridine occupies the hydrophobic back pocket and forms a key hydrogen bond with catalytic Lys46. We also observed an unusual “folded” conformation of the P-loop that brings the backbone N–H of Gly24 into close proximity with the carbonyl oxygen of the inhibitor.7,8
Figure 3.

Optimization of the solvent-exposed region. (A) X-ray crystal structure of cyclopropyl amide 1 in HPK1 kinase domain with the targeted Gly24 interaction highlighted. (B) Pyrazole analog 2 establishing the key H-bond. (C) Pyrazole-lactam analog 3, using conformational constraint to reinforce the Gly24 H-bond. aHTRF enzymatic assay (n > 2). bJurkat cell assay measuring phosphorylation of SLP76. cPrimary human T-cell assay measuring IL2 secretion after CD3/CD28 stimulation and compound treatment; IL2 EC(0.5×) = the concentration at which the response surpasses 50% of the response of a control compound (green dotted line). dIL2 W(0.5×) = the ratio of the concentration at which the response passes below 50% of the control compound (red dotted line) and the IL2 EC(0.5×). eLM = liver microsome predicted clearance (mL/min/kg), H = Human, R = Rat, M = Mouse, N = NADPH.
We anticipated that the position of this hydrogen bond donor would be unique to the small subset of kinases capable of adopting P-loop folded conformations. Moreover, previous studies have suggested that targeting of P-loop folded kinase conformations can inherently afford inhibitors with improved selectivity profiles.9 In some X-ray cocrystal structures, a water-mediated hydrogen bond is observed between the carbonyl of the cyclopropyl amide and the backbone N–H of Gly24 (data not shown), indicating that the residue is well poised to form specific interactions. Pyrazole 2 (Figure 3B) was designed to carefully place the nitrile group in a position that would allow for a hydrogen bond with Gly24. A second advantage of the pyrazole design is the removal of the amide chemotype, which presented a hydrolysis liability.
A C8 fluorine substituent was additionally added for two purposes. First, the electron-withdrawing and steric-blocking effects of the electronegative atom were intended to mitigate potential oxidative bioactivation of the anilinic moiety, which we viewed as a possible toxicity risk for this series of molecules. Second, the steric and stereoelectronic influence of the fluorine was intended to partially shield one of the polarized N–H bonds to improve permeability and bioavailability.10
We were gratified to see that 2 maintained reasonable potency and eliminated the non-NADPH-dependent turnover of the molecule in HLM. X-ray costructures of 2 confirmed that the hydrogen bond with Gly24 was maintained (data not shown). We attributed the relative loss in potency of 2 vs 1 to (1) conformational flexibility of the solvent-exposed group and (2) reduced H-bond donor strength of the aminopyrazole relative to the corresponding amide.
Encouraged by these observations, we recognized the potential to improve the potency of 2 by limiting the conformational flexibility of the cyanomethyl group. We designed lactam 3 (Figure 3C) to reduce the number of rotatable bonds in the solvent-exposed region of the molecule while placing the carbonyl H-bond acceptor proximal to the Gly24 N–H. This change afforded a 10-fold improvement in pSLP76 potency and 20-fold reduction in EC(0.5×). Moreover, the functional selectivity, reflected by W(0.5×), improved by more than 10-fold, reflecting an improvement in selectivity driven by on-target potency gained from targeting the folded P-loop.
Compound 3 represented an attractive starting point for further optimization. Although we were encouraged by the improvement in pSLP76 potency and IL2 potency/width relative to starting point 1, we sought further improvements in both potency and selectivity in an effort to improve the projected human dose while maximizing target-driven activation of the immune response. Turning again to structure-based design, we identified opportunities for potential interactions in the back pocket, specifically targeting residue Asp155 of the DFG motif (Asp155, Phe156, and Gly157) for hydrogen bonding. Addition of an amino group onto the pyridine of 3 afforded molecule 4 (Figure 4).
Figure 4.

(A) X-ray crystal structure of aminopyridine 4 in the HPK1 kinase domain. (B) Biochemical and cellular potency of 4, including primary human T-cell IL2 assay, permeability, hepatocyte stability, and in vivo PK (rat and mouse). aHTRF enzymatic assay (n > 2). bJurkat cell assay measuring phosphorylation of SLP76. cPrimary human T-cell assay measuring IL2 secretion after CD3/CD28 stimulation and compound treatment; IL2 EC(0.5×) = the concentration at which the response surpasses 50% of the response of a control compound (green dotted line). dIL2 W(0.5×) = the ratio of the concentration at which the response passes below 50% of the control compound (red dotted line) and the IL2 EC(0.5×). eMDCK permeability assay (apical-to-basolateral, cm/s × 10–6). fHep stability = hepatocyte predicted clearance (mL/min/kg), H = human, R = Rat, M = Mouse. gRat PK: Sprague–Dawley, 0.5 mg/kg i.v. dose, plasma clearance measured in mL/min/kg, Vss = volume of distribution (L/kg), t1/2 = i.v. half-life (measured in h). hMouse PK: C57BL/6, 1 mg/kg i.v. dose or 25 mg/kg p.o. dose, blood clearance measured in mL/min/kg.
An X-ray cocrystal structure of 4 bound to HPK1 validated our structure-based design hypotheses (Figure 4). Here, we observe the aminoisoquinoline core of the molecule forming familiar hydrogen-bonding interactions with the hinge region. The pyrazole-lactam group in the solvent-exposed region adopts a puckered conformation, placing the amide carbonyl in an optimal position to accept a hydrogen bond from Gly24. Moreover, the aminopyridine back pocket moiety forms interactions with both catalytic Lys46 and Asp155 of the DFG (Figure 4A).
These structural modifications resulted in significantly improved IL2 response for 4 compared to 3, including a modest gain in potency (11 nM EC(0.5×)) and nearly 10-fold improvement in selectivity (>2700× W(0.5×)). However, in vivo PK experiments revealed that the compound exhibited no bioavailability and short half-life in rodents, with observed clearance near or higher than liver blood-flow, possibly attributable to transporter-mediated clearance (Figure 4B).
Challenges with permeability and rodent PK were common features of molecules within the pyrazole-lactam subseries. Notably, calculated logD models regularly overestimated the lipophilicity of these molecules, attesting to the unexpectedly high polarity of the conformationally constrained amide. High TPSA (127 Å2) and high aromatic ring count (4) likely further contributed to poor ADME properties. Efforts to improve permeability and/or rodent PK in this scaffold while maintaining potency and selectivity were generally unsuccessful.
These challenges prompted us to rethink our approach within this series. More specifically, although the lactam substituent (e.g., 3) offers more than 60-fold improvement in potency compared to the N-methylpyrazole matched pair (data not shown), this potency comes at the cost of six heavy atoms and a nearly 60-fold reduction in permeability. In contrast, the back pocket amino group interacting with Asp155 offers a 12-fold improvement in potency (3 vs 4) but does so with the addition of only one heavy atom and a 10-fold reduction in permeability. It is noteworthy that these groups have similar impacts on logD, the TPSA (Table S5) contribution from the lactam is slightly smaller than that from the amino group, and the amino group offers two additional hydrogen bond donors compared to zero donors for the lactam. The dramatic and counterintuitive divergence in permeability between these matched pairs helps to further illustrate the unusual polarity of this particular lactam. This analysis suggested that the lactam piece was likely proving an overall liability to these molecules, with the negative impact on ADME properties outweighing the gains in potency and selectivity.
Our strategy next shifted to the identification of a new solvent-exposed group that would avoid the ADME liabilities of the pyrazole-lactam without reintroducing the hydrolytic instability of the cyclopropyl amide series. We anticipated that this strategy would first involve a reduction in potency but hoped that improved PK properties would allow for more flexibility in optimization of the back pocket group. As a key design parameter, previous experience had suggested that polarization of the N–H bond via aryl or acyl groups was essential for productive hydrogen bonding with the hinge. We identified carbamates as a group that could potentially fulfill this requirement while avoiding the enzymatic hydrolysis that plagued cyclopropyl amide molecules. We also hypothesized that the carbamate oxygen could maintain the water-mediated H-bond with Gly24 sometimes seen in the cyclopropyl amide subseries, which would help to maintain the desired P-loop folded conformation of the protein.
Carbamates are often considered PK liabilities, owing to their frequent use as prodrug moieties or as reactive covalent inhibitors.11 Indeed, many types of carbamates are rapidly cleaved by hydrolytic enzymes.12 However, analyses of carbamate metabolic stability have suggested that alkyl-O-C(O)-NHAryl carbamates are particularly robust,13 and others have demonstrated that amide-to-carbamate transformations can have a positive impact on the hydrolytic stability of small molecules in this context.14 With regard to the specific carbamate O-substituent, we first targeted THP carbamate 5. Here, we hoped that the α-branching would help to slow hydrolysis while the addition of the cyclic ether could reduce the oxidative metabolism of the aliphatic C–H bonds through its electron-withdrawing effects.
Initial returns for compound 5 were promising (Figure 5). Although we observed the expected reduction in biochemical and cell potency, this was accompanied by a reduced biochemical-to-cell shift. We attributed this effect to improved permeability, which also had a positive influence on ADME properties for this molecule compared to those of 4. More specifically, 5 showed a good correlation between in vitro and in vivo clearance in rat and mouse, along with a significantly improved half-life and high bioavailability in rat. We were also pleased to observe no turnover in liver microsomes incubated without addition of NADPH, validating our hypothesis that carbamates of this type could prove stable to enzymatic hydrolysis.
Figure 5.

Seminal carbamate 5: biochemical and cellular potency, including primary human T-cell IL2 assay, permeability, hepatocyte stability, and in vivo PK (rat and mouse). aHTRF enzymatic assay (n > 2). bJurkat cell assay measuring phosphorylation of SLP76. cPrimary human T-cell assay measuring IL2 secretion after CD3/CD28 stimulation and compound treatment; IL2 EC(0.5×) = the concentration at which the response surpasses 50% of the response of a control compound (green dotted line). dIL2 W(0.5×) = the ratio of the concentration at which the response passes below 50% that of the control compound (red dotted line) and the IL2 EC(0.5×). eMDCK permeability assay (apical-to-basolateral, cm/s × 10–6). fHep stability = hepatocyte-predicted clearance (mL/min/kg), H = human, R = Rat, M = Mouse. gRat PK: Sprague–Dawley, 0.5 mg/kg i.v. dose, plasma clearance measured in mL/min/kg, Vss = volume of distribution (L/kg), t1/2 = i.v. half-life (measured in h). hMouse PK: C57BL/6, 1 mg/kg i.v. dose or 25 mg/kg p.o. dose, blood clearance measured in mL/min/kg.
We next hoped to leverage the improved PK of carbamate 5 to allow for further optimization of the back pocket substituent to improve potency and selectivity. Specifically, we sought to design groups that would push toward the DFG motif, inducing a conformational change from the active DFG-in form to the inactive DFG-out.15
This change in protein conformation could potentially afford additional selectivity and would provide opportunities for increasing potency as the hydrophobic back pocket is enlarged by movement of the DFG.16 We designed morpholinopyridine 6 to simultaneously push on the DFG motif while placing the N–H bond of the morpholine proximal to Asn142, which we hoped to engage in a hydrogen bond (Figure 6).
Figure 6.

Morpholinopyridine analog 6: biochemical and cellular potency, including primary human T-cell IL2 assay, permeability, hepatocyte stability, and in vivo PK (rat and mouse). aHTRF enzymatic assay (n > 2). bJurkat cell assay measuring phosphorylation of SLP76. cPrimary human T-cell assay measuring IL2 secretion after CD3/CD28 stimulation and compound treatment; IL2 EC(0.5×) = the concentration at which the response surpasses 50% of the response of a control compound (green dotted line). dIL2 W(0.5×) = the ratio of the concentration at which the response passes below 50% that of the control compound (red dotted line) and the IL2 EC(0.5×). eMDCK permeability assay (apical-to-basolateral, cm/s × 10–6). fHep stability = hepatocyte predicted clearance (mL/min/kg), H = human, R = Rat, M = Mouse. gRat PK: Sprague–Dawley, 0.5 mg/kg i.v. dose, plasma clearance measured in mL/min/kg, Vss = volume of distribution (L/kg), t1/2 = i.v. half-life (measured in h). hMouse PK: C57BL/6, 1 mg/kg i.v. dose or 25 mg/kg p.o. dose, blood clearance measured in mL/min/kg.
These modifications afforded a greater than 25-fold improvement in biochemical potency and a 6-fold improvement in cellular potency (compound 6 vs compound 5). Most importantly, IL2 assay potency (EC(0.5×) = 39 nM) and selectivity (W(0.5×) = 451×) were significantly improved. Rat and mouse half-lives after i.v. dosing of 6 were similar to those with compound 5. Bioavailability was reduced, possibly attributable to the reduced kinetic solubility of 6 (1.5 μM) vs 5 (13 μM). In vitro metabolite ID experiments suggested that apparent carbamate hydrolysis was a significant route of metabolism. We recognized that this metabolite could arise through direct hydrolysis of the carbamate or through collapse of the hemiacetal intermediate produced by oxidative metabolism of the C–H bond adjacent to the carbamate oxygen. Both of these processes could potentially be slowed by addition of steric bulk about the carbamate oxygen. We elected to introduce this bulk in the form of a methyl group while also contracting the oxacycle to a tetrahydrofuran, resulting in compound GNE-6893 (Figure 7).
Figure 7.

Tool compound GNE-6893. (A) Cocrystal structure of GNE-6893 bound to HPK1 kinase domain. (B) Biochemical and cellular potency, including primary human T-cell IL2 assay, permeability, and hepatocyte stability. aHTRF enzymatic assay (n > 2). bJurkat cell assay measuring phosphorylation of SLP76. cPrimary human T-cell assay measuring IL2 secretion after CD3/CD28 stimulation and compound treatment; IL2 EC(0.5×) = the concentration at which the response surpasses 50% of the response of a control compound (green dotted line). dIL2 W(0.5×) = the ratio of the concentration at which the response passes below 50% that of the control compound (red dotted line) and the IL2 EC(0.5×). eMDCK permeability assay (apical-to-basolateral, cm/s × 10–6). fHep stability = hepatocyte predicted clearance (mL/min/kg), H = human, R = Rat, M = Mouse.
GNE-6893 further improved both cell potency and IL2 augmentation compared to 6, accompanied by a nearly 2-fold improvement in rat bioavailability. Notably, the compound demonstrates a window of more than 3000-fold between IL2 EC(0.5×) and IL2 IC(0.5×). A cocrystal structure of GNE-6893 bound to HPK1 revealed the critical interactions made by the carbamate moiety and the morpholinopyridine back pocket substituent. The former effectively mimics the hinge interactions of the cyclopropyl amide series and efficiently occupies the solvent-exposed pocket of the protein. Consistent with our hypothesis, the morpholinopyridine occupies an enlarged back pocket in the DFG-out conformation of the kinase. The pyridine nitrogen maintains a strong interaction with catalytic Lys46, while the morpholine moiety is within hydrogen-bonding distance of Asn142. The pyridine moiety also forms an apparent π-stacking interaction with Tyr28 in the P-loop. It is interesting to note that no direct nor water-mediated hydrogen-bonding interactions between the carbamate and Gly-24 backbone N–H were observed in the X-ray structure. We hypothesized that the interaction between the morpholinopyridine motif and Tyr28 was sufficient to stabilize the P-loop folded conformation.
Encouraged by the profile of this molecule, we next advanced it into dog PK and cyno PK studies (Table 1). ADME properties in the higher species were largely consistent with observations in rodents. In vivo clearance was well predicted by in vitro hepatocyte stability across all species, with volume of distribution consistently around 2.0 L/kg. Bioavailability was improved in higher species relative to rodents. Based on preclinical observations, we projected human clearance of 5.9 mL/min/kg, as predicted by in vitro human hepatocyte stability. Allometric scaling predicted a volume of distribution of 2.1 L/kg in human, resulting in a half-life of 4 h. Bioavailability was projected as 43%, based on the average of bioavailability in preclinical species.
Table 1. Preclinical PK and Projected Human PK of Compound GNE-6893.
| Species | LM CLhepa | Hep CLhepa | PPBb | CL | Vss (L/kg) | t1/2 (h) | %F |
|---|---|---|---|---|---|---|---|
| Mouse | 61 | 47 | 94.7 | 34 | 1.8 | 1.7 | 37 |
| Rat | 32 | 29 | 90.6 | 39 | 2.2 | 1.3 | 30 |
| Dogc | 19 | 14 | 85.8 | 14 | 2.2 | 2.5 | 46 |
| Cynod | 29 | 9.9 | 88.4 | 14 | 1.9 | 1.9 | 53 |
| Human (predicted) | 14 | 5.9 | 95.5 | (5.9) | (2.1) | (4.1) | (43) |
LM and Hep clearance values (mL/min/kg) represent arithmetic means of two or more determinations.
PPB = plasma protein binding (%).
Dog PK: Beagle, 0.5 mg/kg i.v. dose or 0.5 mg/kg p.o. dose, plasma clearance measured in mL/min/kg.
Cynomolgus Monkey PK: 0.5 mg/kg i.v. dose or 0.5 mg/kg p.o. dose, plasma clearance measured in mL/min/kg.
In order to better understand exposures needed for target engagement in a clinical setting, we measured the ability of compounds to inhibit the anti-CD3/anti-CD28 induced HPK1-mediated phosphorylation of SLP76 in human whole blood. This assay determined a whole blood pSLP76 IC50 of 320 nM. Based on the projected human PK of compound GNE-6893, we predicted that a 300 mg dose administered BID would cover the human whole blood pSLP76 IC50 at steady state Cmin.17
Further profiling revealed high kinase selectivity and a favorable in vitro safety profile. Kinase selectivity was assessed in a 356 kinase panel measuring percent inhibition at 100 nM concentration (>2000-fold above the HPK1 IC50, Figure 8). Notably, the GNE-6893 biochemical potency was below the assay threshold, meaning that true biochemical selectivity may be higher than we are able to measure. Here, only eight kinases were inhibited greater than 50%. We further profiled the activity of the compound on these targets with full IC50 determination. Of these, Aurora B and LRRK2 were relatively weakly inhibited (46 nM and 31 nM, respectively). More strongly inhibited kinases came primarily from the MAP4K family, particularly GCK (1.3 nM, >69×) and GLK (0.72 nM, >40×). Significantly higher selectivity was observed against MAP4K4 (3.3 nM, >180×), MINK1 (3.6 nM, >200×), TNIK (2.3 nM, >120×), and KHS1 (3.1 nM, >170×).
Figure 8.

GNE-6893 kinase selectivity panel measured at 100 nM.
Selectivity vs nonkinase off-targets was assessed in an in vitro panel composed of 100 enzymes, channels, and receptors at 10 μM. The pharmacologic targets represented on the panel have important CNS, cardiovascular (CV), and/or gastrointestinal functions. Here, GNE-6893 inhibited binding to three targets (5-HT transporter, benzodiazepine receptor, and dopamine D4 receptor) at around 50%. GNE-6893 did not show significant inhibition of cardiac hERG (IC50 = 28 μM), NaV1.5, and CaV1.2 (estimated IC50 of Nav1.5 and CaV1.2 > 10 μM) and showed no significant cytotoxicity in primary human hepatocytes or human liver microtissues up to 100 μM. Taken together, these data suggest GNE-6893 is a selective inhibitor of HPK1.
A combination of structure- and property-based design was used to advance isoquinoline lead compound 1 to GNE-6893, a potent and selective HPK1 inhibitor with favorable pharmacokinetic and in vitro safety profiles. Critical to the success of this campaign was an understanding that the curve width in a primary human T-cell IL2 assay could be employed as a measure of kinase selectivity, resulting in high kinase selectivity and robust activation of T-cell signaling by GNE-6893. Moreover, the successful deployment of N-aryl-O-alkyl carbamates as amide isosteres highlights the unique physicochemical properties of this functional group and underscores the utility of carbamates as an important tool in a medicinal chemist’s arsenal.
Acknowledgments
We thank chemistry team members at Pharmaron Beijing for compound synthesis support. We also thank the Genentech Analytical Research, DMPK, Safety Assessment In Vivo Study and Investigative Toxicology Groups and Compound Management groups for their technical contributions. We thank Viva Biotech for protein production and structure work. The crystallographic data were collected with the support of Shanghai Synchrotron Radiation Facility, Beamline 18U. We also thank Thomas Brewer for his feedback.
Glossary
Abbreviations
- ADME
adsorption, distribution, metabolism, and excretion
- CD28
cluster of differentiation 28
- CD3
cluster of differentiation 3
- CI
cancer immunology
- CL
clearance
- CTLA-4
cytotoxic T-lymphocyte associated protein 4
- F%
fraction of orally administered drug that reached systemic circulation
- HPK1
hematopoietic progenitor kinase 1
- IL2
interleukin-2
- LM
liver microsomes
- MAP4K
mitogen-activated protein kinase kinase kinase kinase
- MDCK
Madin-Darby canine kidney cells
- NADPH
nicotinamide adenine dinucleotide phosphate
- PD-1/PD-L1
programmed cell death protein 1/programmed cell death ligand 1
- PK
pharmacokinetics
- PPB
plasma protein binding
- SLP76
SH2 domain containing leukocyte protein of 76 kDa
- t1/2
half-life
- TCR
T-cell receptor
- TPSA
topological polar surface area
- Vss
steady state volume of distribution
Data Availability Statement
Crystallographic information related to compounds 1, 4, and GNE-6893 are deposited into the PDB under the codes 9BIK, 9BJ1, and 9BI8, respectively.
Supporting Information Available
The Supporting Information is available free of charge at https://pubs.acs.org/doi/10.1021/acsmedchemlett.4c00319.
Experimental procedures, compound characterization, detailed kinase selectivity panel data for GNE-6893, and crystallographic statistics for protein cocrystal structures of 1, 4 and GNE-6893 (PDF)
The authors declare no competing financial interest.
Supplementary Material
References
- a Chen D. S.; Mellman I. Oncology meets immunology: the cancer-immunity cycle. Immunity 2013, 39, 1–10. 10.1016/j.immuni.2013.07.012. [DOI] [PubMed] [Google Scholar]; b Barbee M. S.; Ogunniyi A.; Horvat T. Z.; Dang T.-O. Current status and future directions of the immune checkpoint inhibitors ipilimumab, pembrolizumab, and nivolumab in oncology. Ann. Pharmacother. 2015, 49, 907–937. 10.1177/1060028015586218. [DOI] [PubMed] [Google Scholar]; c Sharma P.; Allison J. P. Immune checkpoint targeting in cancer therapy: toward combination strategies with curative potential. Cell 2015, 161, 205–214. 10.1016/j.cell.2015.03.030. [DOI] [PMC free article] [PubMed] [Google Scholar]
- a Mahoney K. M.; Rennert P. D.; Freeman G. J. Combination cancer immunotherapy and new immunomodulatory targets. Nat. Rev. Drug Discovery 2015, 14, 561–584. 10.1038/nrd4591. [DOI] [PubMed] [Google Scholar]; b Heffron T. P.; Chan B. K. Small molecules for cancer immunotherapy. Med. Chem. Rev. 2017, 52, 221–241. 10.29200/acsmedchemrev-v52.ch12. [DOI] [Google Scholar]
- a Hu M. C.; Qiu W. R.; Wang X.; Meyer C. F.; Tan T. H. Human HPK1, a novel human hematopoietic progenitor kinase that activates the JNK/SAPK kinase cascade. Genes Dev. 1996, 10, 2251–2264. 10.1101/gad.10.18.2251. [DOI] [PubMed] [Google Scholar]; b Sawasdikosol S.; Burakoff S. A perspective on HPK1 as a novel immuno-oncology drug target. Elife 2020, 9, e55122 10.7554/eLife.55122. [DOI] [PMC free article] [PubMed] [Google Scholar]
- Hernandez S.; Qing J.; Thibodeau R. H.; Du X.; Park S.; Lee H.-M.; Xu M.; Oh S.; Navarro A.; Roose-Girma M.; Newman R. J.; Warming S.; Nannini M.; Sampath D.; Kim J. M.; Grogan J. L.; Mellman I. The kinase activity of Hematopoietic Progenitor Kinase 1 is essential for the regulation of T cell function. Cell Rep. 2018, 25, 80–94. 10.1016/j.celrep.2018.09.012. [DOI] [PubMed] [Google Scholar]
- a Chen H.; Guan X.; He C.; Lu T.; Lin X.; Liao X. Current strategies for targeting HPK1 in cancer and the barriers to preclinical progress. Expert Opin. Ther. Targets 2024, 28, 237–250. 10.1080/14728222.2024.2344697. [DOI] [PubMed] [Google Scholar]; b Vara B. A.; Levi S. M.; Achab A.; Candito D. A.; Fradera X.; Lesburg C. A.; Kawamura S.; Lacey B. M.; Lim J.; Methot J. L.; Xu Z.; Xu H.; Smith D. M.; Piesvaux J. A.; Miller J. R.; Bittinger M.; Ranganath S. H.; Bennett D. J.; DiMauro E. F.; Pasternak A. Discovery of Diaminopyrimidine Carboxamide HPK1 Inhibitors as Preclinical Immunotherapy Tool Compounds. ACS Med. Chem. Lett. 2021, 12, 653–661. 10.1021/acsmedchemlett.1c00096. [DOI] [PMC free article] [PubMed] [Google Scholar]; c Yu E. C.; Methot J. L.; Fradera X.; Lesburg C. A.; Lacey B. M.; Siliphaivanh P.; Liu P.; Smith D. M.; Xu Z.; Piesvaux J. A.; Kawamura S.; Xu H.; Miller J. R.; Bittinger M.; Pasternak A. Identification of Potent Reverse Indazole Inhibitors for HPK1. ACS Med. Chem. Lett. 2021, 12, 459–466. 10.1021/acsmedchemlett.0c00672. [DOI] [PMC free article] [PubMed] [Google Scholar]; d Sokolsky A.; Vechorkin O.; Hummel J. R.; Styduhar E. D.; Wang A.; Nguyen M. H.; Ye H. F.; Liu K.; Zhang K.; Pan J.; Ye Q.; Atasoylu O.; Behshad E.; He X.; Conlen P.; Stump K.; Ye M.; Diamond S.; Covington M.; Yeleswaram S.; Yao W. Potent and Selective Biaryl Amide Inhibitors of Hematopoietic Progenitor Kinase 1 (HPK1). ACS Med. Chem. Lett. 2023, 14, 116–112. 10.1021/acsmedchemlett.2c00241. [DOI] [PMC free article] [PubMed] [Google Scholar]; e Wang M. S.; Wang Z. Z.; Li Z. L.; Gong Y.; Duan C. X.; Cheng Q. H.; Huang W.; Yang G. F. Discovery of Macrocycle-based HPK1 Inhibitors for T-Cell-based Immunotherapy. J. Med. Chem. 2023, 66, 611–626. 10.1021/acs.jmedchem.2c01551. [DOI] [PubMed] [Google Scholar]; f Ye Q.; Liu K.; Ye H.; Pan J.; Sokolsky A.; Wang A.; Zhang K.; Hummel J. R.; Kong L.; Behshad E.; He X.; Conlen P.; Stump K.; Ye M.; Diamond S.; Covington M.; Yeleswaram S.; Atasoylu O.; Vechorkin O.; Yao W. Discovery of Pyrazolopyridine Derivatives as HPK1 Inhibitors. ACS Med. Chem. Lett. 2023, 14, 5–10. 10.1021/acsmedchemlett.2c00238. [DOI] [PMC free article] [PubMed] [Google Scholar]; g Zhu Q.; Chen N.; Tian X.; Zhou Y.; You Q.; Xu X. Hematopoietic Progenitor Kinase 1 in Tumor Immunology: A Medicinal Chemistry Perspective. J. Med. Chem. 2022, 65, 8065–8090. 10.1021/acs.jmedchem.2c00172. [DOI] [PubMed] [Google Scholar]
- Strauss D. B.; Weiss A. Genetic evidence for the involvement of the lck tyrosine kinase in signal transduction through the T cell antigen receptor. Cell 1992, 70, 585–593. 10.1016/0092-8674(92)90428-F. [DOI] [PubMed] [Google Scholar]; h You D.; Hillerman S.; Locke G.; Chaudhry C.; Stromko C.; Murtaza A.; Fan Y.; Koenitzer J.; Chen Y.; Briceno S.; Bhadra R.; Duperret E.; Gullo-Brown J.; Gao C.; Zhao D.; Feder J.; Curtin J.; Degnan A. P.; Kumi G.; Wittman M.; Johnson B. M.; Parrish K. E.; Gokulrangan G.; Morrison J.; Quigley M.; Hunt J. T.; Salter-Cid L.; Lees E.; Sanjuan M. A.; Liu J. Enhanced antitumor immunity by a novel small molecule HPK1 inhibitor. J. Immunother. Cancer 2021, 9, e001402 10.1136/jitc-2020-001402. [DOI] [PMC free article] [PubMed] [Google Scholar]; i Wu F.; Li H.; An Q.; Sun Y.; Yu J.; Cao W.; Sun P.; Diao X.; Meng L.; Xu S. Discovery of 7H-Pyrrolo[2,3-d]pyrimidine derivatives as potent hematopoietic progenitor kinase 1 (HPK1) inhibitors. Eur. J. Med. Chem. 2023, 254, 115355. 10.1016/j.ejmech.2023.115355. [DOI] [PubMed] [Google Scholar]
- Chan B. K.; Seward E.; Lainchbury M.; Brewer T. F.; An L.; Blench T.; Cartwright M. W.; Chan B. K. Y.; Choo E. F.; Drummond J.; Elliott R. L.; Gancia E.; Gazzard L.; Hu B.; Jones G. E.; Luo X.; Madin A.; Malhotra S.; Moffat J. G.; Pang J.; Salphati L.; Sneeringer C. J.; Stivala C. E.; Wei B.; Wang W.; Wu P.; Heffron T. P. Discovery of Spiro-azaindoline Inhibitors of Hematopoietic Progenitor Kinase 1(HPK1). ACS Med. Chem. Lett. 2022, 13, 84–91. 10.1021/acsmedchemlett.1c00473. [DOI] [PMC free article] [PubMed] [Google Scholar]
- Wu P.; Sneeringer C. J.; Pitts K. E.; Day E. S.; Chan B. K.; Wei B.; Lehoux I.; Mortara K.; Li H.; Wu J.; et al. Hematopoietic Progenitor Kinase-1 Structure in a Domain-Swapped Dimer. Structure 2019, 27, 125–133. 10.1016/j.str.2018.10.025. [DOI] [PubMed] [Google Scholar]
- a Collie G. W.; Michaelides I. N.; Embrey K.; Stubbs C. J.; Börjesson U.; Dale I. L.; Snijder A.; Barlind L.; Song K.; Khurana P.; Phillips C.; Storer R. I. Structural Basis for Targeting the Folded P Loop Conformation of c-MET. ACS Med. Chem. Lett. 2021, 12, 162–167. 10.1021/acsmedchemlett.0c00392. [DOI] [PMC free article] [PubMed] [Google Scholar]; b Guimarães C. R.; Rai B. K.; Munchhof M. J.; Liu S.; Wang J.; Bhattacharya S. K.; Buckbinder L. Understanding the impact of the P-loop conformation on kinase selectivity. J. Chem. Inf. Model. 2011, 51, 1199–1204. 10.1021/ci200153c. [DOI] [PubMed] [Google Scholar]
- Gillis E. P.; Eastman K. J.; Hill M. D.; Donnelly D. J.; Meanwell N. A. Applications of Fluorine in Medicinal Chemistry. J. Med. Chem. 2015, 58, 8315–8359. 10.1021/acs.jmedchem.5b00258. [DOI] [PubMed] [Google Scholar]
- Bachovchin D. A.; Cravatt B. F. The pharmacological landscape and therapeutic potential of serine hydrolases. Nat. Rev. Drug Discov 2012, 11, 52–68. 10.1038/nrd3620. [DOI] [PMC free article] [PubMed] [Google Scholar]
- Ghosh A. K.; Brindisi M. Organic Carbamates in Drug Design and Medicinal Chemistry. J. Med. Chem. 2015, 58, 2895–2940. 10.1021/jm501371s. [DOI] [PMC free article] [PubMed] [Google Scholar]
- Vacondio F.; Silva C.; Mor M.; Testa B. Qualitative structure-metabolism relationships in the hydrolysis of carbamates. Drug Metab. Rev. 2010, 42, 551–589. 10.3109/03602531003745960. [DOI] [PubMed] [Google Scholar]
- Li D.; Deng Y.; Achab A.; Bharathan I.; Hopkins B. A.; Yu W.; Zhang H.; Sanyal S.; Pu Q.; Zhou H.; Liu K.; Lim J.; Fradera X.; Lesburg C. A.; Lammens A.; Martinot T. A.; Cohen R. D.; Doty A. C.; Ferguson H.; Nickbarg E. B.; Cheng M.; Spacciapoli P.; Geda P.; Song X.; Smotrov N.; Abeywickrema P.; Andrews C.; Chamberlin C.; Mabrouk O.; Curran P.; Richards M.; Saradjian P.; Miller J. R.; Knemeyer I.; Otte K. M.; Vincent S.; Sciammetta N.; Pasternak A.; Bennett D. J.; Han Y. Carbamate and N-Pyrimidine Mitigate Amide Hydrolysis: Structure-Based Drug Design of Tetrahydroquinoline IDO1 Inhibitors. ACS Med. Chem. Lett. 2021, 12, 389–396. 10.1021/acsmedchemlett.0c00525. [DOI] [PMC free article] [PubMed] [Google Scholar]
- Liu Y.; Gray N. S. Rational design of inhibitors that bind to inactive kinase conformations. Nat. Chem. Biol. 2006, 2, 358–364. 10.1038/nchembio799. [DOI] [PubMed] [Google Scholar]
- a Vijayan R. S. K.; He P.; Modi V.; Duong-Ly K. C.; Ma H.; Peterson J. R.; Dunbrack R. L.; Levy R. M. Conformational Analysis of the DFG-Out Kinase Motif and Biochemical Profiling of Structurally Validated Type II Inhibitors. J. Med. Chem. 2015, 58, 466–479. 10.1021/jm501603h. [DOI] [PMC free article] [PubMed] [Google Scholar]; b Schröder M.; Bullock A. N.; Fedorov O.; Bracher F.; Chaikuad A.; Knapp S. DFG-1 Residue Controls Inhibitor Binding Mode and Affinity, Providing a Basis for Rational Design of Kinase Inhibitor Selectivity. J. Med. Chem. 2020, 63, 10224–10234. 10.1021/acs.jmedchem.0c00898. [DOI] [PubMed] [Google Scholar]
- This projection is based on estimated human PK and in vitro pharmacological evaluation of GNE-6893. Exact exposures required for PD and efficacy must be informed by in vivo models and experiments that are beyond the scope of this disclosure.
Associated Data
This section collects any data citations, data availability statements, or supplementary materials included in this article.
Supplementary Materials
Data Availability Statement
Crystallographic information related to compounds 1, 4, and GNE-6893 are deposited into the PDB under the codes 9BIK, 9BJ1, and 9BI8, respectively.