

Abstract

DNA-encoded library (DEL) technology, especially when combined with machine learning (ML), is a powerful method to discover novel inhibitors. DEL-ML can expand a larger chemical space and boost cost-effectiveness during hit finding. Heme oxygenase-1 (HO-1), a heme-degrading enzyme, is linked to diseases such as cancer and neurodegenerative disorders. The discovery of five series of new scaffold HO-1 hits is reported here, using a DEL-ML workflow, which emphasizes the model’s uncertainty quantification and domain of applicability. This model exhibits a strong extrapolation ability, identifying new structures beyond the DEL chemical space. About 37% of predicted molecules showed a binding affinity of KD < 20 μM, with the strongest being 141 nM, amd 14 of those molecules displayed >100-fold selectivity for HO-1 over heme oxygenase-2 (HO-2). These molecules also showed structural novelty compared to existing HO-1 inhibitors. Docking simulations provided insights into possible selectivity rationale.
Keywords: DNA-encoded library, Machine learning, Heme oxygenase-1 hits, Selectivity, Novel scaffold
Heme oxygenase (HO) degrades heme into biliverdin, Fe2+ and carbon monoxide. The HO family comprises the major isozymes HO-1 and HO-2, of which HO-1 is an inducible enzyme regulated by diverse stress stimuli, including pro-oxidants and pro-inflammatory mediators.1 HO-2 is broadly expressed in many tissues, including the brain, testis and liver, and functions to maintain iron homeostasis and regulate redox metabolism and cellular messaging.1 Studies have shown anti-inflammatory and antioxidant roles of HO-1, which implied that HO-1 could be a potential target in some chronic inflammation diseases.2−4 In addition to its cytoprotective role in various oxidative stress environments, HO-1 is also deemed as an emerging target for cancer therapy.5 HO-1 overexpression is often observed in prostate, renal, colon, lung, breast and glioma cancers.6−11 Cancer disease progression and poor prognosis are also believed to be associated with HO-1’s high expression level.5,12 These studies implied the potential values of selective HO-1 inhibitors in some cancer therapy. The isoform HO-2 shares a 51% sequence identity and 70% similarity with HO-1, making it difficult to find highly selective inhibitors of HO-1 over HO-2. Although the search for HO-1 inhibitors started in the early 2000s,13 only two classes of HO-1 inhibitors have been reported to date: 1) Metalloporphyrins (Figure 1a) and analogues of heme (Figure 1b). This type of inhibitor usually binds to other heme-containing enzymes in humans and thus suffers from low selectivity and potential toxicity. 2) Azole-based derivatives (Figure 1c,d). This type of inhibitors often contains an azole substructure like imidazole, which is responsible for chelating iron in heme when binding with HO-1. However, the imidazole core is not amenable to modifications.12 Azole-based derivatives also suffer from low to moderate selectivity toward HO-2, with the most selective inhibitor possessing a selectivity index of 48.3.12,13 To date, there has been a lack of potent HO-1-selective molecules in the research community. Therefore, finding such highly selective HO-1-targeting molecules will provide invaluable chemical probes for researchers to further profile HO-1’s intricate biological role in human diseases.
Figure 1.

Structures of the two major types of HO-1 inhibitors.
DNA-encoded library (DEL) technology has evolved significantly since it was first proposed in 1992.14 The progress and application cases in drug discovery prove that DEL has become a widely used tool for hit identification, with an increasing number of clinical candidates originating from DEL screens. For instance, two DEL hits targeting RIPK115 and sEH16 from GSK have entered Phase 2a for clinical study. In collaboration with WuXi AppTec, Westlake University identified highly potent noncovalent inhibitors of SARS-CoV-2 3CLpro through DEL screening,17 which were further developed to clinical candidate WPV01. The molecule has reached Phase 3 clinical trials as of this writing. Moreover, DEL technology has expanded into new application areas in recent years, including covalent drug discovery18 and PROTACS.19
From a technical perspective, DEL offers unique advantages as a fast and cost-effective screening approach, especially for novel targets. Unlike conventional high-throughput screening (HTS) methods, with libraries often limited to a few million compounds, DEL harnesses the power of combinatorial chemistry. This enables the creation of diverse libraries with up to billions of chemically distinct compounds through successive chemical reactions, typically ranging from three to four rounds. Each DEL molecule’s unique DNA tag enables efficient affinity-based screening in a single tube. Potential binders to the protein of interest are enriched and identified through next-generation sequencing and tag-to-structure decoding. However, DEL is not without its challenges. A notable drawback is the requirement for resynthesis of discrete DNA-free molecules identified from the DEL library, a potentially lengthy process involving new reaction planning and material procurement. Recent efforts to improve DEL molecule confirmation include using affinity selection mass spectrometry (ASMS) with high-throughput parallel resynthesis of DNA-conjugated molecules for rapid validation of potential DEL hits.20 Advances in technology are increasingly bridging the gap between DEL screening data and the generation of discrete molecules for wet-lab confirmation.
The use of artificial intelligence, especially deep learning methods, to accelerate early drug discovery has attracted a great deal of attention in the field in recent years. DEL data are characterized by their volume and consistency within a single experiment where specific targets can be screened by billions of the DEL compounds under uniform conditions. Traditional postselection DEL data analysis, although it has proven its effectiveness in many successful cases, is still limited by the scale of molecules considered and the introduction of human bias, which makes it difficult to fully utilize the subtle patterns in the DEL selections.15 Besides, sometimes the identified DEL hits may have unfavorable physicochemical properties, like large molecular weights or high logP. McCloskey et al. have already shown that the implementation of deep learning models for DEL screening data can achieve high hit rates on several targets beyond the DEL chemical space.21 The final hits discovered by this method not only show novelty but also possess good physicochemical properties. Lim et al. further demonstrated a regression approach to learning for DEL enrichment.22 Although this method cannot generalize to new chemical structures, the models can effectively de-noise DEL data due to the novel uncertainty-aware loss function used during training.22 Recent efforts exploring usage of DEL data include a new paradigm, DEL-Dock,23 which combines target 3D structure information with ligand-based information about the DEL molecules. A compositional deep probabilistic model of DEL data, DEL-Compose, was also reported by this team recently.24 This model provides a robust tool for consideration of pharmacophore information for DEL data analysis.
Although numerous machine learning methods have been reported to mine the DEL data, no research achieving high selectivity over a counter target using DEL-based virtual screening was reported. Here, for novel and selective hits discovery of HO-1, we performed DEL screening and further trained a deep learning model accounting for HO-1’s selectivity over HO-2 using the DEL screening data. We then performed virtual screening in commercial libraries. The model showed a very high classification capability between negative and positive, with a precision-recall curve area under the curve (PRC-AUC) score of 0.95. Final validation results also implied that our model can find diverse high-affinity and high-selectivity hits for HO-1. A second round of hits expansion, done by testing multiple analogues of the 11 active hits, further identified 8 additional active analogues. Preliminary affinities investigation of analogues is also discussed.
To find highly selective hits of HO-1 over HO-2, HO-2 (ferric-heme bound form, Holo HO-2) was set as a counter target when performing DEL screening on HO-1 (ferric-heme bound form, Holo HO-1). We designed four different conditions encompassing the main target HO-1 and counter target HO-2 (Table 1). Conditions containing HO-1 and HO-1 plus its active-site inhibitor QC-308 were set for the identification of HO-1 all-site binders and HO-1 allosteric binders, respectively. The condition with protein HO-2 only was set as the counter condition, and a condition without any proteins was set as a No-Target-Control (NTC) or negative condition. Hits directly identified from this screening were also validated. Among them, binders were found under both conditions 1 and 2 (to be reported separately). For further data analysis and machine learning modeling, we use conditions 1 and 2 as positive conditions and conditions 3 and 4 as negative conditions.
Table 1. DEL Screening Condition Setup.
| Condition |
||||
|---|---|---|---|---|
| 1 | 2 | 3 | 4 | |
| Target | Holo HO-1 | Holo HO-1 | Holo HO-2 | NTC |
| Additives | – | 20 μM QC-308 | – | – |
We aimed to build a binary classification model. The DEL data thus need to be labeled into positives and negatives based on their screening results. HO-1 DEL screening data were preprocessed by a customized data curation workflow:
-
1)
Labeling. Among all of the experimental conditions, we first define the positive conditions and the negative conditions based on the screening objective and logic setup. For each of these conditions, the binders are identified based on their copy counts and calculated enrichment factors,25 of which the cutoff values are set to be greater than 5 in copy counts and greater than 10 in enrichment factors. The exact cutoff values vary based on different projects and their experimental criteria. Next, all of the identified binders are to be segregated into binary classes, either a positive class or a negative class. To do so, the binders identified from the negative conditions are first labeled as the negative class. The remaining binders from the positive conditions are then labeled as the positive class.
-
2)
Data removal or addition. Generally, DEL molecules with possible DNA tag-dependent binding will be removed from our data pool. These DEL molecules were identified by mixing DNA barcode-only libraries into our whole DEL library superpool before screening were performed.
-
3)
Down-sampling and oversampling. For DEL screening data, the major part of the data set will be negative data. The ratio of positive and negative data will be adjusted to about 1:10 by down-sampling negative data to help stabilize the model training against imbalanced data. The ratio of positive to negative data was not adjusted to 1:1 to create a balanced data set. This approach reflects the realistic screening scenario where typically only a small fraction of the library molecules are likely to be potential positives. To decrease the false positive rate of the final prediction, negative data were fed into the model as much as possible. Despite the negative data from the aforementioned negative conditions, we also added “naive DEL data”, which was washed away during DEL screening, into negative data set to increase the coverage of negative chemical space. Positive data were also oversampled based on their copy and enrichment performance to ensure that the highly enriched DEL molecules obtained higher weights during model training. When the negative data undergo down-sampling, the data are sampled by a predefined ratio in a library-by-library way. This method will make sure the amount of negative data decrease but maintains the scaffold diversity of negative data set. When oversampling the positive data, molecules with greater statistical confidence, based on copy counts or experimental reproducibility, were sampled multiple times to increase their weights during training.
-
4)
Enumeration. Finally, all of the processed DEL data will be enumerated to get their desired product SMILES. Molecules comprising the complete DEL warhead were used as our final training data. The final data set size was about 5.5 million. It would be applied to a graph neural network to train a classifier model.
First, a holdout data set representing 5% of the entire data was split from the original labeled data set to ensure unbiased evaluation of models. The remaining data set was split into training, validation and test data sets in a ratio of 8:1:1. All splits were done by a scaffold split method26 (Figure 2a). Although other splitting methods26 like random split, stratified split and time split, as well as cycle/synthon-based split22,24 designed for the DEL scenario, were reported, we found the scaffold split method offers an adequate solution when it comes to selecting models for best generalizability and potential ability to extrapolate beyond the DEL chemical space.
Figure 2.

Model training and performance. (a) Schematic diagram of the scaffold split method and model training workflow. After data curation, the entire data set was split into training, validation, test and holdout data set based on their scaffolds. The scaffold split method aims to maximize the scaffolds’ difference among 4 different data sets as much as possible. After that, molecules are converted into graphs and fed into graph neural network models for training. (b) Model performance. For every epoch, 4.52 million DEL data were fed into model training. After 50 epochs of training, three models converged to a stable performance with training loss lower than 0.07. The PRC-AUC scores of both test and holdout data sets were over 0.95.
A binary classifier model was trained after data curation. Here we chose a molecular graph as the representation of the structures. The use of graphical representation allows for the capture and integration of richer and more complex molecular features, including 2D structure, topology, atomic and bonding properties, etc. Representing molecules using graphs also has greater interpretability, which can help us to further analyze the relationship between predicted results and molecular substructure. Graph neural network was selected for the modeling. ReLU27 was chosen as the activation function, and dropout regularization was also applied during training to reduce possible overfitting. The model ensemble technique was applied with multiple model instances and training data samples. Three independent model initializations were used. Each model trained over 50 epochs, and the one epoch checkpoint with the highest validation PRC-AUC score was selected. Train loss was also monitored to see whether the models converged. At last, all three models reached a high average PRC-AUC score of ∼0.95 on validation, test and holdout data set (Figure 2b).
Virtual screening was then performed on commercial libraries, including WuXi Galaxi and Mcule. A model ensemble was used, and the final predicted positive hits were further analyzed by our proprietary compounds picking workflow, including uncertainty quantification (UQ) filter, physicochemical property filter, domain of applicability (DA) filter and in-house liability substructure filter. UQ aims to quantify the uncertainty or reliability of the model prediction. Ensemble prediction is a widely used method to calibrate the prediction uncertainty. For the three trained models, we computed the standard deviation of their predictions, denoted as Label_std, to quantify this uncertainty. The smaller the standard deviation, the more reliable is the model prediction. The prediction score after UQ calibration is calculated as the average label minus three times the standard deviation. Compounds with scores below 0.5 after UQ calibration were discarded. Lipinski’s Rule of Five is applied as the physicochemical property filter to favor the drug likeness. The domain of applicability filter aims to make sure the predicted compounds’ chemical space is not too far away from the training chemical space. Data-driven models excel at making accurate predictions within the same or similar chemical space as the training data. In practice, we eliminated 50% of the compounds that were least similar to the positive training data based on the calculation of their distance from the positive training data. Then diversity selection by clustering was also applied to ensure the structural diversity of selected compounds. The final compounds list was reviewed by medicinal chemists to ensure the removal of possible unstable or promiscuous hits. The chemical space distribution of these final compounds was visualized using the uniform manifold approximation and projection (UMAP) method,28 comparing them with the HO-1 positive training data set. Results showed that the final 392 picked compounds have a very diverse structure distribution (Figure 3a). Overlapping of some picked compounds with the training compounds (dots in red circle) on UMAP indicates that they are similar with training data in chemical space. We also discovered some other compounds (dots in blue circle) which are dissimilar with training data in chemical space. This visualization result demonstrated that our workflow can find potential hits beyond DEL chemical space. We further calculated the cosine distance distribution between the picked compounds and the training data set. Compounds were represented by feeding the structures into the trained model, and the last layer of the graph neural network was output as the embedding in the latent space. Then the similarity between compounds was measured by cosine similarity, eq (2) in the Supporting Information, of two compound representations. For all the picked compounds, we found their nearest neighbor in the positive training data set by calculating their similarities, which is defined as nearest neighbor similarity. Then the nearest neighbor distances (1 – nearest neighbor similarity) of the 392 picked compounds with training data set were shown by a density plot (Figure 3b). Two peaks in the density plot also showed results consistent with UMAP: similar and dissimilar compounds, compared with training data, were found at the same time in the final compounds list.
Figure 3.

Chemical space analysis of picked compounds. (a) UMAP analysis of picked compounds’ chemical space. Compounds were represented as Morgan fingerprint (ECFP6) and underwent dimension reduction and visualization by UMAP. (b) Nearest neighbor cosine distance distribution of picked compounds with a training set. Compounds were represented as latent space, and the cosine distance was calculated as 1 – cosine similarity.
From the top 50 potential binders suggested by the machine learning models, we purchased 32 compounds for subsequent surface plasmon resonance (SPR) binding analysis. These compound prediction scores are shown in Table S1. HO-1/2 proteins were synthesized as Avi-tagged constructs and immobilized on streptavidin sensor chips for SPR. Among the tested compounds, binding of 8 compounds (see Figure 4) to HO-1 or HO-2 was confirmed with SPR, with KD ranging from 141 nM to 11 μM (Table 2). Fitting curves of these active hits are presented in Figure S1.
Figure 4.

Eight validated hit structures from DEL-based virtual screening.
Table 2. SPR Data of 8 Validated Hits from Virtual Screeninga.
| Target |
||||
|---|---|---|---|---|
| HO-1 |
HO-2 | |||
| Compd | Fit model | KD (nM) | Fit model | KD (nM) |
| 2 | Steady state | 648 | Steady state | N.D. |
| 3 | Steady state | 5100 | Steady state | N.D. |
| 4 | Steady state | 141 | Steady state | N.D. |
| 5 | Steady state | 1420 | Steady state | N.D. |
| 6 | Steady state | 11000 | Steady state | N.D. |
| 6a | Steady state | 7590 | Steady state | N.D. |
| 7 | Steady state | 9290 | Steady state | N.D. |
| 8 | Steady state | 794 | Steady state | 119 |
N.D. = binding not detected.
Based on the discovery of the first 8 active hits, we further conducted a similarity search among compounds with UQ calibrated score (UQCS) greater than 0.5. UQCS is a prediction score calibrated with the UQ metric. Here we calculated the average score of 3 prediction scores from 3 models and their standard deviation. UQCS equals average score minus three times the standard deviation. Fingerprint (ECFP6) was used as a structure representation. Tanimoto similarities between these compounds and 8 active hits were calculated. Compounds were ranked by Tanimoto similarity, and the top 10% were selected (Tanimoto similarity ranging from 0.4 to 0.76) and finally reviewed by chemists to find close analogues of the 8 active hits. Finally, only 11 compounds were available from vendors, and we validated these compounds’ KD with HO-1 and HO-2 by SPR (Figure S2). Among them, 8 compounds (Figure 5) were found to have binding activities to HO-1 and the other 3 completely lost their binding activities (Table 3).
Figure 5.

Eleven compound structures in second-round hits validation.
Table 3. SPR Data of the Second-Round Hitsa.
| Target |
||||
|---|---|---|---|---|
| HO-1 |
HO-2 |
|||
| Compd | Fit model | KD (nM) | Fit model | KD (nM) |
| 2a | Steady state | N.D. | Steady state | N.D. |
| 2b | Steady state | N.D. | Steady state | N.D. |
| 3a | Steady state | 7930 | Steady state | N.D. |
| 3b | Steady state | 1840 | Steady state | N.D. |
| 3c | Steady state | 703 | Steady state | N.D. |
| 4a | Steady state | 692 | Steady state | N.D. |
| 4b | Steady state | 6920 | Steady state | N.D. |
| 5a | Steady state | 17100 | Steady state | 20800 |
| 7a | Steady state | 3790 | Steady state | N.D. |
| 7b | Steady state | 19800 | Steady state | N.D. |
| 7c | Steady state | N.D. | Steady state | N.D. |
N.D. = binding not detected.
Among the 43 purchased compounds, we collected all 16 active compounds and 7 of their analogues to explore their affinity and selectivity profiles (Table 4). There are at least 8 different scaffolds discovered, which can be further classified into 5 series (Figure 6, series A–E). Most of the scaffolds have at least 2 analogues. Although detailed SAR information needs to be obtained by testing more analogues of different scaffolds, we obtained a preliminary understanding of the affinity and selectivity profiles of some series because of their close similarity to each other. The tetrahydroimidazo[1,2-a]pyrazine scaffold (2, 2a, 2b) and tetrahydro-1H-pyrazolo[4,3-c]pyridine scaffold (3, 3a, 3c) have a high Tanimoto similarity of 0.84 (using MACCS key fingerprint). These 2 scaffolds share similar R1 substituents and fluorine- and amino-substituted benzene, so we represented their structures by a Markush structure series A (Figure 6). Similar methods were applied using other compounds shown in Table 4, and finally 4 other Markush structures series B–E were drawn (Figure 6). For series A and B, various substitutions can be tolerated, and some of the derivatives (3, 3a, 3b) showed high selectivity toward HO-1. 4 is the most potent HO-1 binder among all the 16 active compounds. This series also shows high selectivity toward HO-1. Most of compounds from series C (5, 5a, 5b) have a common diphenyl subgroup. This diphenyl group is an important pharmacophore of QC-308. We have also identified compounds with diphenyl groups directly from this DEL selection and validated them as true binders (data not disclosed). Since all the models’ training data were from the DEL chemical space, it is thus evident that the models effectively learned from the DEL structures that contain the key active subgroups and successfully discovered novel scaffolds containing such key diphenyl groups from the virtual catalogs. To better understand how much the QC-308 structure is represented in the models’ training data, we computed the Tanimoto distance of the QC-308 structure to all the model training data structures. The ECFP6 Tanimoto distance of QC-308 to the nearest training data structures was found to be 0.76, demonstrating that the models’ training data and QC-308 are structurally nonoverlapping. It is worth noting that 5 achieves high selectivity on HO-1 while that is not the case for 5a. This series of compounds are likely to bind to HO-1 in a similar pattern12 with QC-308 due to the structure similarity. Two phenyls locate in the “Western Region”, and the aromatic heterocyclic ring points to the heme (“Eastern Region”).12 This kind of binding may indicate a new optimization direction, modifying the “Eastern Region” but not the “Western Region” binding part for highly selective HO-1 binder development. Pyrrolidine- (series D, 6, 6a–6c) and quinoline- (series E, 7, 7a–7d) based derivatives showed affinity in the micromolar range. The quinoline scaffold may be also a promising HO-1-selective scaffold since all of its derivatives showed no binding to HO-2. Compound 8 has potent activity on HO-1 and even shows better potency on HO-2. Because of the unique scaffold it cannot be included in any of the 5 series mentioned above. Among all these 16 active HO-1 binders, 14 of them are highly selective toward HO-1.
Table 4. Activity Summary of 23 Tested Compounds from the Model Predictiona.
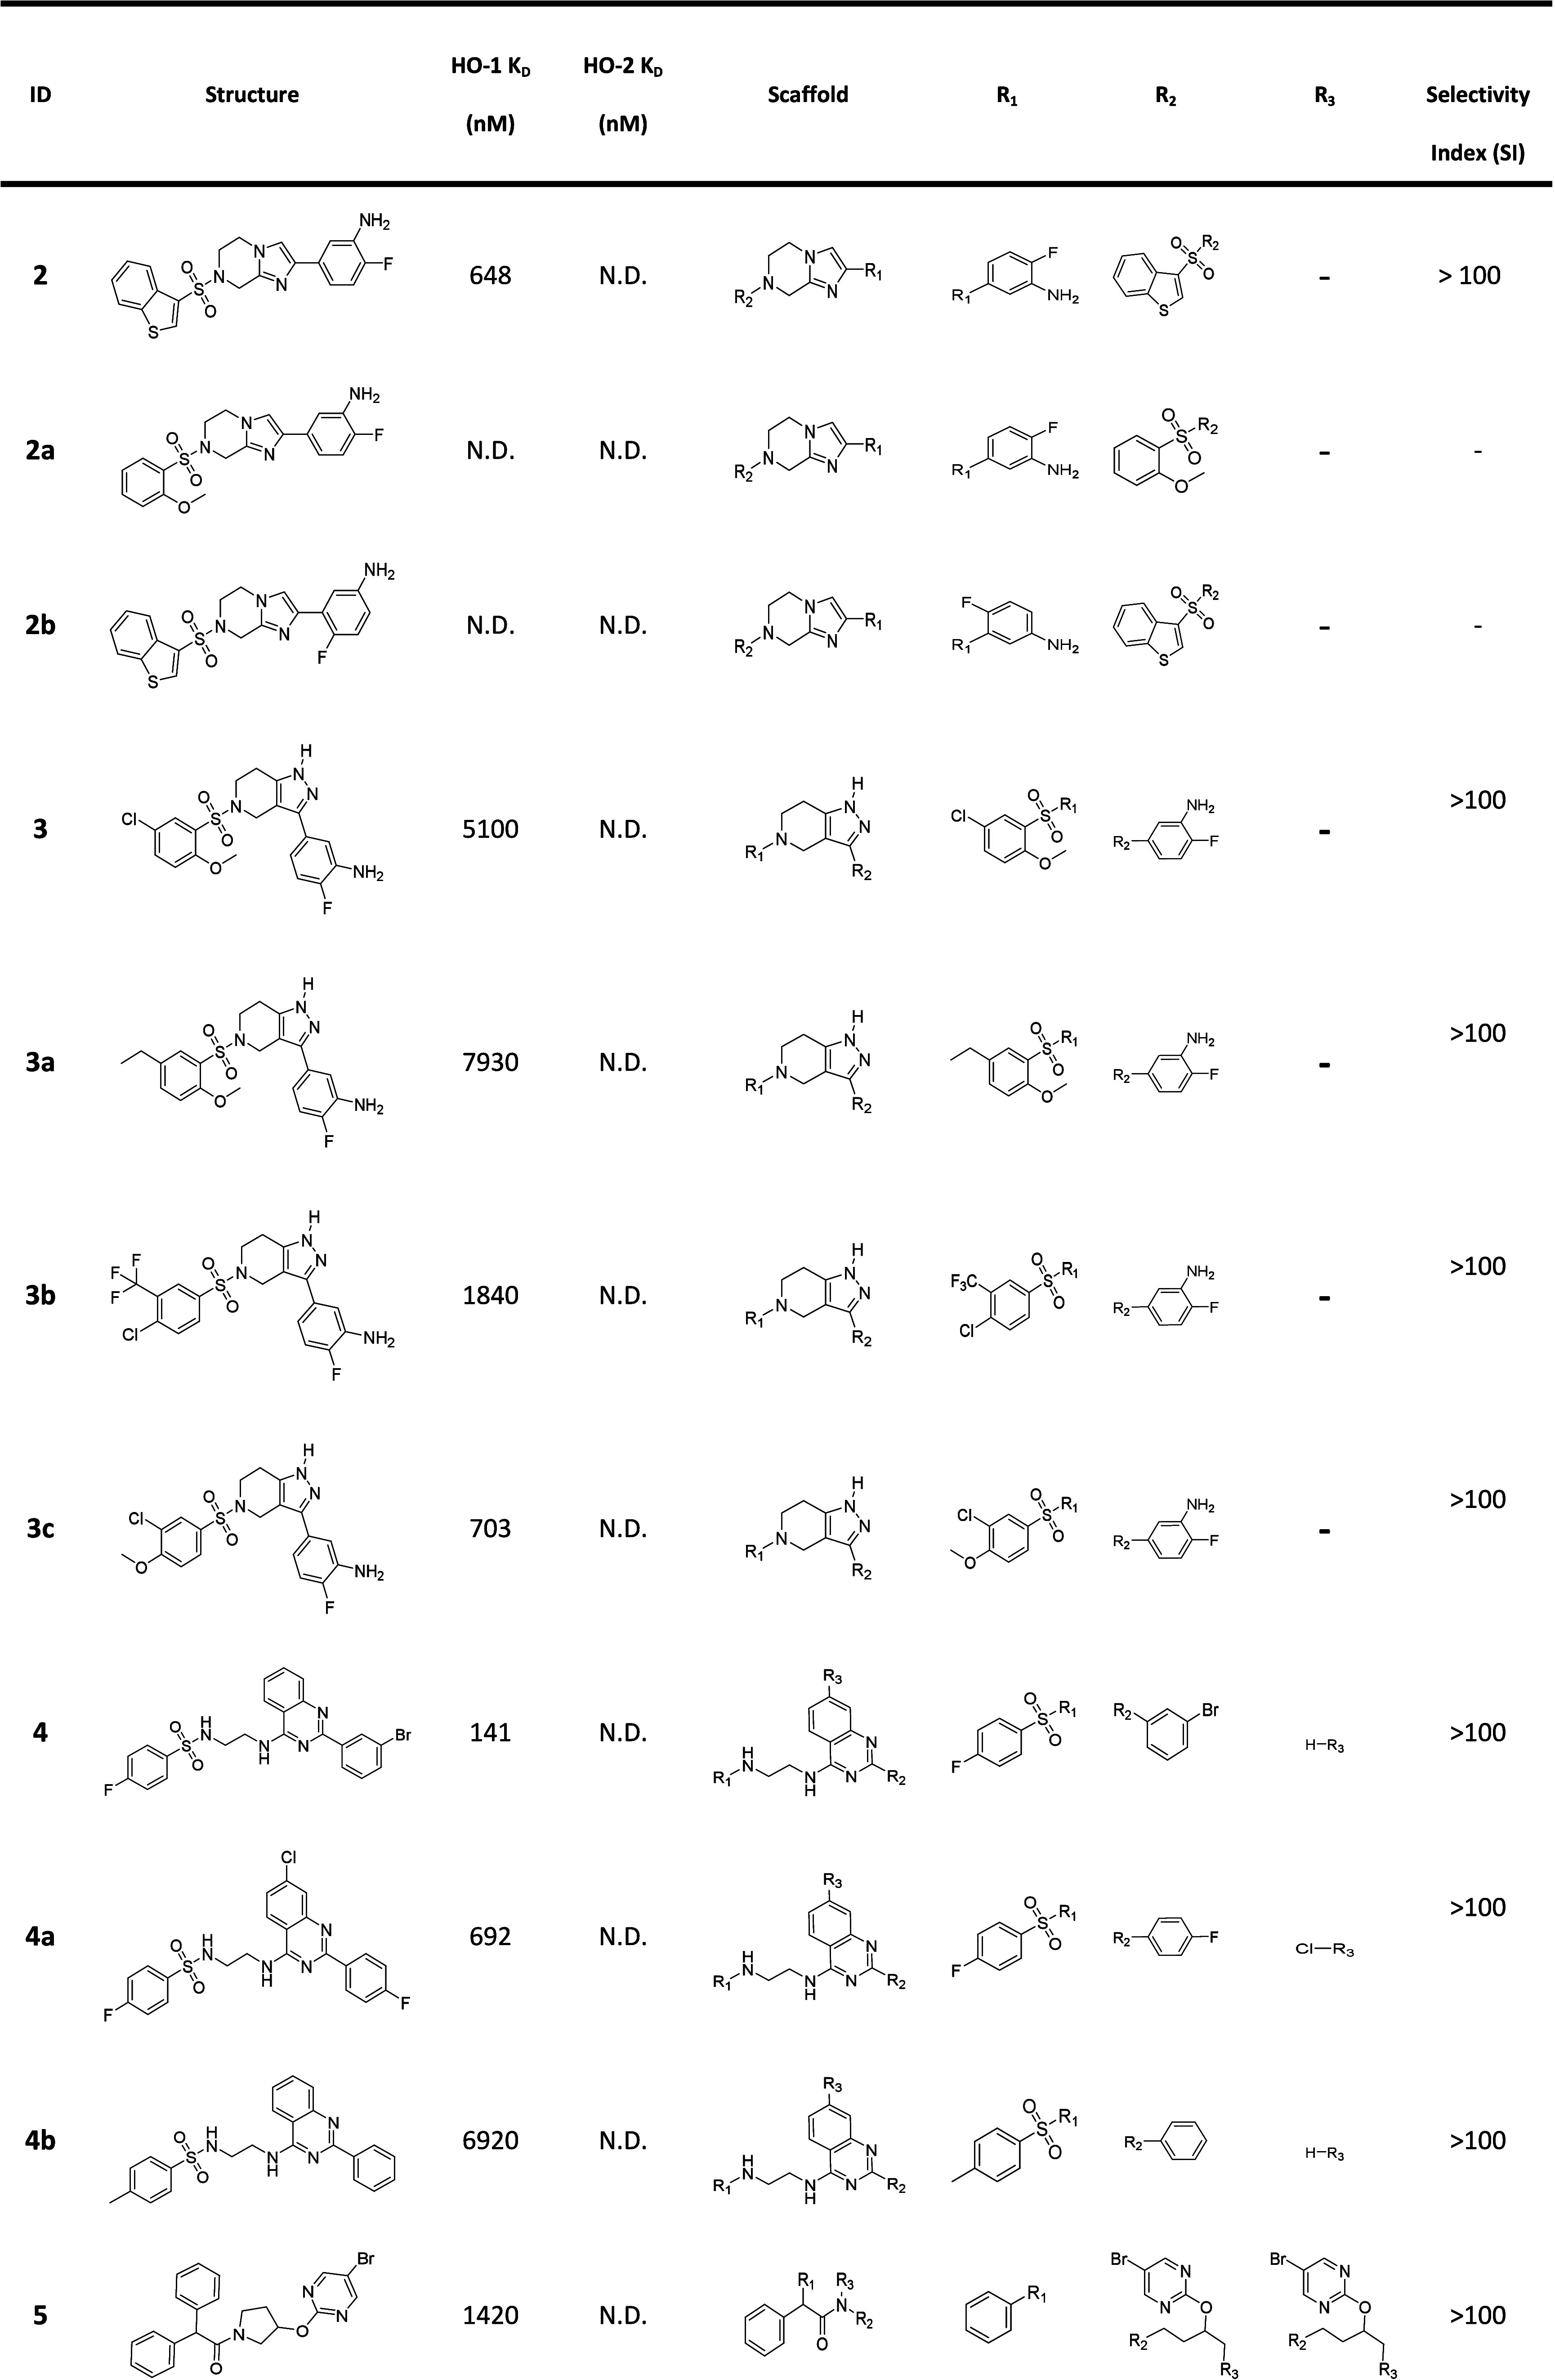

N.D.: Binding not detected.
Figure 6.

Five series summarized from 23 compounds structures.
In order to better understand the molecular interaction and selectivity profile of some series compounds, we performed molecular docking using MOE202231 to explore their possible binding modes. We chose the most potent hit compound, 4, to study its possible binding mode. Series B represents a highly selective scaffold toward HO-1, and compound 4’s binding mode may provide some insights for the selectivity profile of this series compounds. Compound 4 binds to HO-1 in a different binding mode compared with 3HOK’s original ligand QC-80 (Figure 7a). There is no metal chelating interaction between compound 4 and HO-1. The fluorine-substituted benzene of compound 4 inserts into the “Western Region” formed by residues Phe166, Leu54, Phe167, Val50 and Phe47, which is the main binding pocket of QC-80. A hydrogen bond is also observed between the sulfonamide of compound 4 and Arg136. Besides, the quinazoline of compound 4 stretches to the “Northeastern Region” formed by residues Ala28, Ala31, Glu32, Ile211 and Glu215, and occupies a similar pocket compared with QC-80. The bromine-substituted benzene of compound 4 partially occupies the “Western Region” of HO-1, which may be a unique binding mode of HO-1 inhibitors to date. By comparing the binding pocket of HO-1 and HO-2, we found that HO-2’s pocket volume (551 Å3, calculated by PyVol29) is smaller than HO-1’s (911 Å3, calculated by PyVol29). The heavy-atom distances between compound 4 and some key pocket residues like Arg156, Phe234, Phe53 and Phe57 are smaller than 3.5 Å (Figure 7b), which means clashes formed. It may explain the high selectivity profile of this scaffold toward HO-1. Taking advantage of the differences in the “Northeastern Region” in HO-1 and HO-2 may be a feasible way to design more selective HO-1 inhibitors.
Figure 7.

Binding pose simulations of 4 with HO-1 and HO-2 via docking. (a) Docking pose of 4 in HO-1 and pose alignment with QC-80. Protein residues are represented as gray sticks. QC-80 and 4 are colored green and magenta, respectively. The “Western Region” and “Northeastern Region” of HO-1 are shown by black and red labeled residues, respectively. The hydrogen bond is shown as a cyan dotted line. (b) Docking pose of 4 in HO-2. The green lines show the distances between 4 and some nearby residues.
In order to better understand the selectivity profile of the model, we conducted a retrospective study by comparing the performance between selective and nonselective models using 43 tested compounds. The nonselective model was trained by labeling DEL data enriched in conditions 1, 2, and 3 as positive data and that in condition 4 as negative data (Table 1). Then 3 nonselective models were trained by 50 epochs. Other hyperparameter settings (like learning rate, batch size, number of layers etc.) were the same as in previous selective models. Training loss and model performance after training are shown in Figure 8. Nonselective models showed reasonably good performance against holdout, validation and test data set (Figure 2). 43 compounds were predicted by 3 nonselective models, and 10 of them were predicted as positive (Table S2). Finally, only 2 compounds (6, 6a) were validated as selective binders. The success rate is 20%, while for selective models, 32.6% of the compounds (14 out of 43) were validated as selective binders. The 2 selective compounds predicted by nonselective models belong to series D. This result indicated that, although nonselective models perform very well in holdout data set PRC-AUC score, they still miss many important selective structure patterns like series A, B, C and E discovered by selective models. By simply setting the counter targets condition (in this case, HO-2) as negative and applying a similarity-based analogue finding approach, we finally identified 14 highly selective HO-1 binders among all 16 active HO-1 binders (KD < 20 μM). We observed that the training data set size of the nonselective model is larger than that of the selective model. The library distribution of these DEL data is also different between 2 models. Training data differences in both size and structural diversity can result in two very different models. From the biological perspective, although HO-1 and HO-2 share a high identity/similarity ratio of 51%/70% on sequence, they may still have other different binding pockets aside from the similar heme pocket according to the P2Rank (https://prankweb.cz/) pocket prediction. Selective and nonselective binders may bind to different binding sites, and this is the possible reason why data from selective and nonselective logic differ largely from each other, thus leading to 2 largely different models. This result may, at least in this case, prove the effectiveness of the selectivity strategy in our workflow.
Figure 8.

Nonselective models’ training loss and performance.
In order to evaluate the structural novelty of newly discovered hits from virtual screening, we compared the similarity between 16 active HO-1 hits (KD < 20 μM) and 2 representative HO-1 inhibitors (Azalanstat and QC-308). Both intact compounds and Bemis–Murcko scaffolds were used to calculate their similarities. Tanimoto similarity matrices using ECFP6 representation were generated as shown in Figure 7a,b. All hits coming from virtual screening have similarity scores below 0.3 compared with Azalanstat and QC-308 in terms of both intact compounds (Figure 9a) and Bemis–Murcko scaffolds (Figure 9b). Combined with further manual inspections by medicinal chemists, it is indicated that these newly discovered HO-1 hits are novel scaffold compounds.
Figure 9.

Structure novelty of 16 actives compared with 2 known HO-1 inhibitors. Similarity matrices between the 16 active hits’ (a) full structures and (b) Bemis–Murcko scaffolds and 2 known HO-1 inhibitors.
We further explored the relationship between tested compounds’ similarities to the nearest neighbor in positive training data set and cumulative hit rate in Figure 10, accordingly to a previously reported analysis method.21 When we used ECFP6 as the compound representation, we measured their nearest neighbor similarities by Tanimoto similarity with the result shown in Figure 10. When the Tanimoto similarity cutoff was 0.4, we still observed meaningful hit rates under different binding affinity cutoffs. The hits were enriched even though they were considered to be dissimilar by the traditional ECFP6/Tanimoto similarity from the positive training data set. This suggests that the mechanism underlying ML model predictions differs from that of traditional ECFP-based similarity searches, an observation consistent with recent reports indicating underwhelming hit rates using ECFP.21
Figure 10.
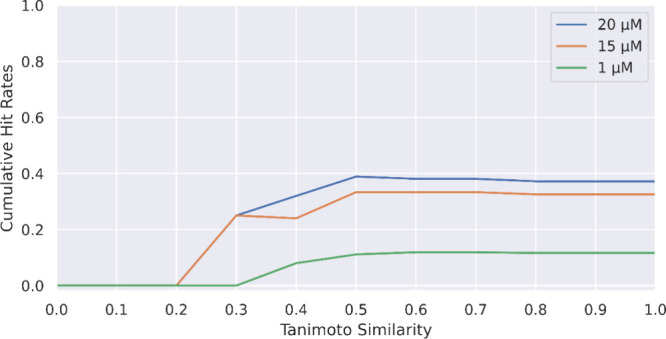
Cumulative hit rates under different activity cutoffs with x-axis of Tanimoto similarity of predicted active compounds (ECFP6) to the training DEL data set. This plot shows the hit rate (y-axis) among compounds with less than a specific similarity (x-axis) to the positive training set.
In summary, this study demonstrates the effectiveness of utilizing extensive DEL screening data in conjunction with deep learning models for the discovery of novel drug-like hits beyond the conventional DEL chemical space. Our approach, which incorporates selectivity information during the modeling process, has proven to be a successful strategy for identifying highly selective hits. Based on our observation, the ECFP6/Tanimoto similarity poorly correlated with the ML models’ hit rates, adding evidence that the deep learning approach differs from the mere fingerprint-based similarity search. Our method further demonstrated the ability to identify novel active scaffolds outside the original DEL chemical space. Although the current selectivity approach during modeling is qualitative, incorporating selectivity information by assigning counter target data as negative has been effective. Future work may explore more quantitative methods during deep learning modeling, such as using ratios between target condition enrichment and counter target condition enrichment. The discovery of five novel and selective series of HO-1 binders marks a significant step forward in the search for selective and potent HO-1 inhibitors.
Acknowledgments
We thank Wenhua Chen for DEL data analysis and project coordination and Yulong An for DEL library construction.
Glossary
Abbreviations
- HO-1
heme oxygenase-1
- HO-2
heme oxygenase-2
- DEL
DNA-encoded library
- ML
machine learning
- HTS
high-throughput screening
- ASMS
affinity selection mass spectrometry
- PRC-AUC
precision-recall curve area under curve
- SAR
structure–activity relationship
- UQ
uncertainty quantification
- DA
domain of applicability
- RO5
Lipinski’s Rule of Five
- UMAP
uniform manifold approximation and projection
- SPR
surface plasmon resonance
- UQCS
uncertainty quantification calibrated score
Supporting Information Available
The Supporting Information is available free of charge at https://pubs.acs.org/doi/10.1021/acsmedchemlett.4c00121.
SPR binding fitting curves and sensorgrams of 16 HO-1 hits; selective and nonselective models prediction scores on all 43 tested compounds; methods for DEL synthesis, screening, and sequencing analysis, ML model training, similarity/distance calculation and nearest neighbor, SPR, and molecular docking (PDF)
The authors declare no competing financial interest.
Special Issue
Published as part of ACS Medicinal Chemistry Lettersspecial issue “Exploring the Use of AI/ML Technologies in Medicinal Chemistry and Drug Discovery”.
Supplementary Material
References
- Campbell N. K.; Fitzgerald H. K.; Dunne A. Regulation of inflammation by the antioxidant haem oxygenase 1. Nat. Rev. Immunol 2021, 21 (7), 411–425. 10.1038/s41577-020-00491-x. [DOI] [PubMed] [Google Scholar]
- Chen S.; Wang X.; Nisar M. F.; Lin M.; Zhong J. L. Heme Oxygenases: Cellular Multifunctional and Protective Molecules against UV-Induced Oxidative Stress. Oxid Med. Cell Longev 2019, 2019, 5416728. 10.1155/2019/5416728. [DOI] [PMC free article] [PubMed] [Google Scholar]
- Lee T. S.; Chau L. Y. Heme oxygenase-1 mediates the anti-inflammatory effect of interleukin-10 in mice. Nat. Med. 2002, 8 (3), 240–6. 10.1038/nm0302-240. [DOI] [PubMed] [Google Scholar]
- Poss K. D.; Tonegawa S. Reduced stress defense in heme oxygenase 1-deficient cells. Proc. Natl. Acad. Sci. U. S. A. 1997, 94 (20), 10925–30. 10.1073/pnas.94.20.10925. [DOI] [PMC free article] [PubMed] [Google Scholar]
- Chau L. Y. Heme oxygenase-1: emerging target of cancer therapy. J. Biomed Sci. 2015, 22, 22. 10.1186/s12929-015-0128-0. [DOI] [PMC free article] [PubMed] [Google Scholar]
- Maines M. D.; Abrahamsson P. A. Expression of heme oxygenase-1 (HSP32) in human prostate: normal, hyperplastic, and tumor tissue distribution. Urology 1996, 47 (5), 727–33. 10.1016/S0090-4295(96)00010-6. [DOI] [PubMed] [Google Scholar]
- Goodman A. I.; Choudhury M.; da Silva J. L.; Schwartzman M. L.; Abraham N. G. Overexpression of the heme oxygenase gene in renal cell carcinoma. Proc. Soc. Exp Biol. Med. 1997, 214 (1), 54–61. 10.3181/00379727-214-44069. [DOI] [PubMed] [Google Scholar]
- Yin H.; Fang J.; Liao L.; Maeda H.; Su Q. Upregulation of heme oxygenase-1 in colorectal cancer patients with increased circulation carbon monoxide levels, potentially affects chemotherapeutic sensitivity. BMC Cancer 2014, 14, 436. 10.1186/1471-2407-14-436. [DOI] [PMC free article] [PubMed] [Google Scholar]
- Degese M. S.; Mendizabal J. E.; Gandini N. A.; Gutkind J. S.; Molinolo A.; Hewitt S. M.; Curino A. C.; Coso O. A.; Facchinetti M. M. Expression of heme oxygenase-1 in non-small cell lung cancer (NSCLC) and its correlation with clinical data. Lung Cancer 2012, 77 (1), 168–75. 10.1016/j.lungcan.2012.02.016. [DOI] [PMC free article] [PubMed] [Google Scholar]
- Noh S. J.; Bae J. S.; Jamiyandorj U.; Park H. S.; Kwon K. S.; Jung S. H.; Youn H. J.; Lee H.; Park B. H.; Chung M. J.; Moon W. S.; Kang M. J.; Jang K. Y. Expression of nerve growth factor and heme oxygenase-1 predict poor survival of breast carcinoma patients. BMC Cancer 2013, 13, 516. 10.1186/1471-2407-13-516. [DOI] [PMC free article] [PubMed] [Google Scholar]
- Gandini N. A.; Fermento M. E.; Salomon D. G.; Obiol D. J.; Andres N. C.; Zenklusen J. C.; Arevalo J.; Blasco J.; Lopez Romero A.; Facchinetti M. M.; Curino A. C. Heme oxygenase-1 expression in human gliomas and its correlation with poor prognosis in patients with astrocytoma. Tumour Biol. 2014, 35 (3), 2803–15. 10.1007/s13277-013-1373-z. [DOI] [PubMed] [Google Scholar]
- Fallica A. N.; Sorrenti V.; D’Amico A. G.; Salerno L.; Romeo G.; Intagliata S.; Consoli V.; Floresta G.; Rescifina A.; D’Agata V.; Vanella L.; Pittala V. Discovery of Novel Acetamide-Based Heme Oxygenase-1 Inhibitors with Potent In Vitro Antiproliferative Activity. J. Med. Chem. 2021, 64 (18), 13373–13393. 10.1021/acs.jmedchem.1c00633. [DOI] [PMC free article] [PubMed] [Google Scholar]
- Vlahakis J. Z.; Kinobe R. T.; Bowers R. J.; Brien J. F.; Nakatsu K.; Szarek W. A. Synthesis and evaluation of azalanstat analogues as heme oxygenase inhibitors. Bioorg. Med. Chem. Lett. 2005, 15 (5), 1457–61. 10.1016/j.bmcl.2004.12.075. [DOI] [PubMed] [Google Scholar]
- Brenner S.; Lerner R. A. Encoded combinatorial chemistry. Proc. Natl. Acad. Sci. U. S. A. 1992, 89 (12), 5381–3. 10.1073/pnas.89.12.5381. [DOI] [PMC free article] [PubMed] [Google Scholar]
- Harris P. A.; Berger S. B.; Jeong J. U.; Nagilla R.; Bandyopadhyay D.; Campobasso N.; Capriotti C. A.; Cox J. A.; Dare L.; Dong X.; Eidam P. M.; Finger J. N.; Hoffman S. J.; Kang J.; Kasparcova V.; King B. W.; Lehr R.; Lan Y.; Leister L. K.; Lich J. D.; MacDonald T. T.; Miller N. A.; Ouellette M. T.; Pao C. S.; Rahman A.; Reilly M. A.; Rendina A. R.; Rivera E. J.; Schaeffer M. C.; Sehon C. A.; Singhaus R. R.; Sun H. H.; Swift B. A.; Totoritis R. D.; Vossenkamper A.; Ward P.; Wisnoski D. D.; Zhang D.; Marquis R. W.; Gough P. J.; Bertin J. Discovery of a First-in-Class Receptor Interacting Protein 1 (RIP1) Kinase Specific Clinical Candidate (GSK2982772) for the Treatment of Inflammatory Diseases. J. Med. Chem. 2017, 60 (4), 1247–1261. 10.1021/acs.jmedchem.6b01751. [DOI] [PubMed] [Google Scholar]
- Belyanskaya S. L.; Ding Y.; Callahan J. F.; Lazaar A. L.; Israel D. I. Discovering Drugs with DNA-Encoded Library Technology: From Concept to Clinic with an Inhibitor of Soluble Epoxide Hydrolase. Chembiochem 2017, 18 (9), 837–842. 10.1002/cbic.201700014. [DOI] [PubMed] [Google Scholar]
- Hou N.; Shuai L.; Zhang L.; Xie X.; Tang K.; Zhu Y.; Yu Y.; Zhang W.; Tan Q.; Zhong G.; et al. Development of highly potent noncovalent inhibitors of SARS-CoV-2 3CLpro. ACS Central Science 2023, 9 (2), 217–227. 10.1021/acscentsci.2c01359. [DOI] [PMC free article] [PubMed] [Google Scholar]
- Li L.; Su M.; Lu W.; Song H.; Liu J.; Wen X.; Suo Y.; Qi J.; Luo X.; Zhou Y. B.; Liao X. H.; Li J.; Lu X. Triazine-Based Covalent DNA-Encoded Libraries for Discovery of Covalent Inhibitors of Target Proteins. ACS Med. Chem. Lett. 2022, 13 (10), 1574–1581. 10.1021/acsmedchemlett.2c00127. [DOI] [PMC free article] [PubMed] [Google Scholar]
- Chen Q.; Liu C.; Wang W.; Meng X.; Cheng X.; Li X.; Cai L.; Luo L.; He X.; Qu H.; Luo J.; Wei H.; Gao S.; Liu G.; Wan J.; Israel D. I.; Li J.; Dou D. Optimization of PROTAC Ternary Complex Using DNA Encoded Library Approach. ACS Chem. Biol. 2023, 18 (1), 25–33. 10.1021/acschembio.2c00797. [DOI] [PMC free article] [PubMed] [Google Scholar]
- Su W.; Ge R.; Ding D.; Chen W.; Wang W.; Yan H.; Wang W.; Yuan Y.; Liu H.; Zhang M.; Zhang J.; Shu Q.; Satz A. L.; Kuai L. Triaging of DNA-Encoded Library Selection Results by High-Throughput Resynthesis of DNA-Conjugate and Affinity Selection Mass Spectrometry. Bioconjug Chem. 2021, 32 (5), 1001–1007. 10.1021/acs.bioconjchem.1c00170. [DOI] [PubMed] [Google Scholar]
- McCloskey K.; Sigel E. A.; Kearnes S.; Xue L.; Tian X.; Moccia D.; Gikunju D.; Bazzaz S.; Chan B.; Clark M. A.; Cuozzo J. W.; Guie M. A.; Guilinger J. P.; Huguet C.; Hupp C. D.; Keefe A. D.; Mulhern C. J.; Zhang Y.; Riley P. Machine Learning on DNA-Encoded Libraries: A New Paradigm for Hit Finding. J. Med. Chem. 2020, 63 (16), 8857–8866. 10.1021/acs.jmedchem.0c00452. [DOI] [PubMed] [Google Scholar]
- Lim K. S.; Reidenbach A. G.; Hua B. K.; Mason J. W.; Gerry C. J.; Clemons P. A.; Coley C. W. Machine Learning on DNA-Encoded Library Count Data Using an Uncertainty-Aware Probabilistic Loss Function. J. Chem. Inf Model 2022, 62 (10), 2316–2331. 10.1021/acs.jcim.2c00041. [DOI] [PMC free article] [PubMed] [Google Scholar]
- Shmilovich K.; Chen B.; Karaletsos T.; Sultan M. M. DEL-Dock: Molecular Docking-Enabled Modeling of DNA-Encoded Libraries. J. Chem. Inf Model 2023, 63 (9), 2719–2727. 10.1021/acs.jcim.2c01608. [DOI] [PubMed] [Google Scholar]
- Chen B.; Sultan M. M.; Karaletsos T. Compositional Deep Probabilistic Models of DNA Encoded Libraries. J. Chem. Inf. Model. 2024, 64, 1123–1133. 10.1021/acs.jcim.3c01699. [DOI] [PubMed] [Google Scholar]
- Kuai L.; O’Keeffe T.; Arico-Muendel C. Randomness in DNA Encoded Library Selection Data Can Be Modeled for More Reliable Enrichment Calculation. SLAS Discov 2018, 23 (5), 405–416. 10.1177/2472555218757718. [DOI] [PubMed] [Google Scholar]
- Wu Z.; Ramsundar B.; Feinberg E. N.; Gomes J.; Geniesse C.; Pappu A. S.; Leswing K.; Pande V. MoleculeNet: a benchmark for molecular machine learning. Chem. Sci. 2018, 9 (2), 513–530. 10.1039/C7SC02664A. [DOI] [PMC free article] [PubMed] [Google Scholar]
- Agarap A. F. Deep learning using rectified linear units (relu). arXiv preprint 2018, arXiv:1803.08375. 10.48550/arXiv.1803.08375. [DOI] [Google Scholar]
- McInnes L.; Healy J.; Saul N.; Großberger L. UMAP: Uniform Manifold Approximation and Projection. Journal of Open Source Software 2018, 3 (29), 861. 10.21105/joss.00861. [DOI] [Google Scholar]
- Smith R. H. B.; Dar A. C.; Schlessinger A. PyVOL: a PyMOL plugin for visualization, comparison, and volume calculation of drug-binding sites. bioRxiv preprint 2019, 816702. 10.1101/816702. [DOI] [Google Scholar]
- Molecular Operating Environment (MOE), 2022.02, Chemical Computing Group, 2023. https://www.chemcomp.com/en/Products.htm [Google Scholar]
Associated Data
This section collects any data citations, data availability statements, or supplementary materials included in this article.