

Abstract
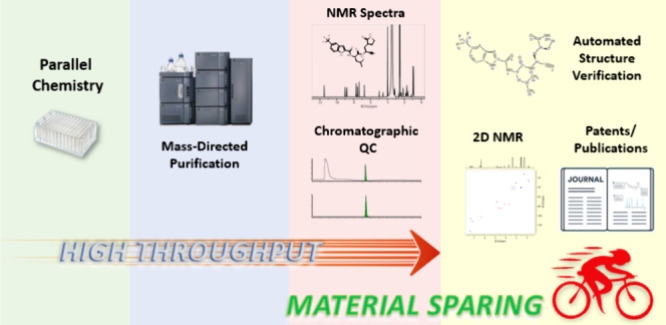
In medicinal chemistry, purification and characterization of organic compounds is an ever-growing challenge, with an increasing number of compounds being synthesized at a decreased scale of preparation. In response to this trend, we developed a parallel medicinal chemistry (PMC)-tailored platform, coupling automated purification to mass spectrometry (MS) and nuclear magnetic resonance spectroscopy (NMR) on a range of synthetic scales (∼3.0–75.0 μmol). Here, the generation and acquisition of 1.7 mm NMR samples is fully integrated into a high-throughput automated workflow, processing 36 000 compounds yearly. Utilizing dead volume, which is inaccessible in conventional liquid handling, NMR samples are generated on as little as 10 μg without consuming material prioritized for biological assays. As miniaturized PMC synthesis becomes the industry standard, we can now obtain quality NMR spectra from limited material. Paired with automated structure verification, this platform has the potential to allow NMR to become as important for high-throughput analysis as ultrahigh performance liquid chromatography (UPLC)-MS.
Keywords: NMR, MS, Automation, Synthesis, Chromatography, Parallel chemistry, Purification, Automated structure verification
Small molecule drugs are among the earliest pharmaceuticals but continue to dominate the market in modern medicine.1 Recent high-throughput screening (HTS) developments, exploration of new modes of action (MoAs)2 and compounds beyond Lipinski’s Rule of Five3 have led to the synthesis of ever increasing numbers of compounds.4 Importantly, medicinal chemistry needs analytical support to purify and provide structural verification on a high-throughput scale. To support synthetic efforts, Pfizer has a dedicated high-throughput drug discovery purification workflow, handling tens of thousands of compounds per year as part of a compound management service. After purification and characterization, compounds are typically submitted for biological testing, completing the typical design–make–test–analyze (DMTA) cycle.5−8
New frontiers of parallel medicinal chemistry (PMC) have allowed for more complex compounds to be synthesized in parallel on a smaller scale than ever before (Figure 1).9,10 Synthesizing compounds on the smallest feasible scale saves on costly intermediates but shifts the bottleneck downstream to purification and analysis, necessitating continuous improvements and implementation of new automation technologies to match.5,9,11−16
Figure 1.
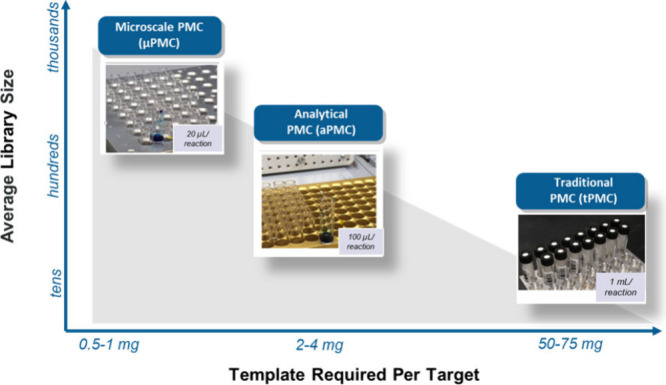
Driving synthesis and purification to lower scales to explore broader chemical space with a reduced template.
Purification and analytics must meet the demand of compound capacity while being as efficient and cost-effective as possible in the process.5,16−21 This implies conserving material by implementing automation wherever possible and obtaining reliable analytical data from the miniscule amount of material synthesized to support sound decision making by the project team.
Typical analytical techniques such as UPLC can be coupled to ultraviolet (UV), charged aerosol detection (CAD), or evaporative light scattering (ELS) detectors indicating compound purity, quantifying the recovery of the compound, and measuring hydrophobicity, respectively.22−24 When coupled to mass spectrometry (MS), these techniques provide molecular mass information but lack structure-based details essential to identify structures without ambiguity, especially when the potential for multiple products exists. In addition, isomers such as epimers, regioisomers, or atropisomers cannot be discriminated.25 Nuclear magnetic resonance (NMR) provides such structure-based information to confirm target synthesis and has the potential to distinguish between potential isomers, and while orthogonal in many ways, it has several unique advantages compared to MS and UPLC.26−30
NMR acquisition and structure verification have conventionally been manual, time-consuming processes segmented from PMC and purification workflows due to a lack of appropriate throughput and lower sensitivity. The preference for a deuterated solvent and high concentrations renders it incompatible with traditional LC-MS workflows. As a result, NMR is typically not used as a first-round synthesis characterization technique despite providing structure-based information and being a nondestructive method. In addition to the practical need for structure verification in discovery, filing for patents and publishing in scientific journals require NMR spectroscopic data to corroborate claims. Routine acquisition of NMR spectra coupled to a purification workflow would prevent the need for compound resynthesis for the sole purpose of generating analytical data. High-throughput purification approaches have already been developed. An automated workflow on microscale for the purification of PMC samples via charged aerosol detector (CAD) quantitation was developed by Novartis.9 It has an impressive purification turnaround time of 42 h for a set of 92 samples, addresses issues associated with the inaccuracy of gravimetric weighing at low scales, and has the ability to purify samples in PMC format, but it does not include NMR acquisition. A similar platform was developed a decade ago at Merck.31 This platform consists of automated, high-throughput purification of up to 100 PMC samples and boasts a purification cycle time of 4.5 days. AbbVie also developed a platform integrating HPLC purification with CAD quantification for small library sets of samples (22 samples in 15 h).24 In the two latter cases, the authors describe subtracting an aliquot for NMR in a 96-well plate format from the purified dimethyl sulfoxide (DMSO) stock solution without detailing these workflows. Additionally, multiple nanoscale PMC platforms have been developed.32,33 Most of these platforms utilize a direct-to-biology approach, and since NMR technology is currently not sensitive enough to characterize nanoscale samples, they are beyond the scope of this Letter.
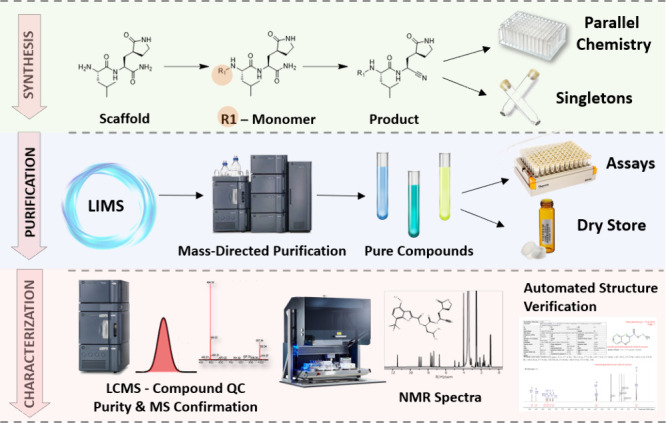
Herein we present a combined purification and NMR acquisition workflow (Figure 2) developed to prepare NMR samples from the volume inaccessible during high-throughput sample handling. Instead of discarding the dead volume, rescuing this portion of the sample allows for immediate NMR sample preparation in real time, integrating synthesis, purification, and NMR characterization into a single workflow.
Figure 2.
Scope and scale of the purification platform. Target compound confirmation requires analytical methods/data beyond LC-MS.
Suitable for a diverse range of compound properties, it is sensitive enough to be adaptable to multiple scales of synthesis and applicable to both singletons and PMC libraries. By avoiding subtracting material slated for biological assays, it reduces the DMTA cycle time and, most importantly, acquires crucial NMR data to enable complete data characterization of novel compounds during the first synthesis cycle.
To demonstrate the throughput and application of this workflow to PMC, an analytical PMC library (10 μmol) of compounds in the context of our oral protease program targeting the SARS-CoV-2 main protease34,35 was synthesized as described in Scheme 1.
Scheme 1. Synthesis of Compounds C3–C16.
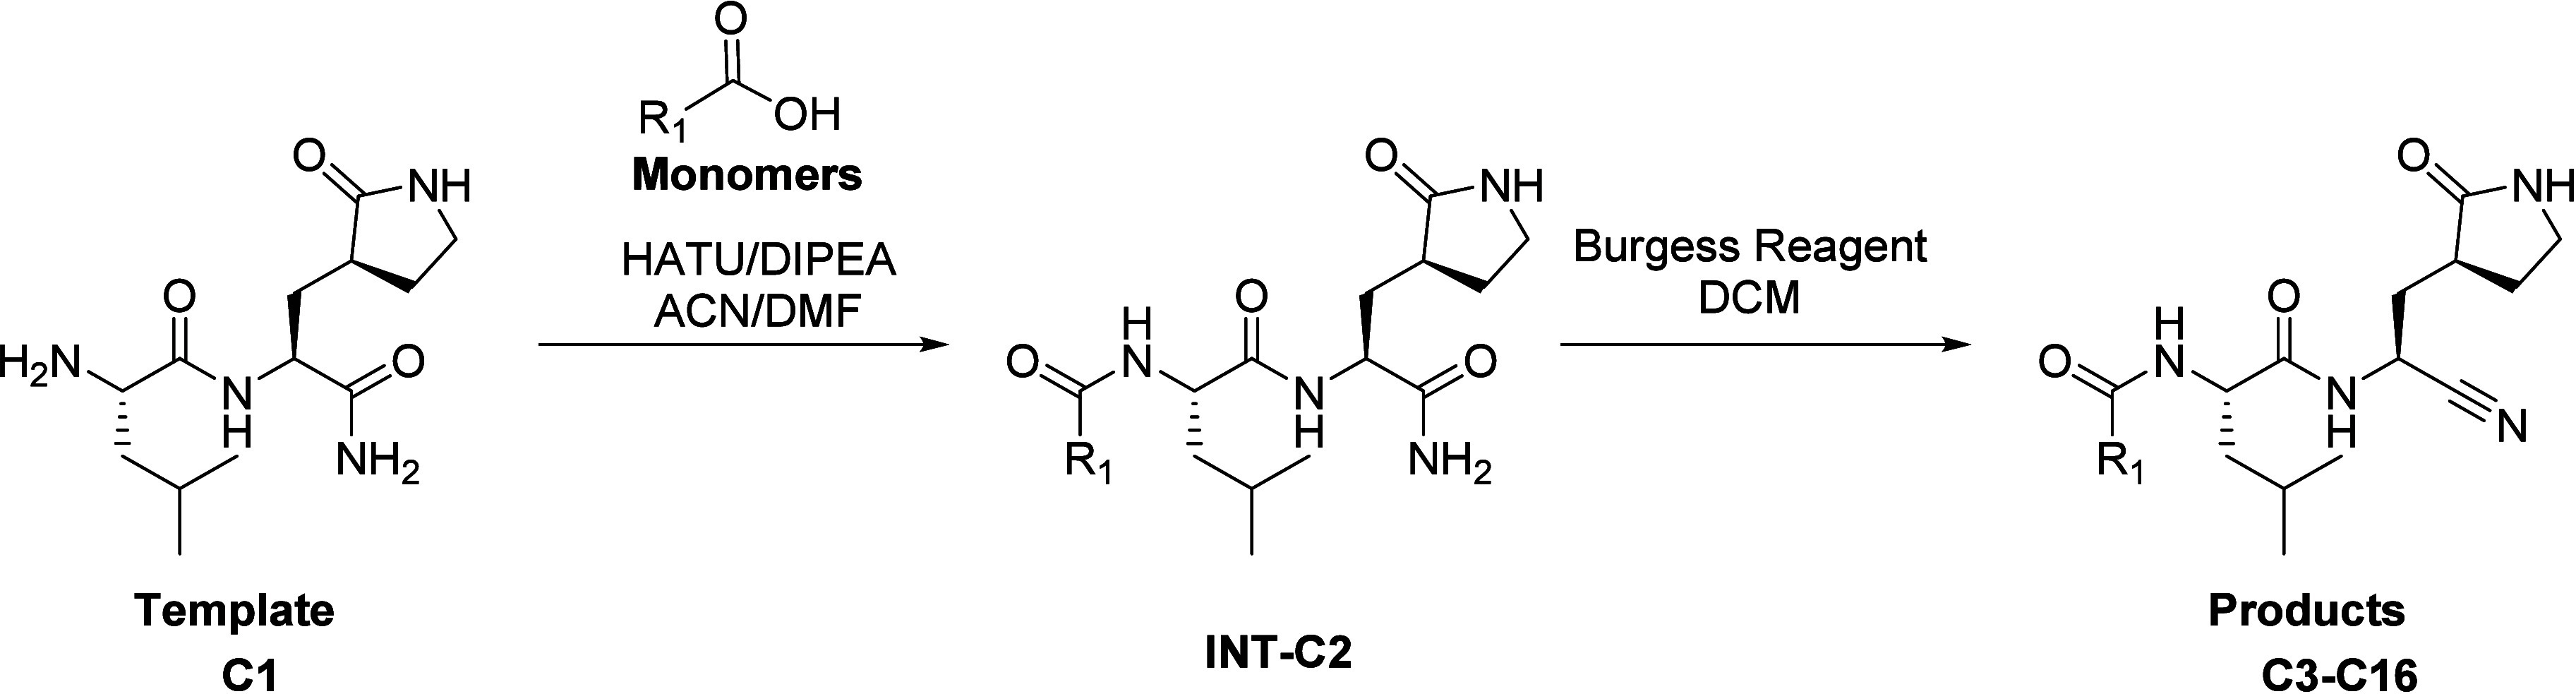
Facile amide coupling of template C1 and carboxylic acid monomers provided intermediates INT-C2 after aqueous workup. The crude intermediates were then treated with Burgess reagent to provide the final products. Excess Burgess reagent was removed via aqueous workup, and the resulting crude residues of compounds C3–C16 were diluted into DMSO and submitted to the purification workflow (Chart 1).
Chart 1. aPMC Library Compounds.

Six compounds with a wide range of chemical properties were selected from our dry compound storage (Chart 2) to demonstrate the versatility of the workflow for compound diversity on three scales (microscale, analytical scale, and traditional scale): compounds C17,36C18 (lorlatinib),37C19 (desvenlafaxine),38C20 (linezolid),39C21,40 and C22.41
Chart 2. Singleton Compounds.

For the purposes of demonstrating the workflow, we highlighted data from compounds C10 (PMC), C17 (Singleton), and C18 (Singleton). Additional data on all compounds can be found in the SI. All compounds are >95% pure by HPLC analysis.
High-Throughput Purification
Samples submitted to purification from chemistry went through a purification and characterization process that was facilitated by an internal Laboratory Information Management System (LIMS). The LIMS is responsible for analyzing data and producing input/output files that integrate lab automation equipment such as chromatographic instrumentation, liquid handling systems, plate readers, and robotic weighers. The scope is shown in Figure 3. Samples can be submitted as a parallel set of samples (library) or as single samples (singletons), which can be aggregated onto a plate in the Sample Aggregation step. Chemist submissions to the LIMS Purification software within the PMC workflows are split into a three-tiered system depending on the synthetic scale: Traditional (tPMC) (10–100 mg, 50–75 μmol), Analytical (aPMC) (>1–10 mg, 10–30 μmol), and Micro (μPMC) (0.03–1 mg, 3–5 μmol). The internal LIMS software is responsible for generating liquid handling instructions, sample lists, and other instrument-specific instructions. The software is also able to accommodate the collection of multiple fractions per sample at the preparative step, potentially with multiple target molecular weights. Downstream, this enables the analyst to register any or all of the isolated fractions as separate entities if requested.
Figure 3.

High-throughput purification process showing workflow steps and corresponding instrumentation, which is integrated into the Laboratory Instrument Management System (LIMS) and coupled to NMR sample generation.
Purification method development was performed on an analytical Waters UPLC system to determine the best column selection, modifier, and mobile phase gradient for isolating the target compound. The UPLC is coupled to multiple detectors that enable monitoring by UV, ELSD, and MS. For purification, we adopted a 3.0 min gradient for μPMC and aPMC workflows and an 8.5 min gradient for the tPMC workflow; similar gradient times were reported by Hettiarachchi.42 Target compounds were isolated by mass-triggered purification in ESI+ mode or by a specified wavelength using a UV detector. Purified fractions were evaporated in vacuo using Genevac S3 (Ipswich, UK) instruments overnight to remove the solvent. Isolated fractions on aPMC and tPMC scales were gravimetrically weighed from pre-tared tubes on a Tecan Evo-200 (Tecan Group Ltd., Switzerland) or BioMicroLab XL100 (SPT Labtech, Melbourn, UK) system. The μPMC workflow used ELSD quantitation to determine isolated amounts of compound (μg) similar to methods used by Rojas.43 All desired fractions were reformatted in DMSO at 30, 10, and 4 mM concentrations for the tPMC, aPMC, and μPMC workflows, respectively. A 5 μL aliquot was taken and diluted on a Tecan system (Tecan Group Ltd., Switzerland) to 0.5 mg/mL for quality control (QC) to assess compound purity via UPLC, with the remaining majority being sent to biological assays, solution storage, or dry storage, as indicated by the synthetic chemist.
While the process described in this Letter is applied to strictly achiral purifications, it is also amenable to and is routinely used at Pfizer for chirally separated compounds. In this case, supercritical fluid chromatography (SFC) coupled to MS is used in the purification of chiral compounds, but the downstream process of obtaining NMR samples from the dead volume remains the same, as well as the subsequent NMR acquisition methods. In our laboratory, the mobile phase modifiers used in SFC-MS are the same as those used in the achiral LCMS workflow.
NMR Sample Generation
Instead of discarding the inaccessible dead volumes from the purification step, this workflow seeks to recover those solutions. The dead volumes for the liquid handler reformatting are ∼25 μL for the traditional scale (30 mM) and ∼10 μL for the analytical scale and microscale workflows (10 and 4 mM, respectively). Controlled by automated dynamic scripts generated by the LIMS system, a Tecan liquid handling robot added 250 μL of DMSO to the vials (Thermo no. 3791-WP1D or Fisher no. 14-961-29) containing the small, inaccessible amount of purified compound, which were then transferred to a 96-well rack (Waters no. WAT058943). After the QC analysis was complete, the QC material was combined with the dead volume material to produce the NMR combined plate. DMSO was evaporated over 5 h in a Genevac S3 HT-12 system, then transferred to the liquid handler for NMR tube generation.
At this stage, all compounds were reformatted in DMSO-d6 in 1.7 mm tubes by an NMR sample preparation robot (Bruker SamplePro Tube, Bruker Biospin, Billerica, MA, USA) and were sent to 1H NMR irrespective of the purity and subsequent registration decision.
Fitted with a 0.5 mm outer diameter sample needle, the Bruker SamplePro instrument ran a script configured to add 60 μL of DMSO-d6 to each well on the plate containing dry sample, mixed the sample and solvent to facilitate dissolution, and then transferred ∼40 μL into a 1.7 mm NMR tube, resulting in theoretical maximum sample concentrations of 15, 2.5, and 1.0 mM for tPMC, aPMC, and μPMC, respectively. For the traditional scale (both singletons and PMC), dead volume material alone was sufficient to achieve a suitable signal-to-noise ratio. The QC sample alone would also achieve an NMR sample concentration of 2.3 mM, well above tolerable limits for NMR (see SI page S61). These concentrations assume that the dead volumes are consistent across all Tecan tip locations and collection tubes, as well as full dissolution and no sample loss during preparation. However, the sample concentration does vary considerably depending on several variables like solubility of compound, resulting viscosity, tube dimension uniformity, and Tecan needle position. Actual samples were observed to have reduced concentration caused by sample handling variance and incomplete material dissolution and/or transfer but remained within tolerable limits for NMR acquisition (see SI page S61). 1H NMR spectra for compound C12 (see SI page S37) showed a reduced signal-to-noise ratio compared to other samples run through the same aPMC workflow, highlighting the range of variable downstream concentrations observed. The Bruker liquid handling script parameters were configured to avoid the introduction of air bubbles into the 1.7 mm tubes; thus, no spin/centrifugation step was needed between NMR tube generation and NMR acquisition. Sample to sample cycle time was ∼1.8 min, translating to just under 3 h for a full 96-well plate. The NMR tube rack was then transferred to the NMR lab for 1H NMR and any additional analyses as required.
Figure 4.
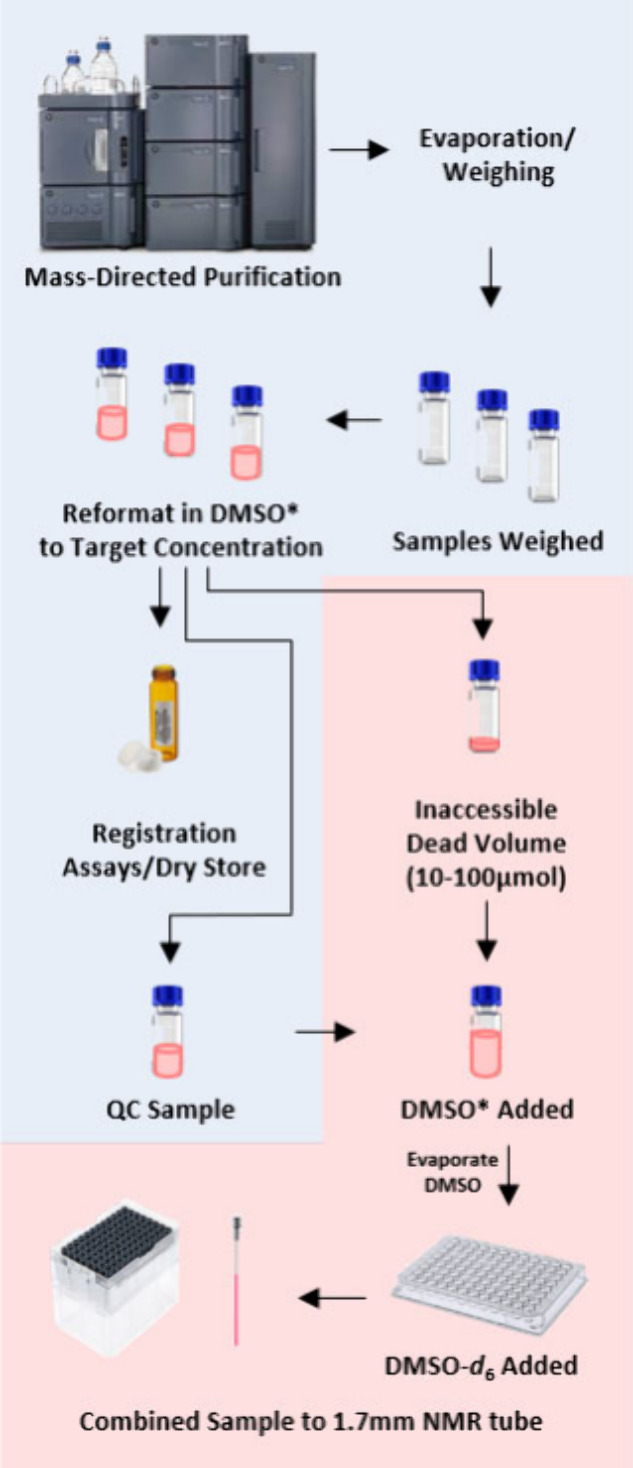
Process of obtaining the sample from the combined sample sources of quality control (QC, to assess compound purity) and the “dead volume”. The QC sample is combined with the inaccessible “dead volume” to create the NMR sample. *DMSO = protonated DMSO.
NMR Spectroscopy
Prepared NMR samples were loaded into the Sample Jet sample changer, and experiments were set up using the IconNMR spreadsheet import feature. All spectra were acquired on a Bruker Avance NEO 600 MHz instrument equipped with a 1.7 mm helium-cooled inverse TCI cryoprobe (Bruker Biospin, Billerica, MA, USA) running Topspin 4.0.8 software at 298 K. By default, 1H data were acquired on all samples, but 2D experiments were also collected on some samples as described later. The 1H data displayed in Figures 5 and 6 show spectra that are of comparable quality to routine NMR experiments collected in 5 mm tubes. Details of a spectrum acquired on C17 at a traditional scale concentration are shown in Figure 5. A 60° excitation pulse and 3.7 s recovery time were used as a compromise between the highest signal-to-noise ratio (SNR), robustness for molecules with differing relaxation times, and semiquantitative integration. 64 scans were accumulated, leading to an overall acquisition time of 4 min 9 s. Additionally, changing and equilibrating the sample and adjusting the probe parameters adds about 5 min of overhead per sample.
Figure 5.
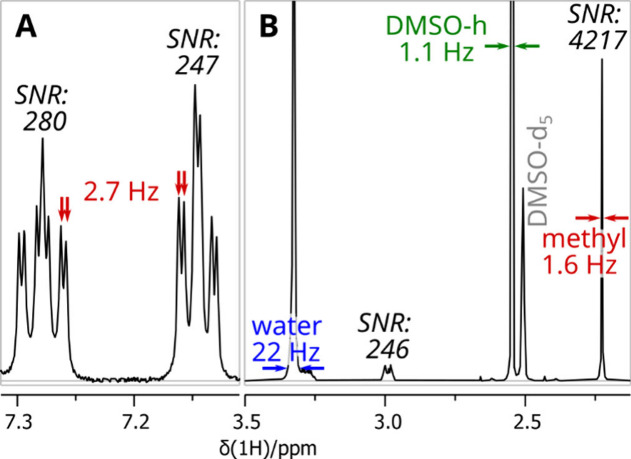
Details of the 1H NMR spectrum acquired on C17 showing the resolution and analyte SNR. (A) Aromatic region with resolved 2.7 Hz coupling. (B) Water/DMSO region showing solvent and analyte line widths and water foot at the height of the weakest analyte signals. The spectrum was acquired on traditional-scale concentration in 4 min 9 s and processed with exponential multiplication adding 0.3 Hz line broadening.
Figure 6.

Comparison of different concentration scales acquired for C17. Signal to noise (SNR) values are shown for scale. Spectra acquired in 4 min 8 s with identical parameters. A visual guide (dotted line) is included to help with the comparison of intensity. The edge of the water signal partially overlaps an analyte CH signal (*).
Using the spectral parameters outlined above, spectra have a sufficient SNR even on split signals, and spectral resolution is adequate to resolve most smaller coupling constants. The intensity of the water signal was roughly ten times higher than that of the analyte signals, which was low enough not to affect the dynamic range window. We also explored using water suppression methods but concluded that the intensity of the water signal did not justify suppression. The width of the water signal foot is usually around 20 to 30 Hz at the intensity level of weaker signals.
Figure 6 shows a comparison of spectra acquired on three samples of C17 prepared on different concentration scales. Scales correspond to reactions run at 50–75 μmol (traditional), 10–30 μmol (analytical), and 3–5 μmol (micro). The NMR acquisition parameters were chosen conservatively to compensate for potentially reduced concentrations of individual samples. The same acquisition parameters (60° excitation, 3.7 s recovery time, 64 scans) were used successfully for all three scales.
The sensitivity enhancement of the 1.7 mm micro-cryoprobe over a 5 mm cryoprobe is specific to the 1H channel. The 13C channel does not have a similar enhancement and is not sensitive enough to acquire even a simple 1D experiment in a few hours. However, proton-detected 2D experiments can be performed to provide additional information, including carbon chemical shifts on protonated carbons. These experiments allow for in-depth analysis and unambiguous assignment of signals. The most basic and important heteronuclear experiment is heteronuclear single-quantum coherence spectroscopy (HSQC), which uses one-bond coupling to correlate signals from 1H with the shift of directly attached 13C atoms.44 Introducing a 13C dimension also increases resolution and reduces the ambiguity of overlapping 1H signals. The HSQC can also help recover signals that are overlapping with water or other solvent signals, as seen in the spectrum shown in Figure 7.
Figure 7.
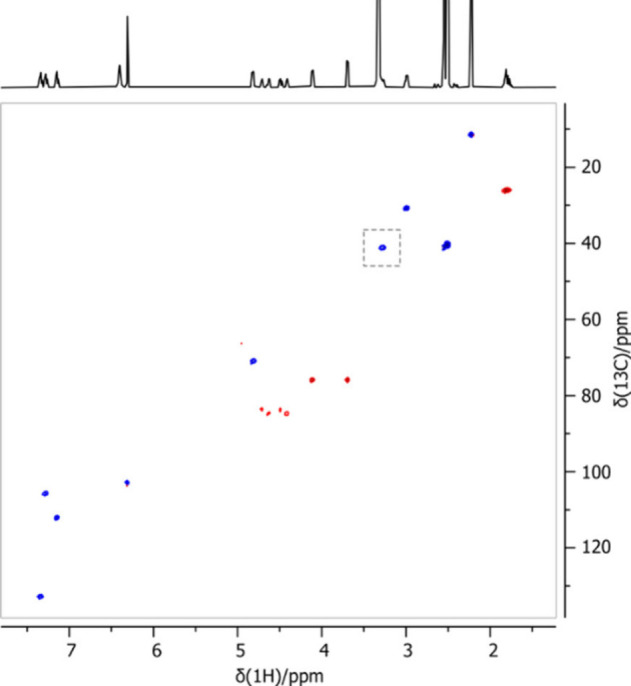
Multiplicity-edited HSQC spectrum acquired for C17 at the aPMC concentration level acquired in 20 min. The highlighted CH signal is partially overlapped by the foot of the water signal in 1H NMR (see Figure 6).
Correlation spectroscopy (COSY) is one of the basic homonuclear 2D experiments to establish the constitution. It shows correlations between directly coupled H atoms and allows the identification and assignment of spin systems. Figure 7 A double-quantum filtered COSY spectrum acquired on C17 is shown in the SI, S59.45 The total correlation spectroscopy (TOCSY) experiment has similar sensitivity to COSY and can be performed instead.
Other less sensitive 2D experiments, such as nuclear Overhauser effect spectroscopy (NOESY) and heteronuclear multiple bond correlation (HMBC), are not always sensitive enough for routine high-throughput acquisition. However, if required for additional analysis, they can usually be performed on individual samples in 1 or 2 h using the same samples generated through this workflow.
Water Content
NMR sample preparations performed under normal laboratory conditions caused notable water uptake by the DMSO-d6, as can be seen by comparing the width of the water signals in the 1H NMR spectra (Figure 8A). Apart from disparities in the dynamic range, radiation damping and the temperature gradient in the cryoprobe also caused additional broadening of the water signal. It was determined that the moisture uptake in the samples was increasing over the duration of the NMR plate generation (Figure 8B), indicating that the moisture was accumulating over time in the DMSO-d6 source vial when prepared under atmospheric conditions. Purging the open sample preparation system (Bruker SamplePro) with N2 flow during preparation reduced the water uptake measurably but did not change the overall readability of the spectra. Placing the SamplePro robot in an enclosure, however, enabled sample preparation in an N2 atmosphere and reduced the relative humidity (RH) levels. Moving the SamplePro to an enclosure also gave a reduction of the water integrals by a factor of 10 or higher. Spectra were no longer dominated by water intensity, and the width of the water resonance was reduced to the width of a regular multiplet. Reducing water content to such levels inherently increases sensitivity and has enabled additional 2D NMR experiments to be performed with these same material-sparing samples.
Figure 8.

Water elimination efforts using a Bruker SamplePro instrument for 1.7 mm NMR tube sample preparation. (A) Compound C101H NMR spectra before and after glovebox enclosure implementation for the sample preparation robot. The line width of the water signal at the analyte intensity is shown. (B) Water content of real-world samples: integral of the water signal in the NMR spectrum vs sample preparation order with the sample preparation robot in an open system under air, in an open system with N2 flow, and in the enclosure. Water content correlates with the duration of DMSO-d6 atmospheric exposure in the robot prior to individual sample preparation. When the NMR acquisition order was randomized, no correlation between water content and time from sample preparation to acquisition was found.
A custom glovebox enclosure (Nitrogenema II) was built by Flow Sciences (Leland, NC) to house the Bruker SamplePro, enabling the preparation of the 1.7 mm NMR tubes in an airtight, low-moisture, and inert N2 atmosphere (see SI for details). The enclosure features fully removable front and top panels in addition to 3 gloveports for sample handling under inert conditions. During sample preparation, the Nitrogenema II system achieved an O2 concentration of ∼1.2% and an RH of ∼1.6%. High- and low-concentration gases were calibrated for RH using a Traceable 4392 Hygrometer (Webster, TX) instrument. Reducing the RH and O2% to such low levels was a major factor enabling automated structure verification (ASV) for 1H NMR acquisition.
Automated Assignment
Automated structure verification (ASV) was achieved by using the “batch-asv” feature in ACD/Spectrus (Advanced Chemistry Development Inc., Toronto, Canada)46,47 without any modification of the raw data. Structure files were copied to the respective data folders from the lab notebook database using an in-house-developed script. An example report is shown in Figure 9.
Figure 9.

Report generated by automated structure verification in ACD/Spectrus for C5. The Match Factor (MF) of 0.96 indicates how close the spectra match the prediction. 1D and 2D data are used, and assignments are listed.
The software calculates a match factor (MF) based on the normalized multiplication of probabilities for each assigned atom in the spectra. This acts as a measure of confidence for the chemist as well as a list of chemical shift and assignment information to support interpretation. Due to the way the software treats water and solvent regions, reduction of the width of the water line was the most important factor to enable a satisfactory automated assignment after sufficient sensitivity was reached. We applied the automated assignment to either 1H NMR data alone or combined 1H and HSQC data. Consistent with the literature,47 the assignment quality was improved when 1D and 2D data were combined.
Following purification and NMR acquisition, the chromatographic and NMR data are emailed directly to the chemist and linked automatically to their electronic notebook page. Examples of analytical data sets are illustrated in Figure 10, showing 1H NMR spectra for structure verification, MS spectra with target mass identification, and a chromatographic QC for purity assessment.
Figure 10.

(I) Typical analytical data package acquired for C18 at the tPMC scale. Chromatography: (A) ELSD signal, (B) UV DAD signal, (C) ESI+ extracted ion 407.155 Da [M + H], (D) total ion chromatogram [TIC] ESI+, and (E) combined ESI+ TIC at 1.59 min. NMR: (F) 1H NMR spectrum. (II) Typical analytical data package acquired for C10 at aPMC scale. Chromatography: (A) ELSD signal, (B) UV DAD signal, (C) ESI+ extracted ion 440.222 Da [M + H], (D) total ion chromatogram [TIC] ESI+, and (E) combined ESI+ TIC at 2.35 min. NMR: (F) 1H NMR spectrum. (III) Typical analytical data package acquired for C17 at μPMC scale. Chromatography: (A) ELSD signal, (B) UV DAD signal, (C) ESI+ extracted ion 398.107 Da [M + H], (D) total ion chromatogram [TIC] ESI+, and (E) Combined ESI+ TIC at 1.59 min. NMR: (F) 1H NMR spectrum.
By overcoming multiple barriers to NMR sample generation and acquisition on a high-throughput scale, we were able to develop an integrated purification and NMR characterization platform to match the synthetic capacity in Pfizer discovery. Automating key elements of the workflow enabled a combined purification and NMR acquisition turnaround time (operational hours) of 20 h for μPMC/aPMC libraries ≤30 and ≤15 singleton compounds, up to 36 h for tPMC libraries of 96 compounds, thus minimizing the DMTA cycle and preventing the need for compound resynthesis to obtain all of the desired analytical data and/or biological testing. In addition, automatically generated and readily available analytical data improve chemistry efficiency and dramatically reduce the amount of time chemists spend gathering, analyzing, and interpreting data for patent and intellectual property (IP) filings or for further structure verification. From a design and synthesis perspective, this new combined workflow provides quality NMR data to the chemist 1–2 days after compound registration, critically driving prompt, informed project related decisions.
A key technology for this application is a cryogenically cooled 1.7 mm NMR probe (micro-cryoprobe), leading to a reduction of sample volume and an increase of sensitivity by about 10-fold with respect to the sample amount. It allows the acquisition of NMR spectra in minutes with tens of micrograms of dissolved sample and has been shown to allow the NMR characterization of microgram samples of metabolites or impurities.48,49 The caveat is that this highly sophisticated technology introduces a new challenge: water content. Operating at such low sensitivities exacerbates moisture uptake that can occur during robotic sample preparation, severely hampering efforts to achieve automated structure verification by 1H NMR. Current automation used to prepare 1.7 mm NMR samples is not contained within an inert enclosure. Therefore, the introduction of an automated NMR liquid handling robot for 1.7 mm NMR tube sample preparation necessitated the implementation of a custom inert enclosure. With these preparation and acquisition improvements, the reduction in moisture content and increase in sensitivity paved the way for quality 1H NMR spectra and downstream ASV.
In the short time since its inception, this workflow has had a tremendous impact on the Pfizer portfolio, evident in the recent search for an oral SARS-CoV-2 main protease inhibitor. The purification and NMR analysis of the PMC library compounds documented in this Letter were performed during the development of nirmatrelvir,35 the antiviral component of PAXLOVID, as well as PF-07817883, the newly developed second-generation antiviral compound in phase II clinical trials. Using the high-throughput speed of this new automated process facilitated the rapid development of these two clinical compounds during the Covid-19 pandemic.50
Discovery chemists at Pfizer can now simply submit compounds for purification and receive chromatographic purity data, target MS confirmation, and 1H NMR spectra for all new compounds upon first synthesis. Furthermore, automated structure verification by ASV can provide a reduction in the amount of time chemists spend on structure elucidation via 1H NMR. Additional 2D NMR spectra can be acquired in the same automation run if requested, and samples can be stored to enable the acquisition of additional spectra later, if required. On numerous occasions, the NMR spectra collected with this new platform have provided key data to our chemists including but not limited to the identification of stability degradants, isomer classification/confirmation, and IP/patent filing with full data packages without resynthesis. Harmonizing these areas of analytical and synthetic chemistry into a cohesive automated workflow while meeting the requirements of NMR spectroscopy on such a high-throughput scale will undoubtedly transform the DMTA landscape for years to come.
Acknowledgments
The authors thank Adam Gilbert, Mark Noe, and Matthew Troutman.
Glossary
Abbreviations
- Hts
High-Throughput Screening
- MoA
Modes of Action
- aPMC
Analytical-Scale Parallel Medicinal Chemistry
- μPMC
Microscale Parallel Medicinal Chemistry
- tPMC
Traditional Scale Parallel Medicinal Chemistry
- ASV
Automated Structure Verification
- DMTA
Design–Make–Test–Analyze
- UPLC
Ultrahigh Performance Liquid Chromatography
- CAD
Charged Aerosol Detection
- ELS
Evaporative Light Scattering
- TOCSY
Total Correlation Spectroscopy
- HMBC
Heteronuclear Multiple Bond Correlation
- HSQC
Heteronuclear Single-Quantum Coherence
- MF
Match Factor
Supporting Information Available
The Supporting Information is available free of charge at https://pubs.acs.org/doi/10.1021/acsmedchemlett.4c00245.
Synthetic protocols for compounds, purification conditions, NMR line lists, 1H NMR spectra, chromatographic QC and purification conditions, additional 2D NMR spectra, drawings for the SamplePro enclosure, and plot of signal-to-noise versus concentration for the 1H NMR response (PDF)
Author Contributions
∇ J.B. and M.K. shared first authorship. K.A.F. ideated the research presented, designed the experiments, and prepared the manuscript. J.B. designed, conceptualized, executed lab automation and purification workflow experiments and NMR sample generation studies, and prepared the manuscript. M.A. conducted PMC synthesis and prepared the manuscript. B.K. conceived the workflow and orchestrated Bruker SamplePro installation. M.K. implemented NMR automation, collected NMR experiments, collected ASV data, and prepared the manuscript. C.L. and M.B. conducted μPMC and aPMC synthesis. G.O. conducted μPMC purification and NMR sample preparation studies. G.C. conducted aPMC and tPMC purification and analysis. T.R. conducted NMR signal-to-noise experiments. All authors contributed to and approved the final manuscript.
The authors declare no competing financial interest.
Supplementary Material
References
- Makurvet F. D. Biologics vs. small molecules: Drug costs and patient access. Med. Drug Discov. 2021, 9, 100075. 10.1016/j.medidd.2020.100075. [DOI] [Google Scholar]
- Howes L. Is this a golden age of small-molecule drug discovery?. C&EN Global Enterp. 2023, 101 (36), 28–32. 10.1021/cen-10136-cover. [DOI] [Google Scholar]
- Lipinski C. A.; Lombardo F.; Dominy B. W.; Feeney P. J. Experimental and computational approaches to estimate solubility and permeability in drug discovery and development settings. original article: S0169–409X(96)00423–1. The article was originally published in Advanced Drug Delivery Reviews 23 (1997) 3–25.1.. Adv. Drug Delivery Rev. 2001, 46 (1), 3–26. 10.1016/S0169-409X(00)00129-0. [DOI] [PubMed] [Google Scholar]
- Reymond J. L. The chemical space project. Acc. Chem. Res. 2015, 48 (3), 722–730. 10.1021/ar500432k. [DOI] [PubMed] [Google Scholar]
- Holbrook S. Y. L.; Garneau-Tsodikova S. What is medicinal chemistry? - Demystifying a rapidly evolving discipline!. Medchemcomm 2017, 8 (9), 1739–1741. 10.1039/C7MD90030A. [DOI] [PMC free article] [PubMed] [Google Scholar]
- Southey M. W. Y.; Brunavs M. Introduction to small molecule drug discovery and preclinical development. Front. Drug Discov. 2023, 3, 1314077. 10.3389/fddsv.2023.1314077. [DOI] [Google Scholar]
- Wesolowski S. S.; Brown D. G.. The Strategies and Politics of Successful Design, Make, Test, and Analyze (DMTA) Cycles in Lead Generation. In Lead Generation; Holenz J., Ed.; Wiley-VCH, 2016. [Google Scholar]
- Ghiandoni G. M.; Evertsson E.; Riley D. J.; Tyrchan C.; Rathi P. C. Augmenting DMTA using predictive AI modelling at AstraZeneca. Drug Discovery Today 2024, 29 (4), 103945 10.1016/j.drudis.2024.103945. [DOI] [PubMed] [Google Scholar]
- Ginsburg-Moraff C.; Grob J.; Chin K.; Eastman G.; Wildhaber S.; Bayliss M.; Mues H. M.; Palmieri M.; Poirier J.; Reck M.; Luneau A.; Rodde S.; Reilly J.; Wagner T.; Brocklehurst C. E.; Wyler R.; Dunstan D.; Marziale A. N. Integrated and automated high-throughput purification of libraries on microscale. SLAS Technol. 2022, 27 (6), 350–360. 10.1016/j.slast.2022.08.002. [DOI] [PubMed] [Google Scholar]
- Gao K.; Shaabani S.; Xu R.; Zarganes-Tzitzikas T.; Gao L.; Ahmadianmoghaddam M.; Groves M. R.; Domling A. Nanoscale, automated, high throughput synthesis and screening for the accelerated discovery of protein modifiers. RSC Med. Chem. 2021, 12 (5), 809–818. 10.1039/D1MD00087J. [DOI] [PMC free article] [PubMed] [Google Scholar]
- Jones M.; Goodyear R. L. High-Throughput Purification in Drug Discovery: Scaling New Heights of Productivity. ACS Med. Chem. Lett. 2023, 14 (7), 916–919. 10.1021/acsmedchemlett.3c00073. [DOI] [PMC free article] [PubMed] [Google Scholar]
- Moos W. H.; Hurt C. R.; Morales G. A. Combinatorial chemistry: oh what a decade or two can do. Mol. Divers 2009, 13 (2), 241–245. 10.1007/s11030-009-9127-y. [DOI] [PubMed] [Google Scholar]
- Barhate C. L.; Donnell A. F.; Davies M.; Li L.; Zhang Y.; Yang F.; Black R.; Zipp G.; Zhang Y.; Cavallaro C. L.; Priestley E. S.; Weller H. N. Microscale purification in support of high-throughput medicinal chemistry. Chem. Commun. (Camb) 2021, 57 (84), 11037–11040. 10.1039/D1CC03791A. [DOI] [PubMed] [Google Scholar]
- Dombrowski A. W.; Aguirre A. L.; Shrestha A.; Sarris K. A.; Wang Y. The Chosen Few: Parallel Library Reaction Methodologies for Drug Discovery. J. Org. Chem. 2022, 87 (4), 1880–1897. 10.1021/acs.joc.1c01427. [DOI] [PubMed] [Google Scholar]
- Hettiarachchi K.; Hayes M.; Desai A. J.; Wang J.; Ren Z.; Greshock T. J. Subminute micro-isolation of pharmaceuticals with ultra-high pressure liquid chromatography. J. Pharm. Biomed Anal 2019, 176, 112794 10.1016/j.jpba.2019.112794. [DOI] [PubMed] [Google Scholar]
- Sutherland J. D.; Tu N. P.; Nemcek T. A.; Searle P. A.; Hochlowski J. E.; Djuric S. W.; Pan J. Y. An automated synthesis-purification-sample-management platform for the accelerated generation of pharmaceutical candidates. J. Lab Autom 2014, 19 (2), 176–182. 10.1177/2211068213516325. [DOI] [PubMed] [Google Scholar]
- Patronov A.; Papadopoulos K.; Engkvist O. Has Artificial Intelligence Impacted Drug Discovery?. Methods Mol. Biol. 2022, 2390, 153–176. 10.1007/978-1-0716-1787-8_6. [DOI] [PubMed] [Google Scholar]
- Farrant E. Automation of Synthesis in Medicinal Chemistry: Progress and Challenges. ACS Med. Chem. Lett. 2020, 11 (8), 1506–1513. 10.1021/acsmedchemlett.0c00292. [DOI] [PMC free article] [PubMed] [Google Scholar]
- Struble T. J.; Alvarez J. C.; Brown S. P.; Chytil M.; Cisar J.; DesJarlais R. L.; Engkvist O.; Frank S. A.; Greve D. R.; Griffin D. J.; Hou X.; Johannes J. W.; Kreatsoulas C.; Lahue B.; Mathea M.; Mogk G.; Nicolaou C. A.; Palmer A. D.; Price D. J.; Robinson R. I.; Salentin S.; Xing L.; Jaakkola T.; Green W. H.; Barzilay R.; Coley C. W.; Jensen K. F. Current and Future Roles of Artificial Intelligence in Medicinal Chemistry Synthesis. J. Med. Chem. 2020, 63 (16), 8667–8682. 10.1021/acs.jmedchem.9b02120. [DOI] [PMC free article] [PubMed] [Google Scholar]
- Yu Y.; Wu Z.; Shi Z. C.; He S.; Lai Z.; Cernak T. A.; Vachal P.; Liu M.; Liu J.; Hong Q.; Jian T.; Guiadeen D.; Krikorian A.; Sperbeck D. M.; Verras A.; Sonatore L. M.; Murphy B. A.; Wiltsie J.; Chung C. C.; Gorski J. N.; Liu J.; Xiao J.; Wolff M.; Tong S. X.; Madeira M.; Karanam B. V.; Shen D. M.; Balkovec J. M.; De Vita R. J.; Pinto S.; Nargund R. P. Accelerating the discovery of DGAT1 inhibitors through the application of parallel medicinal chemistry (PMC). Bioorg. Med. Chem. Lett. 2019, 29 (11), 1380–1385. 10.1016/j.bmcl.2019.03.039. [DOI] [PubMed] [Google Scholar]
- Volkamer A.; Riniker S.; Nittinger E.; Lanini J.; Grisoni F.; Evertsson E.; Rodríguez-Pérez R.; Schneider N. Machine learning for small molecule drug discovery in academia and industry. Artif. Intell. Life Sci. 2023, 3, 100056. 10.1016/j.ailsci.2022.100056. [DOI] [Google Scholar]
- Kretschmer F.; Harrieder E.-M.; Hoffmann M.; Böcker S.; Witting M. RepoRT: A comprehensive repository for small molecule retention times. ChemRxiv 2023, 10.26434/chemrxiv-2023-1mq73-v2. [DOI] [PubMed] [Google Scholar]
- Gonzalez-Lopez N. M.; Insuasty-Cepeda D. S.; Huertas-Ortiz K. A.; Reyes-Calderon J. E.; Martinez-Ramirez J. A.; Fierro-Medina R.; Jenny Rivera-Monroy Z.; Garcia-Castaneda J. E. Gradient Retention Factor Concept Applied to Method Development for Peptide Analysis by Means of RP-HPLC. ACS Omega 2022, 7 (49), 44817–44824. 10.1021/acsomega.2c04907. [DOI] [PMC free article] [PubMed] [Google Scholar]
- Baranczak A.; Tu N. P.; Marjanovic J.; Searle P. A.; Vasudevan A.; Djuric S. W. Integrated Platform for Expedited Synthesis-Purification-Testing of Small Molecule Libraries. ACS Med. Chem. Lett. 2017, 8 (4), 461–465. 10.1021/acsmedchemlett.7b00054. [DOI] [PMC free article] [PubMed] [Google Scholar]
- De Vijlder T.; Valkenborg D.; Lemiere F.; Romijn E. P.; Laukens K.; Cuyckens F. A tutorial in small molecule identification via electrospray ionization-mass spectrometry: The practical art of structural elucidation. Mass Spectrom Rev. 2018, 37 (5), 607–629. 10.1002/mas.21551. [DOI] [PMC free article] [PubMed] [Google Scholar]
- Chu S.; Zhou G.; Gochin M. Evaluation of ligand-based NMR screening methods to characterize small molecule binding to HIV-1 glycoprotein-41. Org. Biomol Chem. 2017, 15 (24), 5210–5219. 10.1039/C7OB00954B. [DOI] [PMC free article] [PubMed] [Google Scholar]
- Dhahri M.; Sioud S.; Dridi R.; Hassine M.; Boughattas N. A.; Almulhim F.; Al Talla Z.; Jaremko M.; Emwas A. M. Extraction, Characterization, and Anticoagulant Activity of a Sulfated Polysaccharide from Bursatella leachii Viscera. ACS Omega 2020, 5 (24), 14786–14795. 10.1021/acsomega.0c01724. [DOI] [PMC free article] [PubMed] [Google Scholar]
- Emwas A. H.; Szczepski K.; Poulson B. G.; Chandra K.; McKay R. T.; Dhahri M.; Alahmari F.; Jaremko L.; Lachowicz J. I.; Jaremko M. NMR as a ″Gold Standard″ Method in Drug Design and Discovery. Molecules 2020, 25 (20), 4597. 10.3390/molecules25204597. [DOI] [PMC free article] [PubMed] [Google Scholar]
- Harner M. J.; Mueller L.; Robbins K. J.; Reily M. D. NMR in drug design. Arch. Biochem. Biophys. 2017, 628, 132–147. 10.1016/j.abb.2017.06.005. [DOI] [PubMed] [Google Scholar]
- Zartler E. R.; Hanson J.; Jones B. E.; Kline A. D.; Martin G.; Mo H.; Shapiro M. J.; Wang R.; Wu H.; Yan J. RAMPED-UP NMR: multiplexed NMR-based screening for drug discovery. J. Am. Chem. Soc. 2003, 125 (36), 10941–10946. 10.1021/ja0348593. [DOI] [PubMed] [Google Scholar]
- Liu M.; Chen K.; Christian D.; Fatima T.; Pissarnitski N.; Streckfuss E.; Zhang C.; Xia L.; Borges S.; Shi Z.; Vachal P.; Tata J.; Athanasopoulos J. High-throughput purification platform in support of drug discovery. ACS Comb. Sci. 2012, 14 (1), 51–59. 10.1021/co200138h. [DOI] [PubMed] [Google Scholar]
- Gesmundo N. J.; Sauvagnat B.; Curran P. J.; Richards M. P.; Andrews C. L.; Dandliker P. J.; Cernak T. Nanoscale synthesis and affinity ranking. Nature 2018, 557 (7704), 228–232. 10.1038/s41586-018-0056-8. [DOI] [PubMed] [Google Scholar]
- Buitrago Santanilla A.; Regalado E. L.; Pereira T.; Shevlin M.; Bateman K.; Campeau L. C.; Schneeweis J.; Berritt S.; Shi Z. C.; Nantermet P.; Liu Y.; Helmy R.; Welch C. J.; Vachal P.; Davies I. W.; Cernak T.; Dreher S. D. Organic chemistry. Nanomole-scale high-throughput chemistry for the synthesis of complex molecules. Science 2015, 347 (6217), 49–53. 10.1126/science.1259203. [DOI] [PubMed] [Google Scholar]
- Hoffman R. L.; Kania R. S.; Brothers M. A.; Davies J. F.; Ferre R. A.; Gajiwala K. S.; He M.; Hogan R. J.; Kozminski K.; Li L. Y.; Lockner J. W.; Lou J.; Marra M. T.; Mitchell L. J. Jr.; Murray B. W.; Nieman J. A.; Noell S.; Planken S. P.; Rowe T.; Ryan K.; Smith G. J. 3rd; Solowiej J. E.; Steppan C. M.; Taggart B. Discovery of Ketone-Based Covalent Inhibitors of Coronavirus 3CL Proteases for the Potential Therapeutic Treatment of COVID-19. J. Med. Chem. 2020, 63 (21), 12725–12747. 10.1021/acs.jmedchem.0c01063. [DOI] [PMC free article] [PubMed] [Google Scholar]
- Owen D. R.; Allerton C. M. N.; Anderson A. S.; Aschenbrenner L.; Avery M.; Berritt S.; Boras B.; Cardin R. D.; Carlo A.; Coffman K. J.; Dantonio A.; Di L.; Eng H.; Ferre R.; Gajiwala K. S.; Gibson S. A.; Greasley S. E.; Hurst B. L.; Kadar E. P.; Kalgutkar A. S.; Lee J. C.; Lee J.; Liu W.; Mason S. W.; Noell S.; Novak J. J.; Obach R. S.; Ogilvie K.; Patel N. C.; Pettersson M.; Rai D. K.; Reese M. R.; Sammons M. F.; Sathish J. G.; Singh R. S. P.; Steppan C. M.; Stewart A. E.; Tuttle J. B.; Updyke L.; Verhoest P. R.; Wei L.; Yang Q.; Zhu Y. An oral SARS-CoV-2 M(pro) inhibitor clinical candidate for the treatment of COVID-19. Science 2021, 374 (6575), 1586–1593. 10.1126/science.abl4784. [DOI] [PubMed] [Google Scholar]
- Brodney M. A.; Beck E. M.; Butler C. R.; Barreiro G.; Johnson E. F.; Riddell D.; Parris K.; Nolan C. E.; Fan Y.; Atchison K.; Gonzales C.; Robshaw A. E.; Doran S. D.; Bundesmann M. W.; Buzon L.; Dutra J.; Henegar K.; LaChapelle E.; Hou X.; Rogers B. N.; Pandit J.; Lira R.; Martinez-Alsina L.; Mikochik P.; Murray J. C.; Ogilvie K.; Price L.; Sakya S. M.; Yu A.; Zhang Y.; O’Neill B. T. Utilizing structures of CYP2D6 and BACE1 complexes to reduce risk of drug-drug interactions with a novel series of centrally efficacious BACE1 inhibitors. J. Med. Chem. 2015, 58 (7), 3223–3252. 10.1021/acs.jmedchem.5b00191. [DOI] [PMC free article] [PubMed] [Google Scholar]
- Zou H. Y.; Li Q.; Engstrom L. D.; West M.; Appleman V.; Wong K. A.; McTigue M.; Deng Y. L.; Liu W.; Brooun A.; Timofeevski S.; McDonnell S. R.; Jiang P.; Falk M. D.; Lappin P. B.; Affolter T.; Nichols T.; Hu W.; Lam J.; Johnson T. W.; Smeal T.; Charest A.; Fantin V. R. PF-06463922 is a potent and selective next-generation ROS1/ALK inhibitor capable of blocking crizotinib-resistant ROS1 mutations. Proc. Natl. Acad. Sci. U. S. A. 2015, 112 (11), 3493–3498. 10.1073/pnas.1420785112. [DOI] [PMC free article] [PubMed] [Google Scholar]
- Deecher D. C.; Beyer C. E.; Johnston G.; Bray J.; Shah S.; Abou-Gharbia M.; Andree T. H. Desvenlafaxine succinate: A new serotonin and norepinephrine reuptake inhibitor. J. Pharmacol Exp Ther 2006, 318 (2), 657–665. 10.1124/jpet.106.103382. [DOI] [PubMed] [Google Scholar]
- Brickner S. J.; Barbachyn M. R.; Hutchinson D. K.; Manninen P. R. Linezolid (ZYVOX), the first member of a completely new class of antibacterial agents for treatment of serious gram-positive infections. J. Med. Chem. 2008, 51 (7), 1981–1990. 10.1021/jm800038g. [DOI] [PubMed] [Google Scholar]
- Feng Y.; Liang S.; Langille J.; Pierce B. S.; Chung S.; Szeliga J.; Wilcox G.; Simonds P.; Farley K. A.; Li B.; Garcia-Irizarry C.; Jones P.; Lira R. Improved Synthesis of a Macrocyclic Peptide-Like C5aR Antagonist for Intravenous Applications. Org. Process Res. Dev. 2023, 27 (11), 2010–2019. 10.1021/acs.oprd.3c00202. [DOI] [Google Scholar]
- Humphrey J. M.; Movsesian M.; Am Ende C. W.; Becker S. L.; Chappie T. A.; Jenkinson S.; Liras J. L.; Liras S.; Orozco C.; Pandit J.; Vajdos F. F.; Vandeput F.; Yang E.; Menniti F. S. Discovery of Potent and Selective Periphery-Restricted Quinazoline Inhibitors of the Cyclic Nucleotide Phosphodiesterase PDE1. J. Med. Chem. 2018, 61 (10), 4635–4640. 10.1021/acs.jmedchem.8b00374. [DOI] [PubMed] [Google Scholar]
- Hettiarachchi K.; Streckfuss E.; Sanzone J. R.; Wang J.; Hayes M.; Kong M.; Greshock T. J. Microscale Purification with Direct Charged Aerosol Detector Quantitation Using Selective Online One- or Two-Dimensional Liquid Chromatography. Anal. Chem. 2022, 94 (23), 8309–8316. 10.1021/acs.analchem.2c00750. [DOI] [PubMed] [Google Scholar]
- Rojas M. J.; Castral T. C.; Giordano R. L.; Tardioli P. W. Development and validation of a simple high performance liquid chromatography - evaporative light scattering detector method for direct quantification of native cyclodextrins in a cyclization medium. J. Chromatogr A 2015, 1410, 140–146. 10.1016/j.chroma.2015.07.097. [DOI] [PubMed] [Google Scholar]
- Willker W.; Leibfritz D.; Kerssebaum R.; Bermel W. Gradient selection in inverse heteronuclear correlation spectroscopy. Magn. Reson. Chem. 1993, 31 (3), 287–292. 10.1002/mrc.1260310315. [DOI] [Google Scholar]
- Ancian B.; Bourgeois I.; Dauphin J.-F.; Shaw A. A. Artifact-Free Pure Absorption PFG-Enhanced DQF-COSY Spectra Including a Gradient Pulse in the Evolution Period. J. Magn. Reson. 1997, 125 (2), 348–354. 10.1006/jmre.1997.1112. [DOI] [Google Scholar]
- Golotvin S. S.; Pol R.; Sasaki R. R.; Nikitina A.; Keyes P. Concurrent combined verification: reducing false positives in automated NMR structure verification through the evaluation of multiple challenge control structures. Magn. Reson. Chem. 2012, 50 (6), 429–435. 10.1002/mrc.3818. [DOI] [PubMed] [Google Scholar]
- Golotvin S. S.; Vodopianov E.; Pol R.; Lefebvre B. A.; Williams A. J.; Rutkowske R. D.; Spitzer T. D. Automated structure verification based on a combination of 1D (1)H NMR and 2D (1)H - (13)C HSQC spectra. Magn. Reson. Chem. 2007, 45 (10), 803–813. 10.1002/mrc.2034. [DOI] [PubMed] [Google Scholar]
- Liu Y.; Green M. D.; Marques R.; Pereira T.; Helmy R.; Thomas Williamson R.; Bermel W.; Martin G. E. Using pure shift HSQC to characterize microgram samples of drug metabolites. Tetrahedron Lett. 2014, 55 (40), 5450–5453. 10.1016/j.tetlet.2014.06.067. [DOI] [Google Scholar]
- Dalisay D. S.; Molinski T. F. NMR Quantitation of Natural Products at the Nanomole Scale. J. Nat. Prod. 2009, 72 (4), 739–744. 10.1021/np900009b. [DOI] [PMC free article] [PubMed] [Google Scholar]
- Allerton C. M. N.; Arcari J. T.; Aschenbrenner L. M.; Avery M.; Bechle B. M.; Behzadi M. A.; Boras B.; Buzon L. M.; Cardin R. D.; Catlin N. R.; Carlo A. A.; Coffman K. J.; Dantonio A.; Di L.; Eng H.; Farley K. A.; Ferre R. A.; Gernhardt S. S.; Gibson S. A.; Greasley S. E.; Greenfield S. R.; Hurst B. L.; Kalgutkar A. S.; Kimoto E.; Lanyon L. F.; Lovett G. H.; Lian Y.; Liu W.; Martinez Alsina L. A.; Noell S.; Obach R. S.; Owen D. R.; Patel N. C.; Rai D. K.; Reese M. R.; Rothan H. A.; Sakata S.; Sammons M. F.; Sathish J. G.; Sharma R.; Steppan C. M.; Tuttle J. B.; Verhoest P. R.; Wei L.; Yang Q.; Yurgelonis I.; Zhu Y. A Second-Generation Oral SARS-CoV-2 Main Protease Inhibitor Clinical Candidate for the Treatment of COVID-19. J. Med. Chem. 2024, 10.1021/acs.jmedchem.3c02469. [DOI] [PMC free article] [PubMed] [Google Scholar]
Associated Data
This section collects any data citations, data availability statements, or supplementary materials included in this article.