Abstract
The peel-blot EM grid preparation technique is a significantly modified back-injection method with the objective of achieving a reduction in layers of multi-layered samples. This removal of layers prior to plunge freezing can aid in reducing sample thickness to a level suitable for cryo-EM data collection, improving sample flatness, and facilitating image processing. The peel-blot technique allows for the separation of multilamellar membranes into single layers, of layered 2D crystals into individual crystals, and of stacked, sheet-like structures of soluble proteins to likewise be separated into single layers. The high sample thickness of these types of samples frequently poses insurmountable problems for cryo-EM data collection and cryo-EM image processing, especially when the microscope stage must be tilted for data collection. Furthermore, grids of high concentrations of any of these samples can be prepared for efficient data collection since sample concentration prior to grid preparation can be increased and the peel-blot technique adjusted to result in a dense distribution of single-layered specimen.
SUMMARY:
The peel-blot technique is a cryo-EM grid preparation method that allows for the separation of multilayered and concentrated biological samples into single layers to reduce thickness, increase sample concentration, and facilitate image processing.
INTRODUCTION:
The peel-blot technique was developed in order to separate stacked two-dimensional crystals of membrane proteins into single layers to obtain suitably thin samples for cryo-EM 2D and 3D data collection and facilitate image processing1. The protocol is similarly suitable for other types of multilamellar samples as well as for achieving high sample concentrations of either sample type on the grid without increasing the thickness in Z. An additional advantage of the peel-blot technique is the elimination of or drastically reduced exposure to the air-water interface during the preparation.
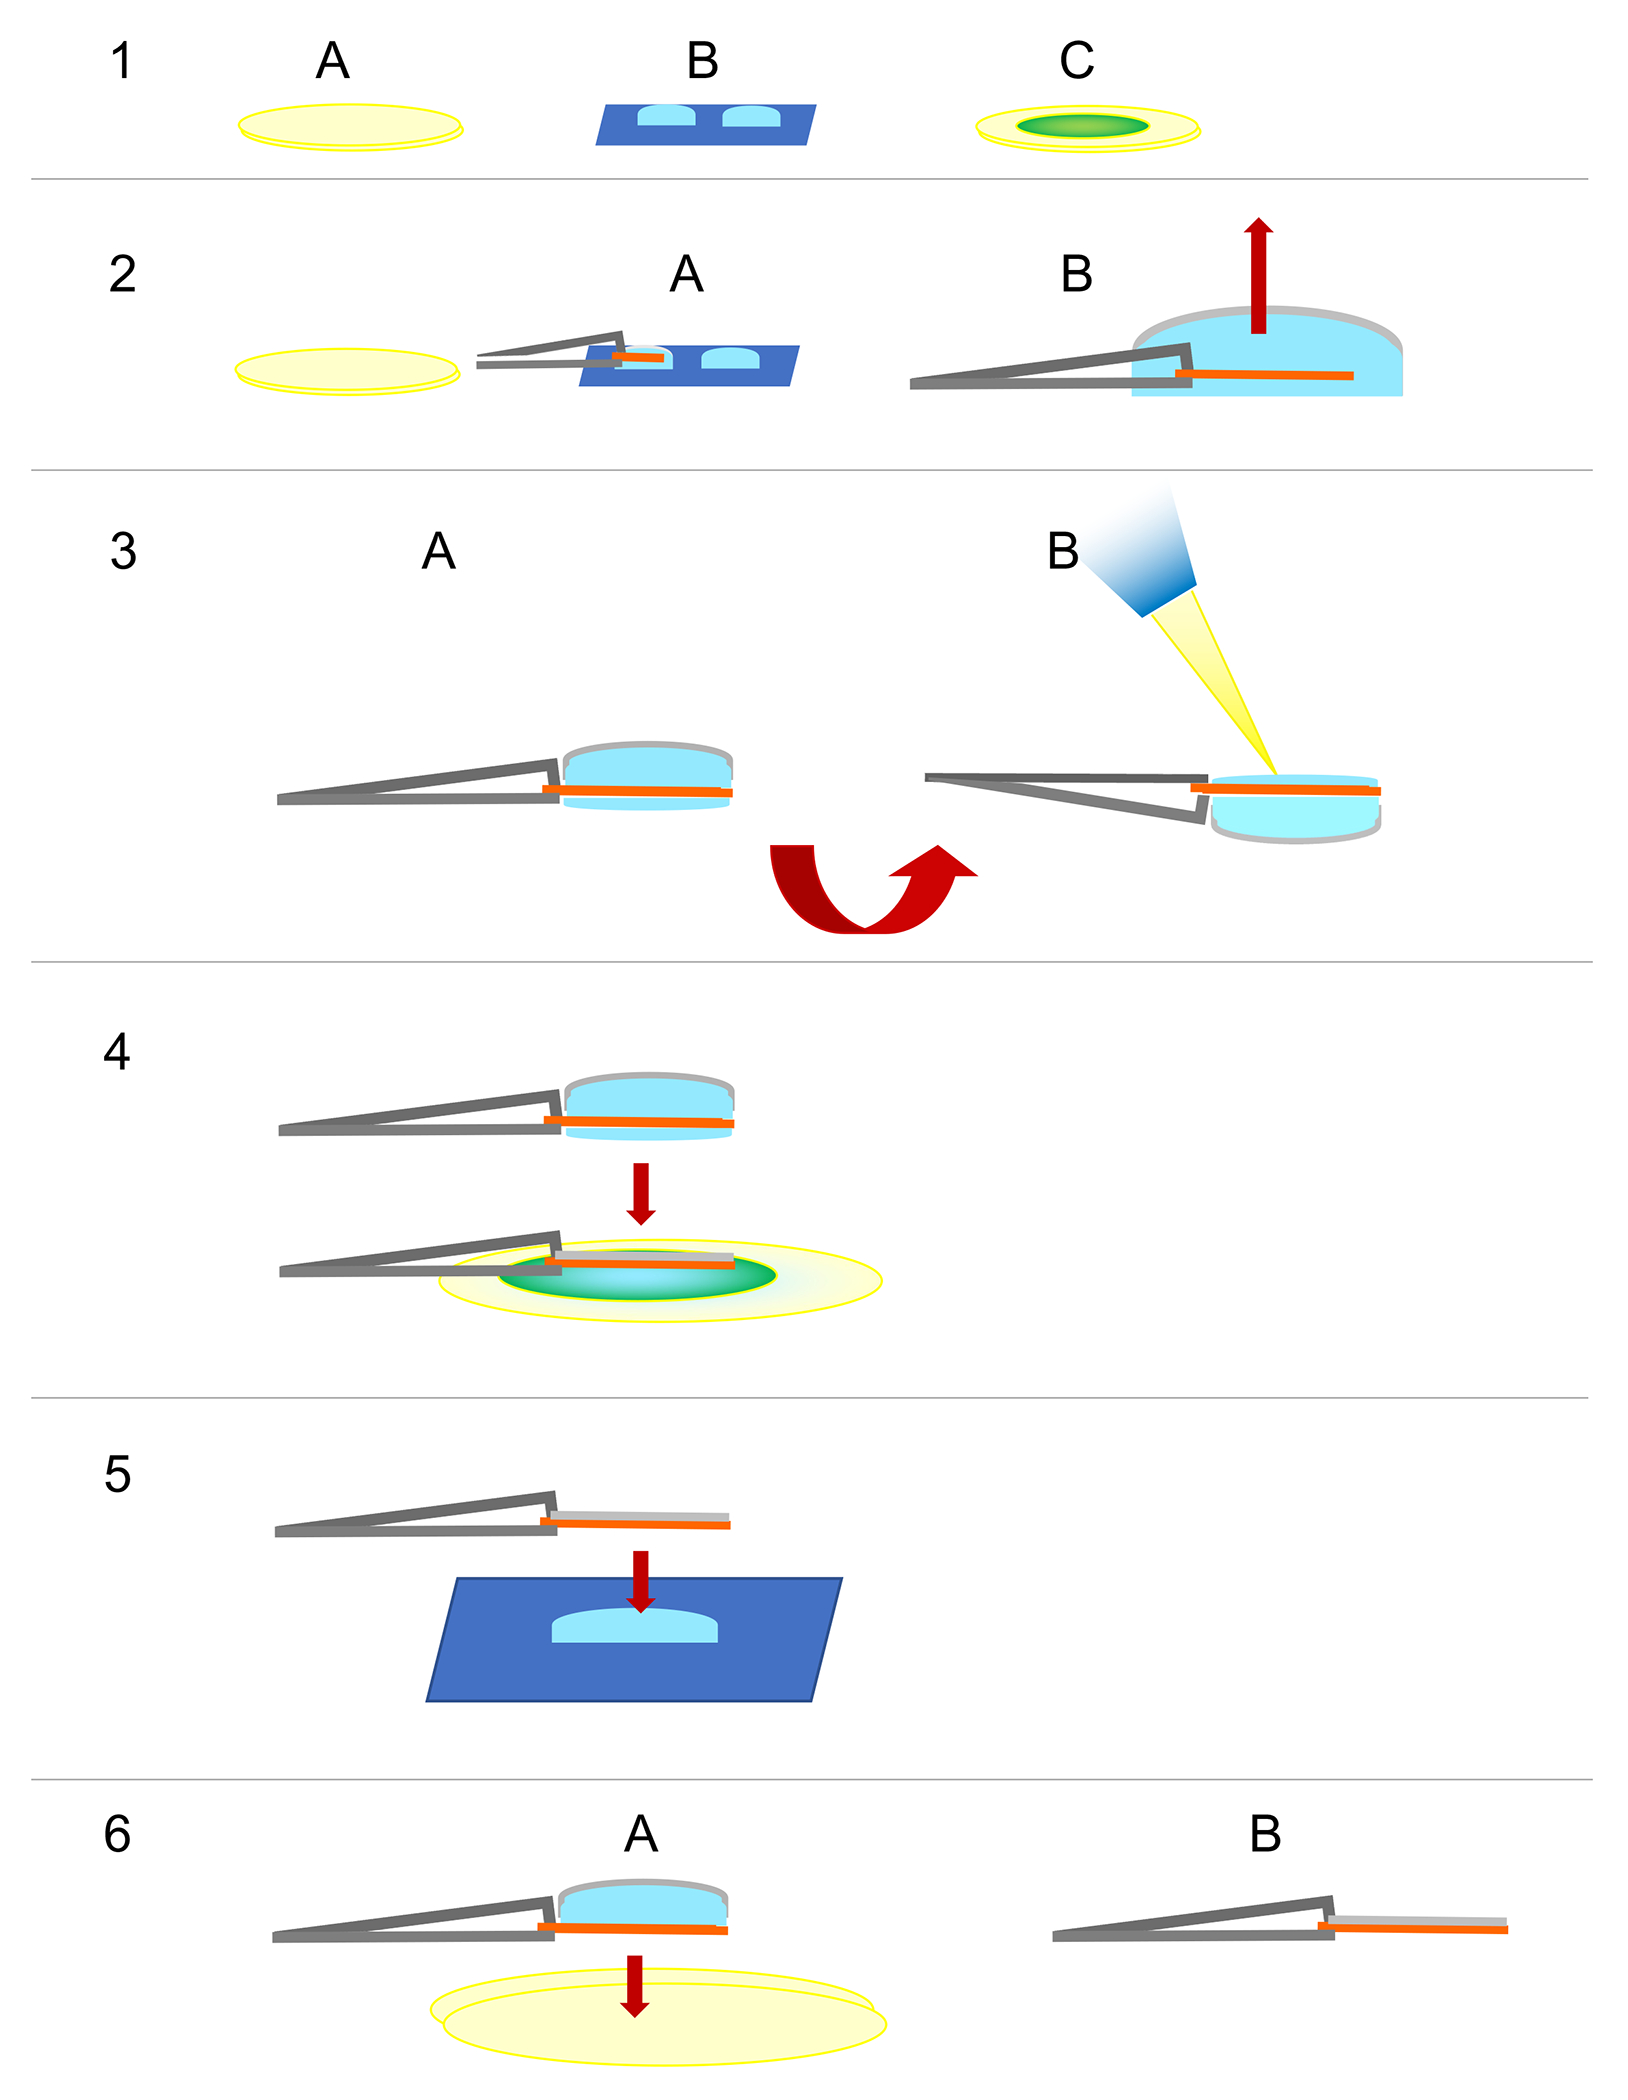
Reduction of samples layers to one layer is achieved by applying a combination of capillary pressure and shearing forces in a protocol that substantially extends on and modifies the back-injection method2. A first blotting step results in tight sandwiching and adherence to the carbon film and a grid bar on either side of the multi-layered sample during blotting on submicron rather than the 20-25μm filter paper pore size in the back-injection method. The separation, or peeling, of an individual layer occurs upon forcing the separation of the sandwiched layers once the grid is pressed vertically onto a trehalose drop, forcing the carbon film away from the grid bar (Figure 1). Repositioning of the carbon film away from the original contact point with the grid bar occurs in the next step, when the grid is once again blotted on submicron filter paper. The number of iterations of these steps can be optimized for specific samples. Furthermore, the protocol can be used to increase sample concentrations while avoiding aggregation in Z. Due to the reliance on adherence to the grid bar and carbon film as well as forceful separation, this approach may not be suitable for highly fragile molecules such as certain delicate and/or unstable proteins and protein complexes.
Figure 1. Schematic representation of the peel-blot technique.

The first two steps (Fig. 1–2 and 1–3) and the last step (Fig. 1–6) of the peel-blot technique are based on the back-injection method2 and the intermediate steps follow the peel-blot protocol (modified from Johnson et al., 20211). In step 1, (A) two pieces of Whatman #4 filter paper are stacked, (B) adjacent to a piece of parafilm with two drops of trehalose solution and (C) a piece of submicron filter paper on two additional pieces of Whatman #4 filter paper. In step 2, (A) the carbon film is floated off on the first trehalose droplet and (B) picked up with anticapillary forceps, after which it is touched to the surface of the second droplet (not shown) without breaking the surface tension to remove excess carbon film from the periphery. In step 3, (A) the forceps holding the grid are rotated by 180° (the carbon film side of the grid is now facing down) and (B) the sample is pipetted into the meniscus of the trehalose. In step 4, the grid has been rotated back to the original orientation with the carbon film facing up and the sample is slowly lowered onto the submicron filter paper. The grid is lifted up and in step 5 lowered vertically onto a 1.7μl-drop of trehalose solution. Steps 4 and 5 are referred to as “peel-blotting” and can be iterated three or more times, depending on the amount of stacking. The number of iterations may need to be optimized for different samples. In step 6, (A) the sample is blotted on two layers of Whatman #4 filter paper, before (B) it is hand plunged into liquid nitrogen.
The peel-blot technique neither requires specialized equipment nor expensive supplies. Applicability to specific samples will, however, require careful considerations of biological parameters. The decision is easier for 2D crystals as carbon film is required to ensure flatness, yet manipulation via the peel-blot technique may affect the biological integrity of the sample or crystalline order. Suitability of the peel-blot technique to single particles is restricted to and may be tested for those that require carbon film and are stable to manipulation. Specimens with critical biological interactions between layers may not be suitable for characterization with help of the peel-blot technique due to the disruption of such interactions.
The peel-blot technique (“peel-blot”) is most quickly optimized by testing and screening with negative stain or unstained samples by TEM at room temperature. Once the optimal number of peel-blot iterations have been identified, the time to control thickness before vitrification can be determined.
PROTOCOL:
1. Preparation steps for the peel-blot technique.
Preparation requires for the following items to be placed adjacent to each other:
1.1 Stack two pieces of Whatman #4 filter paper (or equivalent 20-25μm pore size filter paper).
1.2 Place a rectangle of ~10cm long Parafilm adjacent to the filter paper with the paper facing up.
1.3 Place a piece of submicron filter paper on top of two additional pieces of Whatman #4 filter paper (Figure 1–1).
1.4 Position the anti-capillary forceps with the bent leg facing up and the straight leg facing down. Then select a 600-mesh grid with the smooth/shiny side up. Place the forceps on a Petri dish or other raised surface to avoid contact of the clean grid with other items.
1.5 Remove the paper from the parafilm and pull the sides (~5mm) to create a small rim. Pipette two 150μl drops of 4% trehalose solution ~1-2cm from one short side of the Parafilm and ~1cm apart on the Parafilm.
1.6 On a separate bench or on the floor, pour liquid nitrogen in a small Styrofoam container (CAUTION: receive training for proper handling using gloves and a face shield in order to avoid frost bite). Place a small cryo-EM grid container in the liquid nitrogen and cover the Styrofoam container with Kim Wipes.
2. Placing the carbon film onto the grid.
Use Dumont #5 forceps to float of the carbon film from the mica by touching one side of the mica at a slight angle downwards (~20-40°) on one of the drops of trehalose solution and slowly let the water tension lift off the carbon film by moving the mica downwards. Release the mica once the carbon film floats on the surface of the droplet.
2.1 Visually inspect the carbon film to avoid using carbon with damage in the form of fractures.
2.2 Insert the grid held by the anti-capillary forceps at an angle (~20-30°) into a trehalose drop at a position adjacent to and then centered under the carbon film. Pick up the carbon film (Figure 1–2).
2.3 Keep the grid in the same orientation and slowly lower it onto the surface of the second drop of trehalose without breaking the surface tension of the drop to remove unnecessary carbon film that may have wrapped around the rim of the grid to the rough side.
3. Separation of multi-layered 2D crystals into single layers.
Rotate the anticapillary forceps and place them on a Petri dish with the carbon side of the grid facing down (Figure 1–3).
3.1 Pipette 1.3μl of the sample into the slight trehalose meniscus on top of the grid. Pipette the solution ~8-10 times to mix and distribute the trehalose and sample on both sides of the grid.
3.2 While, incubating the solution for 1 minute, pipette one or more 1.7μl drops of trehalose solution onto the Parafilm.
3.3 Rotate the grid back into its original position with the carbon film facing up.
3.4 Use the anticapillary forceps to press the grid onto the submicron filter paper (Figure 1, step 4). [WE HAVE A CLOSE-UP VIDEO FOR THIS STEP] Once the solution has been absorbed by the filter paper and the carbon film is lying flat, wait for 3s before lifting the grid and moving it vertically onto the 1.7μl-drop of trehalose solution (Figure 1–5).
NOTE: Repeat this step multiple times for highly stacked samples, or the grid is prepared for vitrification in the next steps.
3.5 Blot the grid on the two pieces of Whatman filter paper, then lift the grid from the filter paper (Figure 1–6). After approximately 13s, depending on humidity and sample buffer, plunge the grid into the liquid nitrogen in the small Styrofoam container and place the grid in the cryo-EM grid container or transfer it directly for cryo-EM screening or data collection.
NOTE: In order to rapidly optimize the protocol, negatively stained the peel-blotted grid at this step rather than plunging it into liquid nitrogen. Negatively stain the sample by applying 3μl of 1% uranyl acetate to the grid, incubate the grid for 30s, and blot it with a torn piece of Whatman #4 filter paper. Grids of 2D crystals vitrified in trehalose or glucose are routinely hand-plunged for vitrification as trehalose and glucose prevent the formation of crystalline ice2.
REPRESENTATIVE RESULTS:
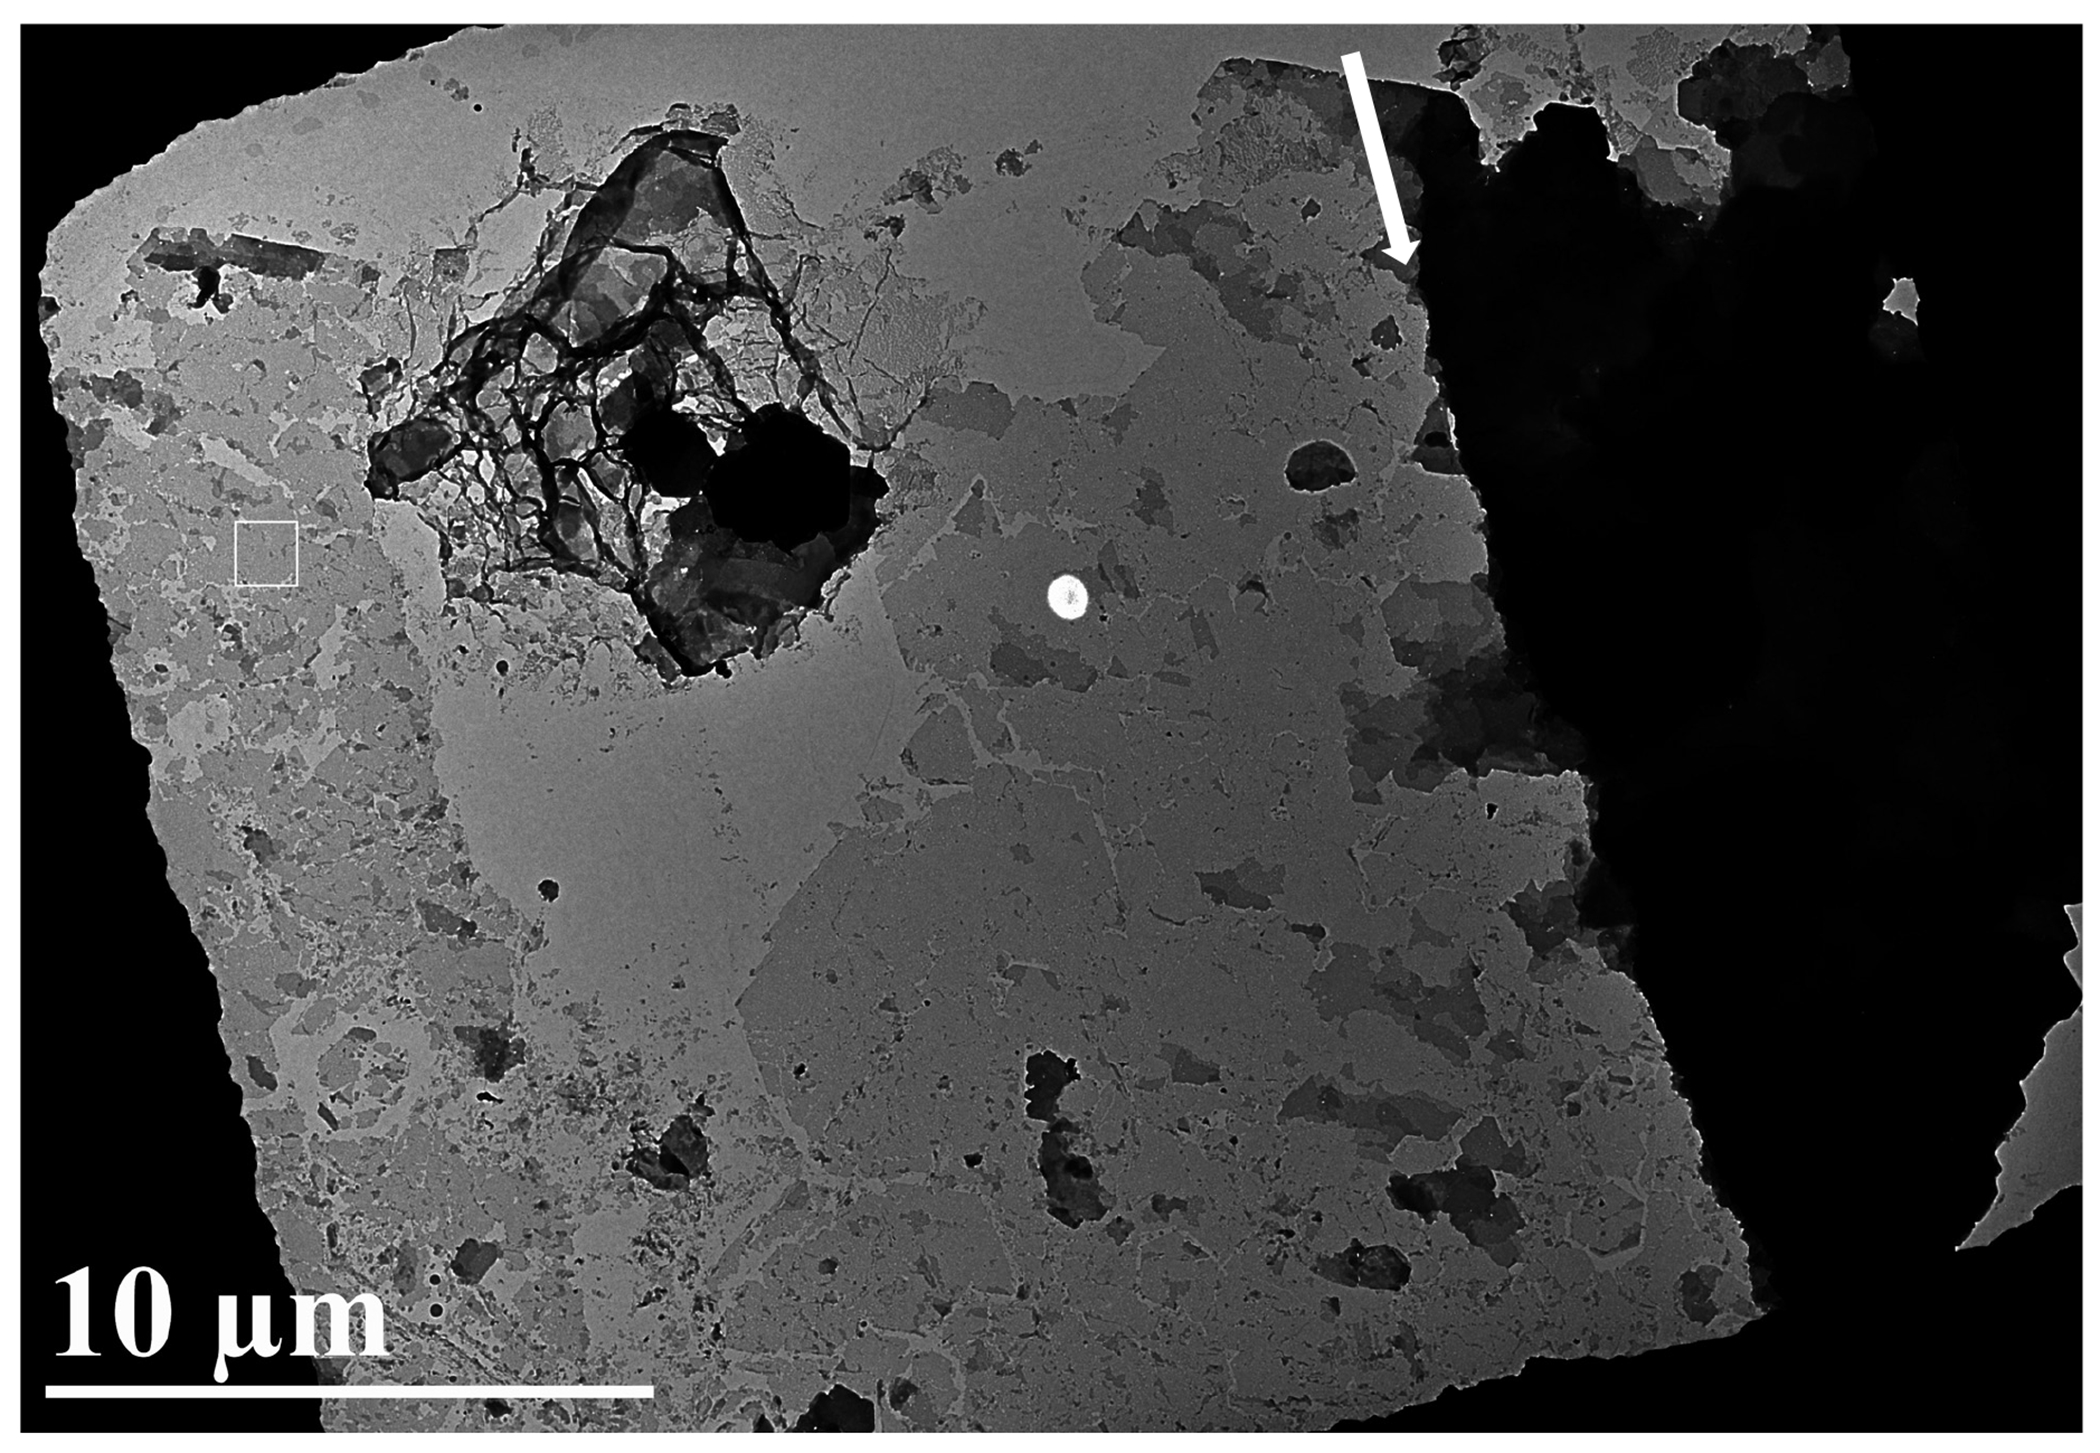
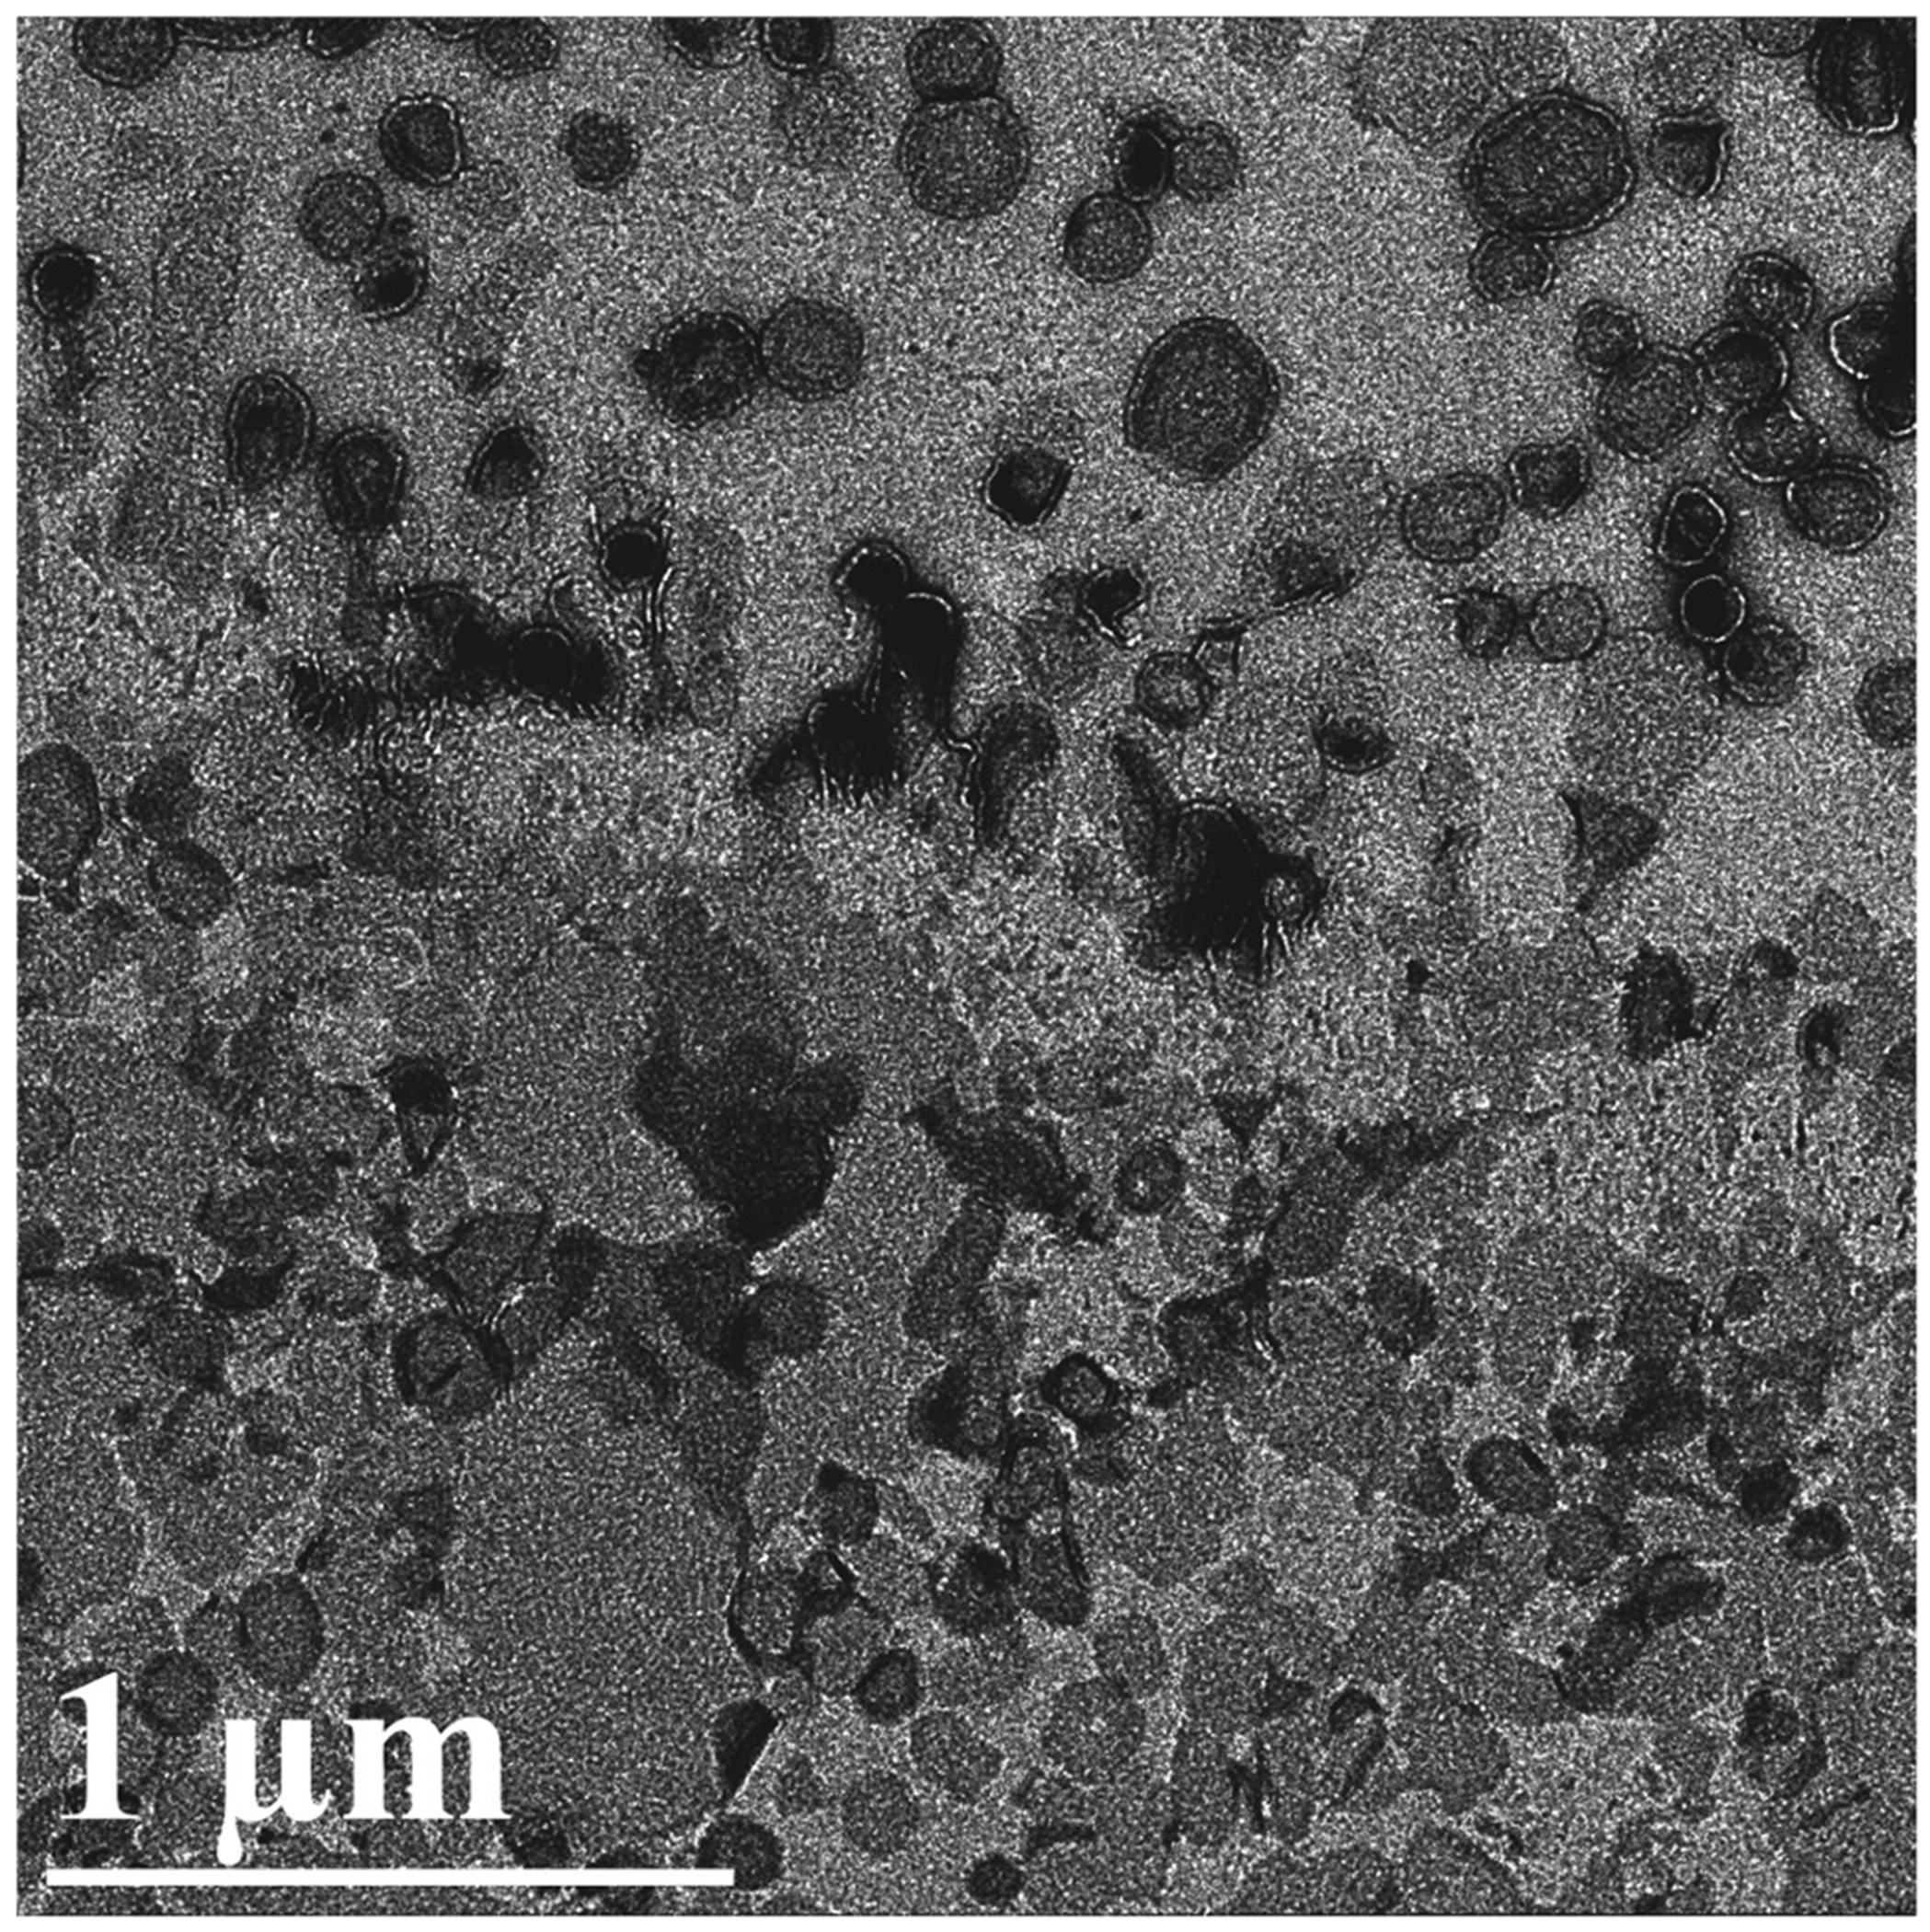
A successful peel-blot experiment will result in single layers of samples at often high concentrations. It is to be expected that some regions in most grid squares will still contain multiple layers, especially at fewer numbers of iterations of the peel-blot steps. The majority of grid squares, however, will contain extensive regions of single layers as observed for 2D crystals of human leukotriene C4 synthase (Figure 2) and liposomes (Figures 3). Additional peel-blot steps may need to be tested for samples that do not show the desired reduction in layers.
Figure 2. A 2D crystal sample subjected to the peel-blot method.

The region to the left of the arrow was largely reduced to single-layered 2D crystals in a contact region between the carbon film and grid bar that was peel-blotted and then shifted, while the region to the right of the arrow was not in a region affected by the peel-blot. The peel-blotted regions can easily be selected for and are observed on most of the grid. The 2D crystals shown are stacked and single-layer 2D crystals of human leukotriene C4 synthase. The scale bar corresponds to 10μm.
Figure 3. Liposomes subjected to the peel-blot.

The peel-blot can successfully be applied to interrupt the edges of collapsed liposomes and vesicles to result in regions with large, mostly single-layered phospholipid bilayers as observed in the lower half of the image. The upper half was not in a contact zone between the grid bar and the carbon film and thus contains complete liposomes with two phospholipid bilayers. The scale bar corresponds to 1μm.
The most important indication of a successful peel-blot experiment will be the data quality and biological integrity observed following high-resolution cryo-EM data collection and image processing. Data interpretation will need to include careful consideration of potential damage or distortion to contact regions between layers.
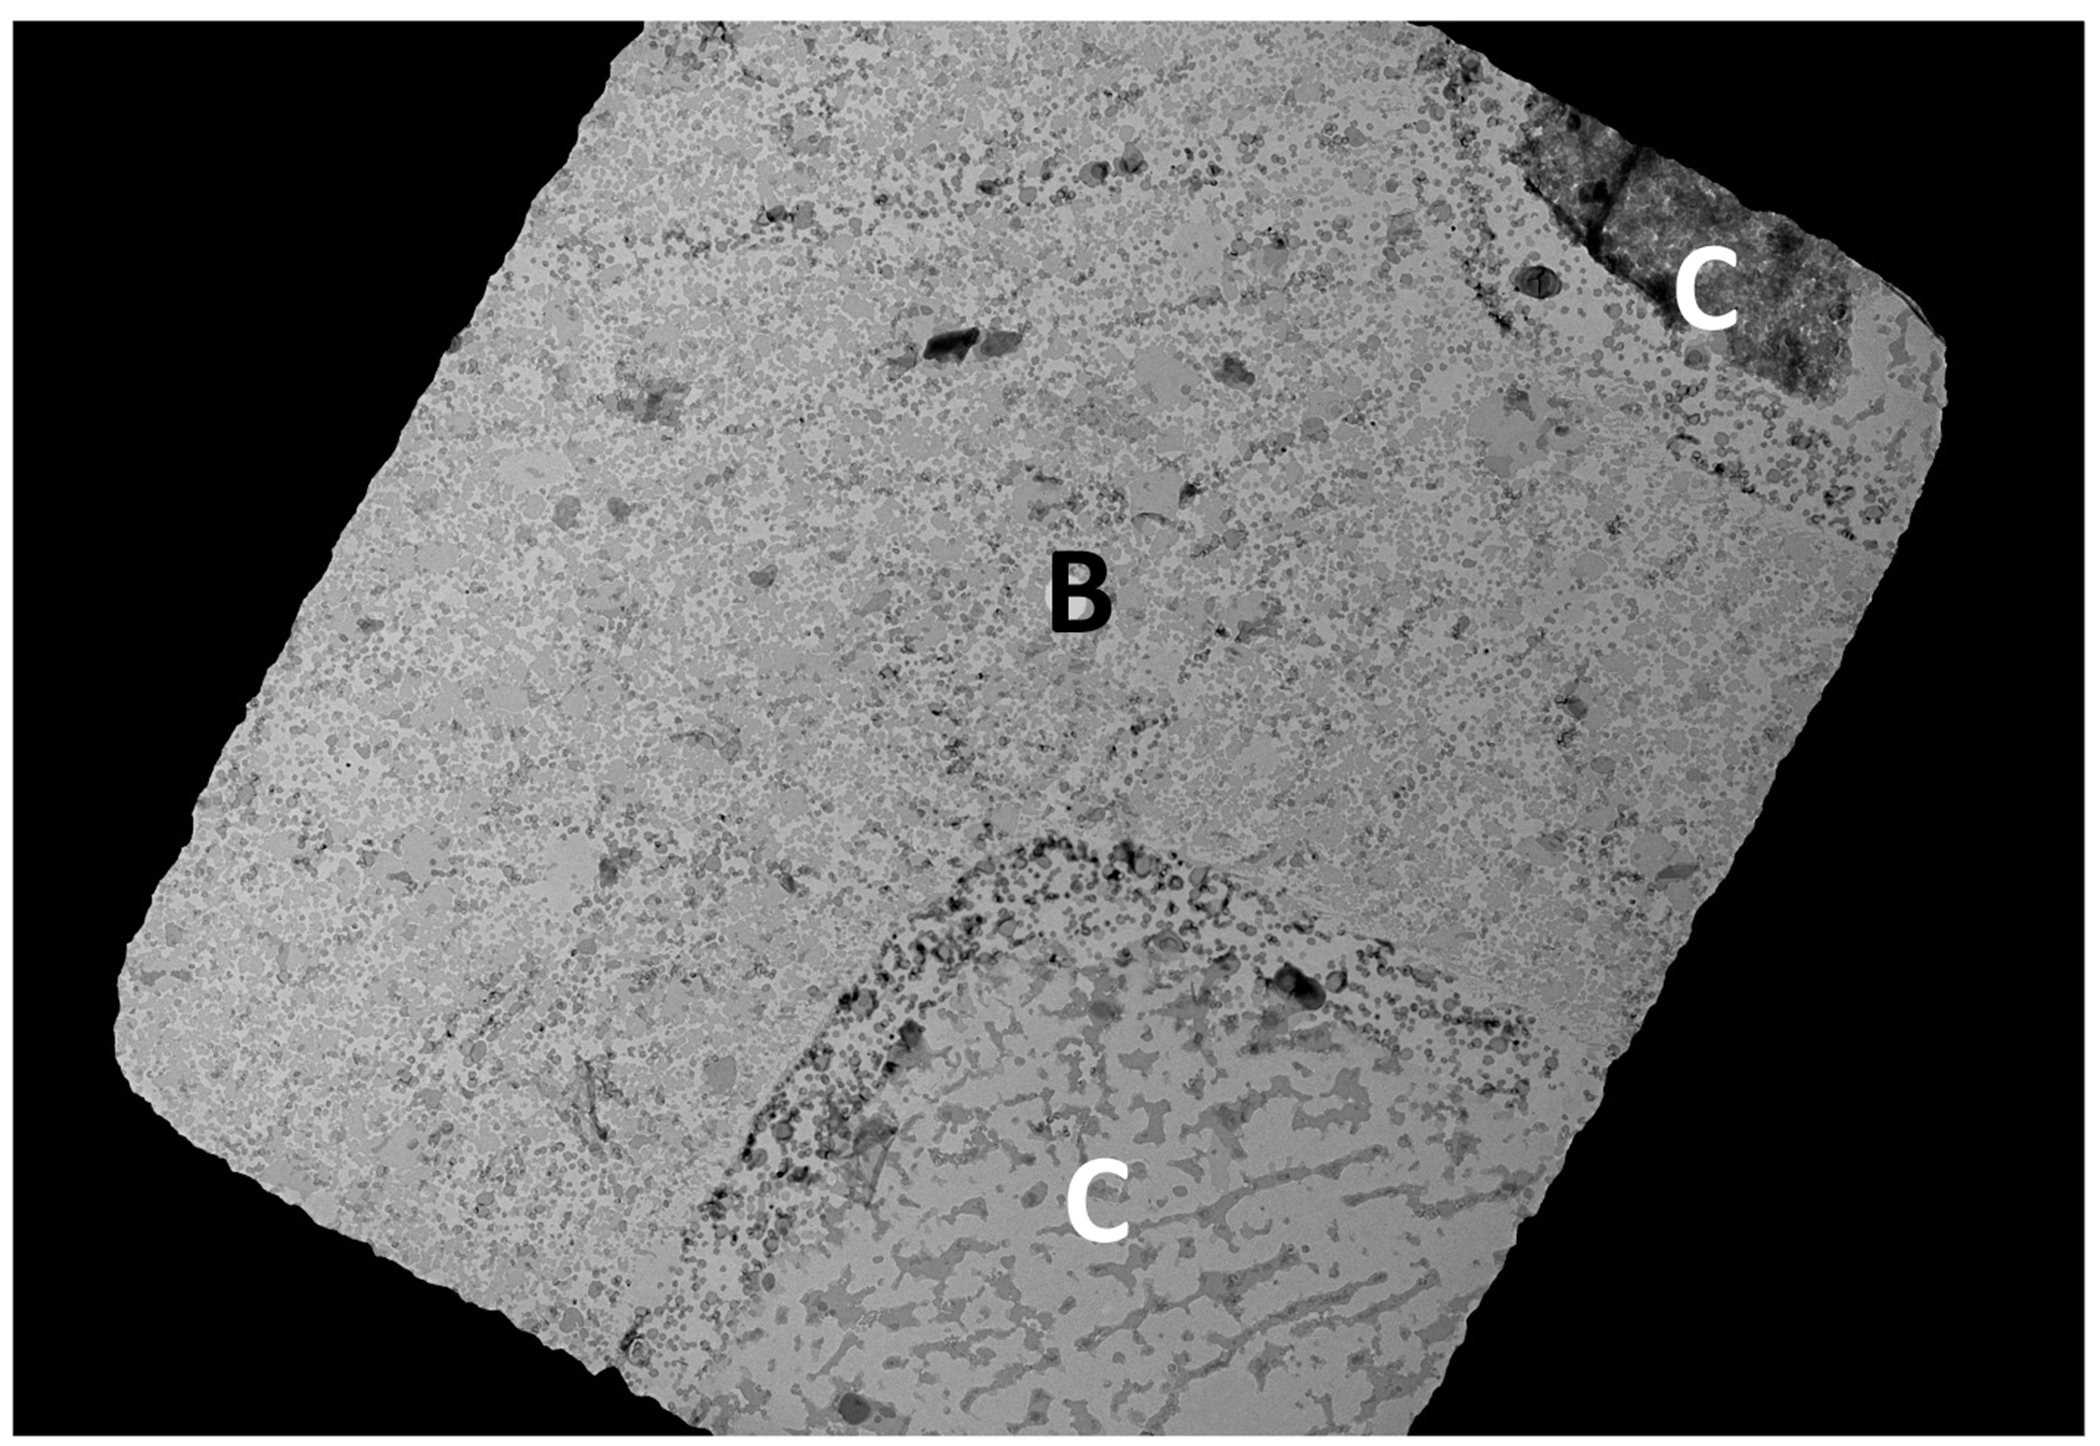
Regions of the EM grid in which peel blotting has occurred typically display a higher concentration of sample than regions in which it has not occurred. This apparent concentrating effect is caused by the adherence of the multilamellar sample to both the carbon film and the grid bar surfaces, followed by additional adherence to both surfaces during the peel-blot preparation as they repeatedly separate, reposition slightly, and again make contact. The result is that the different layers of the original multi-lamellar sample are spread apart over a larger lateral area (Figures 3 and 4). These regions can even contain larger 2D crystals or membranes. Both phenomena are easily observed and compared in areas where a “peel zone” is adjacent to an area not affected by the peel-blot step (Figure 3).
Figure 4. The peel-blot footprint.

The grid square of a 400-mesh grid shows the footprint (labelled “B”) of the grid bar and the resulting peel-blotted regions as well as the regions (labelled “C”) that were not in contact with a grid bar, or subjected to fewer peel-blot iterations.
The images in Figures 2–4 were collected under low-dose conditions at an accelerating voltage of 120kV with a JEOL JEM-1400 equipped with a Gatan Ultrascan 1000 CCD camera.
DISCUSSION:
The peel-blot is a powerful method to overcome stacking and thickness of multi-layered 2D crystals and similar samples for cryo-EM data collection and image processing. A decision on the use of the peel-blot will be based on biological parameters of the sample and will also require assessment once a 3D cryo-EM model is available. The biological importance of contacts and potential flexibility of contact regions will be particularly important in this assessment.
The number of peel-blots will initially be established via observation after standard negative stain grid preparation, where excessive layers or thickness will require alternative strategies to standard cryo-EM grid preparation. Thin multi-layered crystals that are stacked in register may be directly used for microED3 or FIB-milled in the case of thicker crystals4. The peel-blot will usually not be necessary for double-layered 2D crystals as layers can be processed individually or together, when the layers are in register5. It could potentially be beneficial for exposing both sides of membrane protein 2D crystals to ligands or inhibitors though, once in solution before peel-blotting, and once after the final peel-blotting step. In addition, reducing large, well-ordered double-layered 2D crystals may allow for electron diffraction6,7. Multi-layers, either induced or biologically occurring, of 2D crystals of membrane and soluble proteins will be the most likely targets for the peel-blot, even though the protocol can be applied to a range of specimens and serve to concentrate various samples for cryo-EM (Figure 4).
Initial testing with negative stain will dramatically reduce the time and cost to optimize the samples as freezing, preparation of cryo-EM sample holders, transfer to a cryo-EM, and use of a cryo-EM are not required. Only the drying time before the freezing step will need to be optimized separately. The drying time will be identical or very similar to the time used for drying a standard back-injection grid of the same sample1.
While 600-mesh grids generally result in good preservation of the carbon film, increased numbers of peel-blot iterations and thinner carbon film layers may lead to increased carbon film breakage (Figure 5). Stacked 2D crystals, liposomes, and layered samples of large arrays of soluble proteins can be successfully separated (Figures 2–4).
Figure 5. Blotting an EM grid prepared by back-injection on a submicron filter paper, using carbon film that is too thin.

Images are single frames from a video at (A) initial contact with the membrane, (B) 1 ms after contact, and (C) 2 ms after contact. The arrow indicates grid squares in which capillary pressure has ruptured the carbon film.
The sample is carefully evaluated by cryo-EM to ensure that adverse effects on sample quality are avoided. This may be achieved by image processing to compare images of stacked and unstacked crystals. Both for assessment purposes and to achieve the goal of a 3D model, image processing is conducted via the 2dx programs available in Focus8,9, which also implements single particle approaches to address lattice imperfections and protein heterogeneity with the possibility to dramatically increase upon the inherent quality of the original 2D crystals10.
Supplementary Material
Table of Materials
| Name of Material/ Equipment | Company | Catalog Number | Comments/Description |
|---|---|---|---|
| Whatman #4 filter paper | MilliporeSigma | WHA1004150 | This corresponds to the 20-25μm pore size filter paper in the protocol. |
| Submicron filter paper | MilliporeSigma | DAWP04700 | |
| Trehalose | Prepare 4% trehalose solution. | ||
| 600-mesh grids | SPI | 2060-C-XA | |
| Anti-capillary forceps | Ted Pella | 510-5 | |
| Dumpont #5 forceps | Ted Pella | 5622 | |
| Mica | Ted Pella | 56 | The mica is carbon-coated and cut into squares that are slighlty larger than a TEM grid. The carbon thickness may require optimization to avoid thin carbon that breaks easily upon multiple peel blots. |
| Grid box for cryo-EM storage | Ted Pella | 160-40 | |
| polystyrene container | Used for vitrifying the peel-blot grid. A polystyrene shipping container can be recycled for this purpose and lined with aluminium foil. | ||
| Carbon to coat mica | |||
| Negative stain | 1-2% uranyl acetate is suitable for many samples. Other stains such as phosphotungstic acid can be substituted. | ||
| Liquid nitrogen | |||
| Parafilm | |||
| Kim Wipes | |||
| Transmission electron microscope | JEOL | JEM-1400 | Any TEM operated at an accelerating voltage of 80-120kV will be suitable for screening of negatively stained grids. |
| cryo-EM | Cryo-EM grids may be screened at 120kV or 200kV. High-resolution data is collected at 300kV. |
ACKNOWLEDGMENTS:
Part of this work was supported by NIH grant HL090630 (ISK).
Footnotes
A complete version of this article that includes the video component is available at http://dx.doi.org/10.3791/64099.
DISCLOSURES:
The authors do not have competing financial interests or other conflicts of interest.
Contributor Information
Matthew C. Johnson, Georgia Institute of Technology, School of Biological Sciences, 310 Ferst Drive, Atlanta, GA 30332, U.S.A.
Arshay J. Grant, Georgia Institute of Technology, School of Biological Sciences, 310 Ferst Drive, Atlanta, GA 30332, U.S.A.
Ingeborg Schmidt-Krey, Georgia Institute of Technology, School of Biological Sciences, School of Chemistry and Biochemistry, 310 Ferst Drive, Atlanta, GA 30332, U.S.A.
REFERENCES:
- 1.Johnson MC, Uddin YM, Neselu K, Schmidt-Krey I 2D crystallography of membrane protein single-, double- and multi-layered ordered arrays. Methods in Molecular Biology. 2215, 227–245 (2021). [DOI] [PubMed] [Google Scholar]
- 2.Kühlbrandt W, Downing KH. Two-dimensional structure of plant light harvesting complex at 3.7 Å resolution by electron crystallography. Journal of Molecular Biology. 207, 823–826 (1989). [DOI] [PubMed] [Google Scholar]
- 3.Nannenga BL, Gonen T. MicroED: a versatile cryoEM method for structure determination. Emerging Topics in Life Sciences. 2(1), 1–8 (2018). [DOI] [PMC free article] [PubMed] [Google Scholar]
- 4.Martynowycz MW, Zhao W, Hattne J, Jensen GJ, Gonen T. Collection of Continuous Rotation MicroED Data from Ion Beam-Milled Crystals of Any Size. Structure. 27 (3), 545–548 (2019). [DOI] [PMC free article] [PubMed] [Google Scholar]
- 5.Gonen T, Cheng Y, Sliz P, Hiroaki Y, Fujiyoshi Y, Harrison SC, Walz T. Lipid-protein interactions in double-layered two-dimensional AQP0 crystals. Nature. 438 (7068), 633–638 (2005). [DOI] [PMC free article] [PubMed] [Google Scholar]
- 6.Gonen T The collection of high-resolution electron diffraction data. Methods in Molecular Biology. 955, 153–169 (2013). [DOI] [PMC free article] [PubMed] [Google Scholar]
- 7.Wisedchaisri G, Gonen T Phasing electron diffraction data by molecular replacement: strategy for structure determination and refinement. Methods in Molecular Biology. 955, 243–272 (2013). [DOI] [PMC free article] [PubMed] [Google Scholar]
- 8.Gipson B, Zeng X, Zhang ZY, Stahlberg H 2dx—user-friendly image processing for 2D crystals. Journal of Structural Biology. 157 (1), 64–72 (2007). [DOI] [PubMed] [Google Scholar]
- 9.Biyani N, Righetto RD, McLeod R, Caujolle-Bert D, Castano-Diez D, Goldie KN, Stahlberg H Focus: The interface between data collection and data processing in cryo-EM. Journal of Structural Biology. 198 (2), 124–133 (2017). [DOI] [PubMed] [Google Scholar]
- 10.Righetto R, Stahlberg H Single Particle Analysis for High-Resolution 2D Electron Crystallography. Methods in Molecular Biology. 2215, 267–284 (2021). [DOI] [PubMed] [Google Scholar]
Associated Data
This section collects any data citations, data availability statements, or supplementary materials included in this article.


