

Abstract
Background
Cost is a key outcome in quality and value, but it is often difficult to estimate reliably and efficiently for use in real-time improvement efforts. We describe a method using patient-reported outcomes (PROs), Markov modeling, and statistical process control (SPC) analytics in a real-time cost-estimation prototype designed to assess cost differences between usual care and improvement conditions in a national multicenter improvement collaborative—the IBD Qorus Learning Health System (LHS).
Methods
The IBD Qorus Learning Health System (LHS) collects PRO data, including emergency department utilization and hospitalizations from patients prior to their clinical visits. This data is aggregated monthly at center and collaborative levels, visualized using Statistical Process Control (SPC) analytics, and used to inform improvement efforts. A Markov model was developed by Almario et al to estimate annualized per patient cost differences between usual care (baseline) and improvement (intervention) time periods and then replicated at monthly intervals. We then applied moving average SPC analyses to visualize monthly iterative cost estimations and assess the variation and statistical reliability of these estimates over time.
Results
We have developed a real-time Markov-informed SPC visualization prototype which uses PRO data to analyze and monitor monthly annualized per patient cost savings estimations over time for the IBD Qorus LHS. Validation of this prototype using claims data is currently underway.
Conclusion
This new approach using PRO data and hybrid Markov–SPC analysis can analyze and visualize near real-time estimates of cost differences over time. Pending successful validation against a claims data standard, this approach could more comprehensively inform improvement, advocacy, and strategic planning efforts.
Keywords: inflammatory bowel disease, quality improvement, Learning Health System, Markov Modeling, Statistical Process Control, cost difference
Introduction
IBD Qorus (Qorus) is a national multicenter improvement collaborative sponsored by the Crohn’s & Colitis Foundation. Qorus uses a patient-focused, registry-enabled LHS approach (Nelson et al1) and has developed quality measures2 within a balanced Clinical Value Compass framework to assess variation in adult inflammatory bowel disease (IBD) care quality and outcomes (Figure 1).3,4 This improvement collaborative utilizes a modified Institute for Healthcare Improvement Breakthrough Series (BTS) model5 to decrease identified variation and improve care quality and outcomes. This work explores potential cost differences created through participation in the Qorus collaborative.
Figure 1:
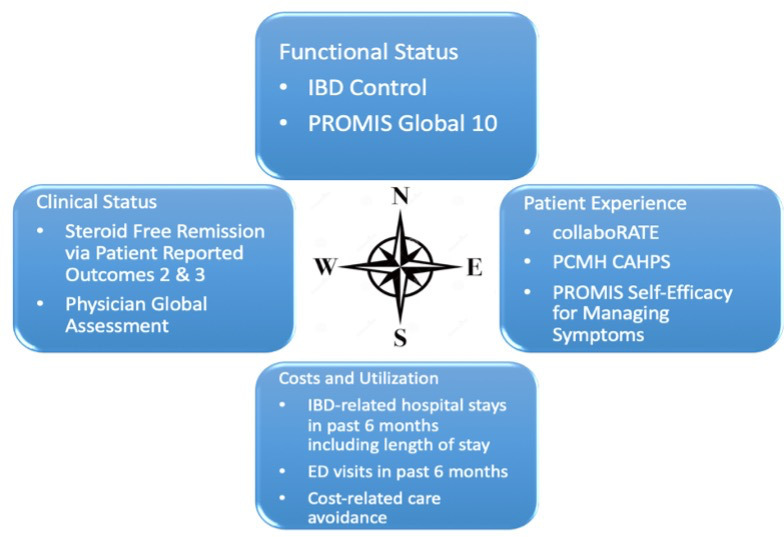
The IBD Qorus Clinical Value Compass . CAHPS = Consumer Assessment of Healthcare Providers and Systems; ED = emergency department; IBD = inflammatory bowel disease; PCMH = Patient-Centered Medical Home; PROMIS = Patient-Reported Outcomes Measurement Information System.
The Crohn’s & Colitis Foundation developed a patient-reported outcomes (PROs) registry linked to a feedback reporting structure [the IBD Qorus quality improvement (QI) reporting system]. PROs are collected via a 14-item pre-visit questionnaire administered electronically or on paper to all adult persons with IBD seen in an outpatient setting of a member clinic. Feedback reports track health outcomes across sites within the collaborative, both longitudinally and cross-sectionally, for benchmarking (Figure 2) and informing Qorus sites engaged in improvement work, as well as Qorus leadership engaged in strategic planning and decision-making. PRO data is currently in the clinical and functional health domains of the Clinical Value Compass predominantly, but here we report on development of the cost/utilization domain. This work focuses on 2 questions in the pre-visit questionnaire: 1) Have you been to the ED in the past 3 months due to your IBD, and 2) Have you been hospitalized in the past 3 months due to your IBD? This builds upon recent work by Almario et al6 using Markov analysis to estimate urgent care-related cost differences and PRO data collected during the IBD Qorus Urgent Care BTS collaborative (2018–2019).7
Figure 2:

Sample page from the IBD Qorus QI reporting system. ED = emergency department; IBD = inflammatory bowel disease; QI, quality improvement. From IBD Qorus All Sites Call webinar, July 2021. Reproduced with permission from Crohn’s & Colitis Foundation.
Markov modeling
Markov models were introduced in the early 20th century and are a form of decision analysis used to study stochastic processes in which there are transitions between one state to another. For example, a person with IBD may transition from a healthy state to an unhealthy state requiring emergency care.8 A stochastic process has a random probability distribution that cannot be precisely predicted but can be statistically approximated. Markov models are particularly useful for modeling environments in which there are sequential stochastic decisions occurring over time. For example, a person with IBD in stable status experiences a worsening in status that then requires emergency department (ED) care and can then result either in resolution of the problem or require hospitalization. Markov analysis has been utilized in many settings including physics, finance, social sciences, queuing theory, and health care. Common analytical approaches utilized for Markov analyses include Monte Carlo simulation, Markov decision process simulation, dynamic programming, and machine learning (reinforcement learning).9–11 In health care, Markov analyses have been commonly utilized in cost effectiveness and utility analyses (eg, calculating differences in quality adjusted life years or QALYs) to determine the relative value of one state vs another9 and to determine the relative value of one mode of treatment vs another.12
Markov modeling augments a standard decision tree by conducting probabilistic analyses between 2 assigned states (A and B) for each branch (or node) of the decision tree. Each of these potential outcomes (or branches on the decision tree) can be assigned likelihood probabilities (based on available evidence). Markov calculations can be conducted at the end of each branch to determine the overall probability of each Markov state, A (recovery) or B (death), for each exposure state (Hib vaccination vs no vaccination). These probabilities can then be used to calculate relative value units for each state (eg, cost, QALYs).
The IBD Qorus Markov study
Almario et al6 conducted a Markov analysis using PROs, specifically ED and hospitalization data, collected from people with IBD followed at 27 care centers in the United States participating in the IBD Qorus Urgent Care BTS collaborative (2018–2019).6 They compared baseline (the first 5 months of the BTS) to exposure (final 5 months of the BTS, representing the improvement intervention) states. Markov analysis was employed to assess for 3 potential outcome states: 1) clinical remission (not requiring urgent care), 2) required ED care but not hospitalization, and 3) required ED care and hospitalization.
PRO data for ED utilization and hospitalizations from the IBD Qorus QI reporting system provided monthly rates (probability estimates) for ED and hospitalization. These rates were used to calculate cost estimates for ED and hospitalization using the Consumer Price Index,13 which were compared to the estimated cost of care for a person with IBD not requiring urgent care.14 Markov analyses were conducted for a 1-year observation period (12 monthly cycles) and a Monte Carlo simulation was utilized to conduct a sensitivity analysis on the final model output. They found a relative cost difference of $2537 USD per person with IBD for the intervention state vs baseline.
Almario et al6 provided initial cost-estimation evidence to accompany published findings by Melmed et al documenting improvement in multiple IBD care metrics following the Urgent Care BTS.9 However, there is a key limitation in this important work—it is based on static reference points for its probability estimates—the monthly rates for ED utilization and hospitalization used in Almario et al6 are derived from 2 set (static) periods of time (a 5-month baseline in 2018 and a 5-month intervention period in 2019). This limits capability to a single “annualized point estimate” of cost difference between baseline and intervention states. In order to conduct cost estimate comparisons for other time periods, a dynamic approach would be needed in which the baseline and intervention time periods (and their respective probability estimates for ED and hospitalization) could be selected to observe the variation based on actual monthly rates from the PRO data collected from Qorus sites longitudinally. We describe the development of such an approach, which integrates the Markov approach by Almario et al with modern statistical process control (SPC)15 methods.
Methods
We developed a Markov–SPC prototype for estimating monthly and overall cost differences between selected baseline and intervention time periods for a selected time range (Figure 3). The authors’ method has 4 steps: 1) IBD Qorus PRO data for ED utilization and hospitalizations, 2) calculation of an estimated annualized urgent care (ED utilization and hospitalizations) cost estimate for the time period selected, 3) repetition of steps 1 and 2 at monthly intervals to generate iterative monthly point estimates, and 4) SPC analysis and visualization.
Figure 3:
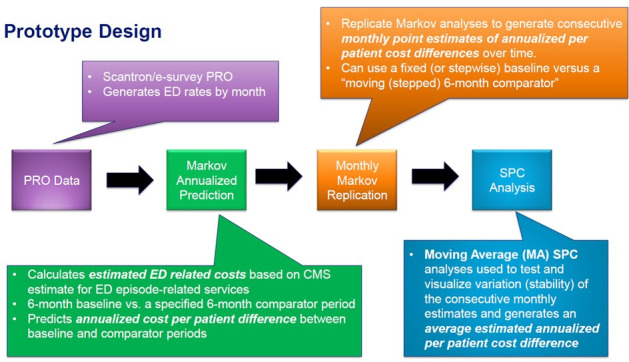
The Markov–SPC prototype. ED = emergency department; PRO = patient-reported outcomes; SPC = statistical process control.
PRO data
Participating Qorus sites collect pre-visit surveys questionnaires from IBD patients before care visits. These questionnaires collect PRO data on ED utilization and hospitalizations, which is then aggregated at monthly intervals for each site and for the Qorus collaborative overall. This provides monthly rate of ED utilization and hospitalization, and can be used as Markov probability estimates for each month. In 2019, van Deen et al found a high degree of accuracy in IBD Qorus PRO data reporting when compared to clinical documentation.16 SPC analyses and visualizations are then rendered, providing monthly data (see Figure 2 for an example of SPC analyses and visualizations).
Annualized point estimates
The second step in the process is calculation of annualized cost-difference estimates of urgent care-related costs between baseline and intervention states. We used a Markov procedure similar to that conducted by Almario et al,6 including PRO data on ED and hospitalization and the same method for the assignment of costs for each of the Markov outcome states: 1) remission (no urgent care), 2) ED care only, and 3) ED care leading to hospitalization. However, the authors’ approach differs from Almario et al in 2 respects. First, we use 6-month baseline and intervention comparison intervals (Almario et al used 5-month intervals). Second, we allow for the flexible assignment (selection) of baseline and intervention periods and overall duration. The resulting Markov analysis predicts the annualized cost difference based on a selected 6-month baseline vs a subsequent 6-month comparison period. For example, the baseline state from January to June 2020 would be compared to a subsequent intervention state from July to December 2020 and then annualized (using the same 12-cycle Markov approach used by the Almario et al) to create a point estimate for the month ending in December 2020.
Replication
The third step in the process involves replication of the first 2 steps at monthly intervals for the duration of the overall time period selected to generate new annualized point estimates (for annualized cost difference in urgent care utilization between baseline and intervention states) over successive months. We used a fixed 6-month baseline period and allowed the monthly interval to “step forward” at monthly increments (Figure 4). The first monthly point estimate was obtained by comparing the baseline period (January–June 2020) to the first intervention period ending 6 months later (July–December 2020) yielding an estimate for December 2020. This can be replicated for a comparison of the fixed baseline period (January–June 2020) to another 6-month intervention period ending 1 month later (August 2020–January 2021) and yielding a point estimate for January 2021, and then for n cycles ending at the close of the selected time period. The example shown in Supplemental Content 1 includes the baseline period (January–June 2020), the first 2 monthly estimate iterations described above (July–December 2020 and August 2020–January 2021) and 3 additional iterations (September 2020–February 2021, October 2020–March 2021, and November 2020–April 2021, respectively), creating a total of 5 monthly annualized point estimates comparing baseline to intervention periods for a time period ranging from January 2020 to April 2021. These would constitute monthly annualized per patient cost-difference estimates for 5 monthly time points (December 2020, January 2021, February 2021, March 2021, and April 2021).
Figure 4:
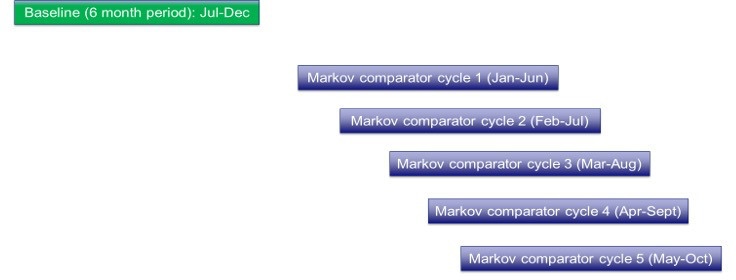
Monthly replication cycles for Comparator estimates.
SPC analysis
The final step in the prototype described here is fitting the monthly data points using SPC analysis. SPC is commonly used in health care to assess system performance and outcomes in real time and is derived from similar uses in manufacturing, aviation, and nuclear engineering.15 It is particularly well suited for the real-time analysis of variation and is often utilized in health care improvement due to its combination of statistical rigor and ease of visual interpretation. SPC can be very helpful in determining the statistical stability of point and overall performance estimates and identifying if longitudinal variation in performance is due to chance (common cause variation) or a nonrandom type I effect (special cause variation). This capability can help improvement initiatives like IBD Qorus determine if patient-reported ED utilization rates are stable (in statistical control) or are changing in response to an improvement intervention and can inform subsequent decision-making. If SPC approaches were to be similarly applied to monthly Markov point estimates, they could assess the variation of those point estimates longitudinally, detect nonrandom variations in the estimates, and determine the statistical stability of an overall mean cost-difference estimate for a specified time period.
The IBD Qorus QI reporting system utilizes standard SPC approaches for the assessment of time-ordered data, including XmR chart and XbarS chart for continuous data and p chart for proportions data.17 For example, Figure 2 shows p charts for the following: 1) a single IBD care center showing monthly patient-reported ED utilization rates over time (top display), 2) ED utilization rates by month for the Qorus collaborative as a whole (middle display), and 3) overall ED utilization rates for each center in the collaborative comparatively (bottom display). Each display includes a center line (overall mean, the green line in Figure 2) and control limits (shown in red) that are 3 Sigma deviations (~ 2.67 standard deviations) above and below the mean. Numerous probability-based detection rules can be applied, the most common of which include the following: 1) points that exceed the control limits, 2) shifts (≥ 8 points consecutively above or below the center line), and 3) trends (≥ 6 consecutively increasing or decreasing values) indicate nonrandom (special cause) variation.15,17
Standard SPC approaches could not be used for Markov-generated estimates; however, because doing so would violate a core assumption of these methods—independence of observations. Similar to individual Markov analyses, which assume a state of “memoryless-ness” or a lack of influence on current observations compared to previous or subsequent observations,8,9 standard SPC analyses also rely on an independence of observation between succeeding and preceding time points.17 For example, an ED utilization rate reported for the month of November is assumed to be relatively independent of that for December, and so on. The authors’ approach includes a replication procedure that calculates monthly annualized point estimates using data from successive partially overlapping time periods (see Supplemental Content 1), thus resulting in stepwise overlapping estimations and violating the independent observations assumption. For this reason, we chose an SPC approach that is amenable to these conditions and is commonly utilized in business financial forecasting—the moving average (MA).
The MA approach sequentially averages time-ordered values in a specified interval (usually in clusters of 3, 7, or 12 points). The MA3 approach averages 3 values observed over 3 consecutive time points into a single value that is plotted at the third time point. MA7 approaches, such as that commonly used in COVID-19 epidemiological monitoring, cluster 7 consecutive points together at each time point.17 MA approaches in SPC vary from this approach slightly in that all time-ordered observations are shown, even those which precede attainment of the full number of points needed for the specified cluster size. Until the full number of time-ordered observations is reached, the clustered averages of time points before that include only those values available. Finally, MA analyses do not assume independent observations, so cluster-based detection rules for special cause (nonrandom) variation, such as shifts and trends, do not apply. Only points outside of the control limits signal nonrandom variation.17
As shown in Supplemental Content 1, the first time-ordered (subgrouped) observation of 10 in January becomes the first value plotted in January (representing the only available subgroup) and the second time point in February is calculated as the average of the first 2 subgroups. Next, the first 3 time points (subgroups) are used to calculate the value for March. Continuing to the right, the 3–time point (subgroup) clustering moves one step to the right, calculating the average value plotted for April, and this stepwise 3-point cluster averaging then continues in a similar fashion throughout the full time period observed. Given that smaller point clustering (like the MA3) can allow for greater sensitivity to detect change and that larger point clustering can allow for better smoothing (resilience of overall trending to single point variations), we designed the option to select either MA3 or MA6 analyses to allow for 3 month or 6 month clustering (lesser or greater smoothing).
Visualization
Using a licensed Microsoft Power Business Intelligence visualization platform [Microsoft, 2021], we developed an interactive tool that allows the user to select the baseline and intervention time periods for analysis. The interface then draws upon a database of PRO data for IBD Qorus to acquire monthly ED utilization and hospitalization data for the time period selected, as well as monthly annualized cost-difference estimates calculated using the procedure previously described. These cost differences are shown monthly, listed in tabular form, visualized in a simple graph (time plot), and visualized in a MA SPC analysis. The user can set the SPC analysis to visualize monthly value clustering at the 3-month (ie, MA3) or 6-month (ie, MA6) levels.
Results
The authors present this IBD Qorus Markov–SPC prototype incorporating an extended time frame (2018–May 2021) to demonstrate a longitudinal analysis using a large dataset for a selected time period. We selected a 6-month baseline period ending in July 2018 (inclusive of the months of January–June 2018) and an intervention period beginning in July 2018 and ending in May 2021. This placed the end of the first observed 6-month intervention period post baseline in January 2019—6 months after the close of the baseline period in July 2018. Successive monthly iterations were then conducted to calculate monthly annualized cost-difference estimates for February 2019–May 2021.
The interactive Power Business Intelligence tool is shown in Supplemental Content 2. In the center table, the Markov-generated average monthly annualized cost estimate for the 6-month fixed baseline time period ending July 2018 (highlighted in aqua) is shown ($17,994.29). This cost is compared to 6-month stepwise annualized estimates replicated monthly beginning with the 6-month interval ending in January 2019 (July 2018–January 2019) and continuing monthly in a stepwise progression for February 2019 (August 2018–February 2019) onward until May 2021 (highlighted in blue). To the right of these 2 columns is the cost difference calculation (baseline – intervention) between the annualized Markov estimates for the baseline vs intervention states by month. For January 2019, the estimated cost difference is a savings of $2346 per person with IBD for the intervention time period vs baseline, a savings of $1978 per person with IBD for February 2019, and so on. Note that for the 6-month period ending in June–September 2019 the site had greater costs associated with the intervention time period vs baseline. The graph at the bottom of the visual shows a time plot of monthly cost differences, with the zero (break-even) point added as a horizontal dotted line. The average annualized estimated cost difference for the entire time period is a savings of $1473 per person with IBD.
Figure 5 provides MA3 SPC analysis visualizations for the same data, baseline, and intervention period. The upper display shows a MA3 SPC analysis for a selected IBD care center and the bottom display shows a similar analysis for all IBD Qorus care centers combined. The first time point for the SPC analyses starts at the end of the first 6-month intervention period post baseline (ending in January 2019) and progresses monthly until the end of the intervention period in May 2021. The green center line is the overall average annualized estimated cost difference for the whole time period, the red dotted lines are the control limits, and the monthly annualized point cost-difference estimates are shown in blue. Note that following the MA3 SPC method, the first 2 monthly values plotted on the MA3 SPC charts are derived from the first and the averaged first and second monthly estimates, respectively, and have associated wider control limits. Starting with the third month (March 2019), 3 consecutive monthly estimates are used to calculate the point estimate for that month (January–March 2019), and thereafter this 3-point clustering is maintained, moving forward monthly in a stepwise fashion following MA3 clustering principles as previously discussed.
Figure 5:
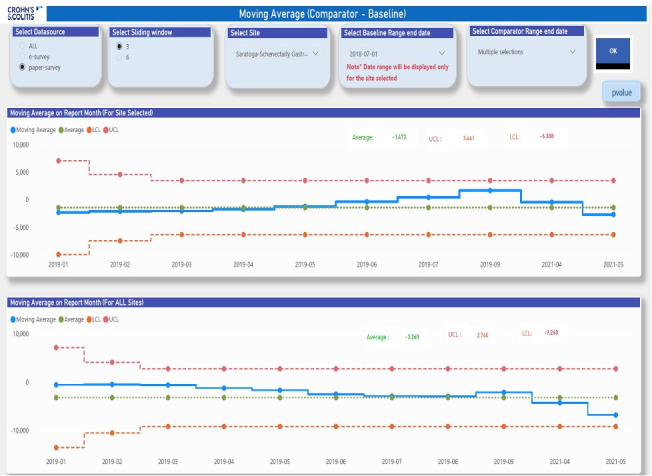
Sample MA3 SPC analysis visualization. MA3 = moving average over 3 consecutive time points; SPC = statistical process control; LCL = Lower Control Limit; UCL = Upper Control Limit. From IBD Qorus All Sites Call webinar, July 2021. Reproduced with permission from Crohn’s & Colitis Foundation.
The SPC analysis provides additional information beyond the descriptive analysis shown in Supplemental Content 2. First, we note that the average annualized estimated cost savings for the selected site were $1473 per person with IBD (top display) is roughly half that of the collaborative overall (savings of $3260 per person with IBD). Additionally, by applying SPC detection rules we can observe that there is a random variation pattern present at the site and collaborative levels (no points are outside of the control limits).15,17 This establishes at both levels of aggregation (IBD care center and Qorus collaborative overall) that the average estimated annualized cost differences per person with IBD of $1473 and $3260, respectively, are in statistical control. They are statistically stable (reliable) estimates of cost differences between the fixed baseline period (January–June 2018) and the intervention period (July 2018–May 2021), accounting for changes in observed monthly patient-reported ED utilization and hospitalization rates (probability estimates) during that time period. Finally, the 3-month trend of increased costs for the IBD care center observed from June to September 2019 was not statistically significant (nonrandom variation) from the overall mean of $1473 when analyzed using SPC, that is, the cost increases were random variations rather than a true “increased cost” signal.
Discussion
The prototype presented here represents the first foray for IBD Qorus into real-time cost difference and cost-estimation measurement as part of its improvement and value measurement strategy.3 The authors have developed a prototype Markov–SPC analysis method for IBD Qorus to estimate annualized cost differences between a selected fixed 6-month baseline time period and a specified comparison (intervention) time period. The authors have adapted initial work by Almario et al,6 using standard Markov techniques and SPC techniques to develop an analytic approach for assessing cost differences between baseline and intervention using monthly PRO data for ED utilization and hospitalizations. This approach is the first the authors are aware of in IBD but is not the first hybrid Markov–SPC approach. Markov–SPC applications have been attempted previously but have been largely focused on advanced theoretical and methodological explorations and not practical applications.18 In comparison, the authors’ approach is practical in that it uses a combination of more commonly used and widely understood SPC and Markov modeling methods.
Limitations
The authors’ approach has 3 major limitations. The first and foremost limitation is that this prototype has not yet been validated against a “gold standard,” such as a claims data analysis in a similar population and time period as that in which the original Markov study by Almario et al and the development of this prototype was conducted. If it can be established in a similar population and time frame that ED- and hospitalization-related cost-difference estimates are similar between this prototype and claims analysis, it would provide an initial validation of the approach. Or if the estimates from the 2 approaches differ, the claims data analysis could provide insights into how to appropriately adjust this prototype to make it more accurate. Recognizing this limitation, the Crohn’s and Colitis Foundation is currently conducting a claims data analysis to validate this prototype.
The second limitation is the issue of independent observations. As previously discussed at multiple points, Markov analysis and standard SPC analyses assume independence of observations. Although the issue of independence is resolved in the SPC aspect through use of a MA approach, it does not mitigate that issue in the Markov component. The authors have assumed in this approach that each monthly iteration assumes independence from the others; however, there is overlap in the data being used for these iterations. As part of future development, testing for inter-analysis correlations may be helpful to determine if independence of observations is threatened and, if so, to determine how to appropriately adjust for this.
The final limitation is related to PRO data. Although there is evidence for the reliability of IBD Qorus PRO data,16 the use of this approach requires the acceptance of recall error limitations when self-reporting events. The use of PRO data may also challenge the “memoryless” assumption of Markov modeling and the independence of observations assumption previously discussed, that is, this approach cannot control absolutely against confounding factors and cannot guarantee mutual independence of all items being assessed. The authors have assumed in this work to date that the variation in this error will be evenly distributed over time and be relatively constant. In further development and validation of this prototype, this aspect should also be evaluated. This method could allow for real-time cost-difference analysis to determine if there is a cost savings resulting from engaging in improvement work as part of a QI collaborative.
Conclusion
Historically, health care QI efforts have struggled to find financial outcomes compared to articulating process or clinical outcomes, and especially with demonstrating return on investment or cost differences in near real time and at the pace of ongoing improvement work that incorporates real-world data. This work aims to better address this gap and introduces an approach that could do this using PROs. The authors’ prototype approach will strengthen the measurement capability of the IBD Qorus LHS by providing a necessary complement to the current use of clinical indicators as a surrogate to assess cost and utilization.2 The hybrid SPC-Markov nature of this approach allows not only for flexible and adaptive “iterative fitting” of Markov-generated annualized cost-difference estimates over time, but also introduces an approach for the real-time SPC analysis of the variation in monthly point estimates over time and the assessment of statistical stability of overall average cost-difference estimations.
The implications are substantial. Flexible Markov-based estimations of cost differences can be observed over time, visualized, and statistically analyzed in real time to provide reliable estimates that can inform intelligent action for improvement science, organizational strategic planning, accountability, and even for hypothesis generation for formalized research. More specifically, this gives clinical practices the ability to more readily demonstrate that they are generating high value, high quality IBD care. This demonstration can influence strategic planning, resource management, or process improvements and can potentially offer a distinction of excellence in care center marketing or negotiating with payer groups. Validation of this prototype against claims data analyses is a critical next step4 in the development of this promising approach prior to routine application in IBD practice and has begun as evidenced by the early work of Scott et al.19 Although initial development of this work was central to the population with IBD, it can be applied beyond a single disease state and beyond other complex chronic disease states. Evidence that building a culture of QI will not increase longitudinal costs and can even be a cost reduction approach can help build the case for QI in primary care as well as in specialized clinical care contexts and health systems. Especially now in the post-pandemic era, when health systems are strained and financial resources constrained, this approach could be timely, valuable, and meaningful in both research and real-world practice applications.
Financial Disclosures (continued)
Funding (continued): IBD Qorus™ is made possible in part by the support of AbbVie, AMAG Pharmaceuticals, Eli Lilly, Helmsley Charitable Trust, Janssen Biotech, Inc., Luitpold Pharmaceuticals, Inc., Nephroceuticals LLC, Nestle Health Sciences, Pfizer, Inc., Takeda Pharmaceuticals USA, Inc., and UCB/Ferring. Supporters had no involvement in the design or conduct of the study, collection, management, analysis or interpretation of the data, preparation, review, or approval of the manuscript, or in the decision to submit the manuscript for publication. Supporters did not provide direct funding to investigators for any aspect of this study.
CAS is a consultant for Abbvie, BMS, Lilly, Janssen, Napo Pharmaceuticals, Pfizer, Prometheus, Takeda, and Tellus Health, speaker for continuing medical education activities for Abbvie, Janssen, Pfizer, and Takeda and has received grant support from Abbvie, Janssen, Pfizer, and Takeda. CS and LS are co-founders of MiTest Health, LLC (software company), and a technology developed by MiTest Health, LLC, has been licensed to Takeda. JT, SAW, and RO are employees of the Crohn’s & Colitis Foundation. BJO has received funding support from the Crohn’s & Colitis Foundation for research and improvement work, including work leading the development of the prototype discussed in this manuscript, and conducted in the role of Improvement Advisor and Scientist for the IBD Qorus Learning Health System. He has also received research funding support from Biogen and EMD Serono for investigator-initiated improvement science and learning health system-oriented population health improvement research in multiple sclerosis. GYM is a consultant for Abbvie, Arena, Boehringer-Ingelheim, Bristol Myers-Squibb, Entasis, Janssen, Medtronic, Pfizer, Samsung Bioepis, Takeda, and Techlab and has received research funding from Pfizer.
Ethics Approval
This work has been determined to be Not Human Subjects Research by Dartmouth College Committee for the Protection of Human Subjects (IRB).
Supplementary Material
online supplementary file 1
online supplementary file 2
Acknowledgments
The authors thank Shishir Basant, analytic programmer, for critical technical, coding, and programming contributions to this work and Bruce Jobse, MPH, for assistance with final formatting and submission.
Footnotes
Author Contributions: BJO led the development of the Markov–SPC prototype and manuscript development. He participated in all aspects of manuscript development, review, and revision. GYM participated in oversight of the IBD Qorus program and in reviews and revisions of the manuscript. CA developed the initial Markov model and participated in its adaptation for SPC modeling and reviews of the manuscript. AK, RO, and SAW participated greatly as part of a team developing the IBD Qorus QI reporting system that provided the underlying capability for the Markov-informed SPC prototype and participated in reviews of the manuscript. JT participated in the project development work for creation of the Markov-informed SPC prototype and in reviews of the manuscript.
Funding: IBD Qorus is an initiative of the Crohn’s & Colitis Foundation. Financial disclosures continued on last page.
Data-Sharing Statement: Data are available upon request. Readers may contact the corresponding author to request underlying data.
References
- 1. Nelson EC, Dixon-Woods M, Batalden PB, et al. Patient focused registries can improve health, care, and science. BMJ. 2016;354. 10.1136/bmj.i3319 [DOI] [PMC free article] [PubMed] [Google Scholar]
- 2. Melmed GY, Siegel CA. Quality improvement in inflammatory bowel disease. Gastroenterol Hepatol. 2013;9(5):286–292. [PMC free article] [PubMed] [Google Scholar]
- 3. Oliver BJ, Kennedy AM, van Deen WK, et al. Development of balanced whole system value measures for inflammatory bowel disease care in the IBD Qorus Collaborative using a modified Delphi process. Inflamm Bowel Dis. 2021;28(3):327–336. 10.1093/ibd/izab091 [DOI] [PubMed] [Google Scholar]
- 4. Improving health care, Part 1: The Clinical Value Compass. Jt Comm J Qual Improv. 1996;22(4):243–258. 10.1016/S1070-3241(16)30228-0 [DOI] [PubMed] [Google Scholar]
- 5. The Breakthrough Series: IHI’s collaborative model for achieving breakthrough improvement | IHI - Institute for Healthcare Improvement. Accessed 23 June 2021. http://www.ihi.org:80/resources/Pages/IHIWhitePapers/TheBreakthroughSeriesIHIsCollaborativeModelforAchievingBreakthroughImprovement.aspx
- 6. Almario CV, Kogan L, van Deen WK, et al. Health economic impact of a multicenter quality-of-care initiative for reducing unplanned healthcare utilization among patients with inflammatory bowel disease. Am J Gastroenterol. 2021;116(12):2459–2464. 10.14309/ajg.0000000000001540 [DOI] [PubMed] [Google Scholar]
- 7. Melmed GY, Oliver B, Hou JK, et al. Quality of care program reduces unplanned health care utilization in patients with inflammatory bowel disease. Am J Gastroenterol. 2021;116(12):2410–2418. 10.14309/ajg.0000000000001547 [DOI] [PubMed] [Google Scholar]
- 8. Komorowski M, Raffa J. Markov models and cost effectiveness analysis: Applications in medical research. In: Secondary Analysis of Electronic Health Records ; 2016:351–367. 10.1007/978-3-319-43742-2_24 [DOI] [PubMed] [Google Scholar]
- 9. Sonnenberg FA, Beck JR. Markov models in medical decision making: A practical guide. Med Decis Making. 1993;13(4):322–338. 10.1177/0272989X9301300409 [DOI] [PubMed] [Google Scholar]
- 10. Schaefer AJ, Bailey MD, Shechter SM, Roberts MS. Modeling medical treatment using Markov decision processes. In: Brandeau ML, Sainfort F, Pierskalla WP, eds. Operations Research and Health Care. Springer. US:593–612. 10.1007/1-4020-8066-2_23 [DOI] [Google Scholar]
- 11. Sutton RS, Barto AG. Reinforcement learning: An introduction. In: A Bradford Book. The MIT Press; 1998. [Google Scholar]
- 12. Weinstein JN, Lurie JD, Tosteson TD, et al. Surgical versus nonsurgical treatment for lumbar degenerative spondylolisthesis. N Engl J Med. 2007;356(22):2257–2270. 10.1056/NEJMoa070302 [DOI] [PMC free article] [PubMed] [Google Scholar]
- 13. Bureau of Labor Statistics. Accessed 6 December 2020. http://www.bls.gov/data/inflation_calculator.htm
- 14. Kappelman MD, Rifas-Shiman SL, Porter CQ, et al. Direct health care costs of Crohn’s disease and ulcerative colitis in US children and adults. Gastroenterology. 2008;135(6):1907–1913. 10.1053/j.gastro.2008.09.012 [DOI] [PMC free article] [PubMed] [Google Scholar]
- 15. Benneyan JC, Lloyd RC, Plsek PE. Statistical process control as a tool for research and healthcare improvement. Qual Saf Health Care. 2003;12(6):458–464. 10.1136/qhc.12.6.458 [DOI] [PMC free article] [PubMed] [Google Scholar]
- 16. van Deen WK, Kwon MH, Blissett G, et al. P014 Validating patient reported utilization in the IBD Qorus learning health system. Gastroenterology. 2019;156(3):S11–S12. 10.1053/j.gastro.2019.01.061 [DOI] [Google Scholar]
- 17. Provost LP, Murray SK. The Health Care Data Guide: Learning from Data for Improvement. Josey-Bass. ISBN-10: 0470902582; 2011. [Google Scholar]
- 18. CDC . CDC COVID-19 Tracker. Accessed 28 November 2021. https://covid.cdc.gov/covid-data-tracker/#datatracker-home
- 19. Scott FI, Testaverde J, Almario CV, et al. A quality-of-care initiative to improve urgent care access in ambulatory clinics is associated with reduced inpatient costs in inflammatory bowel disease: Results from the IBD Qorus urgent care improvement initiative. Gastroenterology. 2024;166(5):S-125–S-126. 10.1016/S0016-5085(24)00778-9 [DOI] [Google Scholar]
Associated Data
This section collects any data citations, data availability statements, or supplementary materials included in this article.
Supplementary Materials
online supplementary file 1
online supplementary file 2