

Abstract
Background
Ovarian cancer (OV) is a heterogeneous disease but has traditionally been treated as an immunologically cold malignancy. The relationship between the immune-active cancer phenotype typified by a T helper 1 (Th-1) immune response and clinical outcome in OV remains uncertain.
Methods
A cohort-scale compendium of transcriptomic data from 2850 OV samples from 19 individual datasets was compiled for integrative immuno-transcriptomic analysis. The immunological constant of rejection was used as a metric to assess the Th-1/cytotoxic response orientation and investigate the clinical-biological significance of immune polarization towards a Th-1 immune response. Single-cell RNA sequencing data from 39 OV samples were analyzed to elucidate the variability of the immune microenvironment, and immunohistochemical validation was performed on 39 samples from the Harbin Medical University Cancer Hospital.
Results
Our results demonstrated the prognostic significance of a Th-1/cytotoxic immune profile within the tumor microenvironment (TME) using the immunological constant of rejection classification to OV samples. Specifically, patients with tumors expressing high levels of ICR markers showed significantly improved survival. A gene panel consisting of four chemokines (CXCL9, CXCL10, CXCL11 and CXCL13) was identified as critical players in mediating the establishment of an active T-cell-inflamed antitumor phenotype. This 4-chemokine signature, which was extensively validated in external multicenter cohorts through transcriptomic profiling and in an independent in-house cohort through immunohistochemistry, introduced a novel immune classification in OV and identified a chemokine-dominated subtype associated with an active antitumor immune phenotype and favorable prognosis. Single-cell transcriptomic analysis revealed that chemokine-dominated tumors increase CXCR3 + NK and T cell recruitment to the TME primarily through the overexpression of macrophage-derived CXCL9/10/11.
Conclusions
This study provides new insights into understanding immune heterogeneity within the TME and paves the way for tailoring appropriate therapeutic interventions for patients with differing immune profiles.
Subject terms: Predictive medicine, Tumour biomarkers
Background
Ovarian cancer (OV) is one of the most common and lethal malignancies in gynecology, with the highest mortality rate in the genital tract [1]. The World Health Organization estimates that new cases of OV will increase by more than 55% to 503,448 and deaths by almost 70% to 350,956 worldwide between 2022 and 2050. Despite advances in surgical and chemotherapeutic strategies, the five-year survival rate for advanced-stage OV patients remains suboptimal due to often late diagnosis and complex tumor biology, highlighting the urgent need for novel diagnostic and prognostic markers as well as therapeutic targets [2, 3].
OV has traditionally been treated as a homogenous disease, but increasing knowledge of molecular biology has revealed a high degree of heterogeneity between and within tumors. Molecular, cellular and anatomical heterogeneity have greatly influenced clinical outcomes and responses to surgery and/or systemic therapy [4]. Therefore, molecular subtyping has emerged as a critical way to stratify patients based on tumor biology, allowing for more tailored treatment decisions and prognostic assessments [5–9]. Immunological subtyping based on the tumor immune microenvironment (TIME) has been proposed as a valuable framework for assessing prognosis and therapeutic efficacy [10–12]. Contrary to the traditional view of OV as an immunologically “cold” cancer, recent studies have suggested that TME and the immune system play a pivotal role in the development and progression of OV and can significantly influence disease outcome and response to therapy [13, 14]. Accumulating evidence suggests that both the composition and functional orientation of tumor-infiltrating immune cells are critical to prognosis and treatment response [15–17]. However, previous efforts in OV have primarily focused on the identification of specific immune cell types, overlooking the impact of their functional orientation on the cytotoxic response.
In this study, we aimed to investigate the clinical-biological value of the immune orientation towards a cytotoxic response and to identify the critical molecular drivers in the establishment of an active T-cell-inflamed antitumor phenotype through comprehensive and integrated bulk and single-cell transcriptome analyses in the large dataset of nearly 3000 OV patients.
Methods
Ovarian cancer cohorts and tumor samples
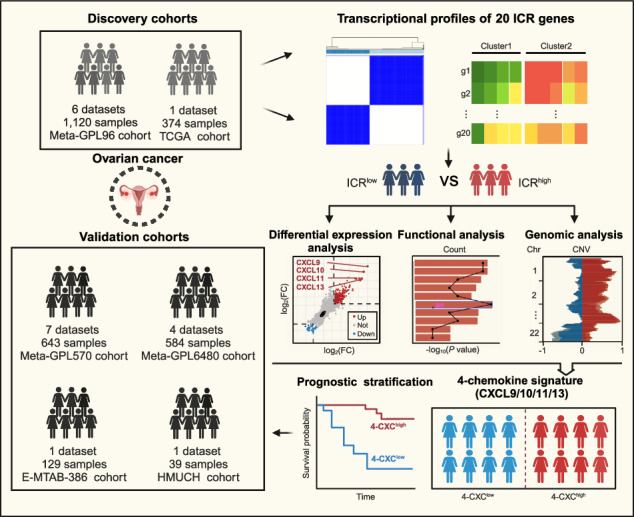
Tumor tissue samples from 39 patients with high-grade serous ovarian cancer who underwent surgery between 2015 and 2016 were obtained from the Harbin Medical University Cancer Hospital (referred to as the HMUCH cohort). All patients were followed up until November 2021. The study was conducted in accordance with the Declaration of Helsinki and approved by the Ethics Committee of Harbin Medical University Cancer Hospital (KY2021-45). Informed consent was waived for patients due to the retrospective nature of the study. We pooled them with 19 public OV datasets, including both gene expression profiles generated by DNA microarrays and RNA-seq and clinicopathological information from the Gene Expression Omnibus (GEO), The Cancer Genome Atlas (TCGA) and ArrayExpress data repositories (Supplementary Table 1). Finally, 2850 OV samples from 19 datasets were incorporated into the present study.
All 2850 OV samples enrolled in this study were pooled into five larger patient cohorts based on their respective technology platforms to mitigate the effects of small sample bias. These cohorts included the Meta-GPL96 cohort (1120 samples from 6 datasets), Meta-GPL6480 cohort (584 samples from 4 datasets), Meta-GPL570 cohort (643 samples from 7 datasets), TCGA cohort (374 samples) and E-MTAB-386 cohort (129 samples). The Meta-GPL96 and TCGA cohorts served as the primary discovery cohorts, while the remaining meta-cohorts and the HMUCH cohort were used as validation cohorts.
Bulk transcriptome analyses
Clinical and transcriptome data of ovarian tumors were retrieved from the GEO, TCGA and ArrayExpress data repositories. Raw microarray data from the GPL96 and GPL570 platforms were subjected to background correction, quantile normalization, and log2 transformation using the Robust Multichip Average algorithm [18]. Processed transcriptome data from alternative platforms were obtained directly from publicly accessible databases and literature. In cases where multiple probes were mapped to the same gene, the microarray probe set with the highest expression was chosen to represent the gene expression value [19]. Batch correction was conducted using the ComBat function from the R package “SVA” to account for variability between different datasets. Copy number variation (CNV) data for TCGA samples were obtained using the GDCquery function from the R package ‘TCGAbiolinks’, which accesses the GDC Data Portal (https://portal.gdc.cancer.gov/) [20]. Differential expression analysis was performed using the R package ‘limma’, and significantly differentially expressed genes (DEGs) were identified based on the criteria of |logFC | > 0.585 and a P-value < 0.05.
Subtyping classification
Subtyping classification was conducted by consensus clustering analysis using the R package ‘ConsensusClusterPlus’ (version 1.64.0) with the following parameters: 5000 replicates, a maximum of five clusters, and agglomerative hierarchical clustering with Ward criterion (Ward.D2) inner and complete outer linkage. The optimal number of clusters for sample segregation based on the ICR signature was determined using the Calinski-Harabasz criterion [21].
Enrichment analysis
To define the functional roles of specific gene sets, gene-set enrichment analysis (GSEA) of biological process (BP) and molecular function (MF) of gene ontology (GO) was performed using the ‘GSEA‘ function of the “clusterProfiler” package (version 1.64.0) [22].
Estimation of TME immune infiltration
The infiltration of different immune cells in the TME was estimated and quantified using four commonly used computational methods, namely TIMER [23], MCPcounter [24], single-sample gene-set enrichment analysis (ssGSEA) [25], and EPIC [26].
Single-cell RNA sequencing analysis
Single-cell RNA sequencing (scRNA-seq) data were derived from Zheng’s study [27], involving 223,363 single cells from 39 OV specimens. ScRNA-seq analysis was performed using the R package Seurat (version 4.0) with default parameters unless otherwise stated. Low-quality cells, defined as having fewer than 200 or greater than 10% unique molecular identifiers (UMIs) associated with mitochondrial genes, were excluded from the analysis. Additionally, 2010 platelets with high expression of pro-platelet basic protein were identified and removed. Dimensionality reduction and visualization were performed using Uniform Manifold Approximation and Projection (UMAP), with the principal components used for embedding being consistent with those used for clustering. Batch effect correction and integration were performed using Harmony (version 1.0) with default settings. All small clustering groups with dual-lineage signatures, such as EPCAM-PECAM1-CD3D, EPCAM-CD79A, PECAM1-CD79A, and CD79A-CD3D, were excluded from further analysis. Cell-cell communication analysis was performed using the iTALK [28] to examine interactions between receptors and four chemokine ligands.
Immunohistochemistry (IHC)
Paraffin-embedded tumor tissues from 39 OV patients at the Harbin Medical University Cancer Hospital were collected for immunohistochemical staining. In brief, 4 µm formalin-fixed paraffin-embedded (FFPE) sections were stained with primary antibodies of CXCL9/MIG (1:400; Bioss Antibodies, Cat# bs-2551R; spleen as positive control), CXCL10/IP10 (1:400, Bioss Antibodies, Cat# bs-1502R; appendix and tonsil as positive control), CXCL11 (1:200; Affinity Biosciences, Cat# DF9917; appendix and tonsil as positive control) and CXCL13 (1:500; Bioss Antibodies, Cat# bs-2553R; appendix and tonsil as positive control). All slides were scanned at 10× magnification and analyzed using QuPath digital image analysis software (version 0.4.4) [29]. Intensity was categorized as 1 (weakly positive), 2 (moderately positive) and 3 (strongly positive). The H-score was calculated to quantify protein expression in IHC using the formula: H-score = % of weak staining * 1 + % of moderate staining * 2 + % of strong staining * 3 [30, 31].
Statistical analysis
Statistical analyses were conducted using R software (version 4.2.2) and related R packages. For comparisons of continuous variables between two groups, the unpaired Student t-test was used for normally distributed variables, and the Wilcoxon rank-sum test for non-normally distributed variables. The Kaplan-Meier method was used to estimate recurrence-free survival (RFS) and overall survival (OS), and the log-rank test was used to determine statistical significance. Univariate and multivariate Cox proportional hazards regression models were used to assess prognostic significance, and hazard ratios (HRs) and corresponding 95% confidence intervals (CIs) were calculated. P < 0.05 was considered statistically significant, and P values were two-tailed unless otherwise stated.
Results
The immunologic constant of rejection is a prognostic factor in ovarian cancer
The immunologic constant of rejection (ICR) was used as a measure of Th-1/cytotoxic response orientation to stratify 1120 ovarian cancer samples from the Meta-GPL96 cohort into ICRhigh and ICRlow groups using consensus clustering based on 20 ICR marker genes (Fig. 1a and 1b). Kaplan-Meier analysis showed a significantly improved OS in the ICRhigh group compared to the ICRlow group (Fig. 1c). In univariate analysis, the HR comparing the ICRhigh group with the ICRlow group for OS was 0.73 (95% CI = 0.60–0.89; P = 0.002) (Fig. 1d). In multivariate analysis after adjustment for age, grade and debulking, ICR classification remained significantly associated with OS, with an HR of 0.67 (95% CI = 0.51–0.89; P = 0.005) for the ICRhigh versus ICRlow group (Fig. 1d), indicating the independent prognostic value of ICR classification. To validate the association between ICR-based classification and survival prognosis, we conducted ICR classification in the TCGA cohort (Fig. 1e and 1f). Consistent with the findings in the Meta-GPL96 cohort, we observed that the ICR signature served as an independent prognostic factor, classifying patients in the TCGA cohort into ICRhigh and ICRlow groups with favorable or unfavorable outcomes (Fig. 1g and 1h). These findings highlight the correlation between immune responsiveness towards cytotoxic activity and patient survival.
Fig. 1. Association of ICR-based immunological classification with clinical outcomes.

a Unsupervised consensus clustering analysis of OV patients in the Meta-GPL96 cohort (n = 1120) based on the expression of 20 ICR marker genes. b Consensus-clustered heatmap illustrating the expression pattern of ICR genes, coupled with a bar plot illustrating the significant differences in the Meta-GPL96 cohort. c Kaplan-Meier survival curves for overall survival according to the ICR-based immunological classification in the Meta-GPL96 cohort. d Forest plot of univariate and multivariate Cox proportional hazards regression analysis in the Meta-GPL96 cohort. e Unsupervised consensus clustering analysis of OV patients in the TCGA cohort (n = 374) based on the expression of 20 ICR marker genes. f Consensus-clustered heatmap illustrating the expression pattern of ICR genes, coupled with a bar plot illustrating the significant differences in the TCGA cohort. g Kaplan‐Meier survival curves for overall survival according to the ICR-based immunological classification in the TCGA cohort. h Forest plot of univariate and multivariate Cox proportional hazards regression analysis in the TCGA cohort. Significant differences were assessed using the Wilcoxon rank-sum test (*p < 0.05; **p < 0.01; ***p < 0.005).
Chemokine enrichment is a specific molecular feature for defining the Th-1/cytotoxic phenotype
To elucidate the molecular mechanisms and functional differences of the Th-1/cytotoxic phenotype, we performed a comparative transcriptomic analysis between the ICRhigh and ICRlow groups in both the Meta-GPL96 and TCGA cohorts and identified 510 significantly up-regulated DEGs, of which 261 DEGs were up-regulated in the ICRhigh group in the Meta-GPL96 cohort and 458 DEGs were up-regulated in the ICRhigh group in the TCGA cohort (Fig. 2a). Pathway enrichment analysis revealed that the 458 DEGs were associated with chemokine/cytokine and major histocompatibility complex (MHC) class II pathways (Fig. 2b). GESA based on the gene expression profile for GO-BP and GO-MF also demonstrated significant enrichment of chemokine-related pathways and functions in the ICRhigh group compared to the ICRlow group (Fig. 2c). These findings were further confirmed in the Meta-GPL96 cohort (Supplementary Fig. S1). Specifically, four chemokines (CXCL9, CXCL10, CXCL11 and CXCL13) showed the most significant differential expression between the ICRhigh and ICRlow groups in the Meta-GPL96 and TCGA cohorts.
Fig. 2. Genomic and transcriptomic characterization of ICR-based immunological classification.

a Scatter plot depicting the overlap of genes with the significant change between the ICRhigh and ICRlow groups in the Meta-GPL96 and TCGA cohorts. Genes highlighted in red show increased expression in the ICRhigh group in both cohorts, while those highlighted in blue demonstrate down-regulation in the ICRlow group within both cohorts. Venn diagram representing the overlap of significantly up-regulated genes in two cohorts. b Barplot showing GO-MF enrichment analysis of up-regulated expression genes in the ICRhigh group in the TCGA cohort. c GSEA plots of chemokine-related gene sets of GO-BP (left) and GO-MF (right) in the ICRhigh group compared with the ICRlow group in the TCGA cohort. Pathways with |NES | > 1, p < 0.05 and padj < 0.05 were selected. d Boxplot showing mRNA expression levels of GZMA and CD8A between two ICR groups in the TCGA cohort. e Visual representation of the statistically enriched chromosome locus and CNV pattern for differentially expressed genes between ICRhigh and ICRlow groups in the TCGA cohort. Wilcoxon rank sum test was performed to compare the difference. GSEA gene set enrichment analysis, CNV copy number variation. BP biological process. MF molecular function.
We also investigated the expression patterns of GZMA and CD8A genes, which are known to be associated with reduced deletion of genes encoding CXC chemokines [14], and observed a significant upregulation of both GZMA and CD8A in the ICRhigh group compared to the ICRlow group (Wilcoxon rank-sum test, P < 0.001) (Fig. 2d). Additionally, cytoband enrichment and CNV analysis revealed a higher occurrence of copy number loss in the four chemokines (CXCL9, CXCL10, CXCL11 and CXCL13) within the ICRlow group compared to the ICRhigh group (Fig. 2e). These findings suggest that the categorization of ICR in OV may involve the recruitment of immune effector cells via chemokines, thereby modulating the tumor microenvironment and potentially leading to a more favorable immunological prognosis.
Identification of a 4-chemokine dominant subtype associated with improved survival
Unsupervised hierarchical clustering of the four identified chemokines (CXCL9, CXCL10, CXCL11 and CXCL13) in the Meta-GPL96 and TCGA cohorts revealed a significant co-expression correlation, resulting in the formation of a 4-chemokine signature. The 4-chemokine signature stratified patients into two subgroups: 4-CXChigh and 4-CXClow in the Meta-GPL96 cohort (Fig. 3a). The 4-CXChigh group revealed a clear survival benefit of high four chemokines expression and had longer OS (HR = 0.72, 95% CI = 0.59–0.87, P < 0.001) and RFS (HR = 0.76, 95% CI = 0.59–0.98, P = 0.034) compared to the 4-CXClow group with low expression of four chemokines (Fig. 3b and Supplementary Fig. S2a). Multivariate Cox regression analyses confirmed that the 4-CXC signature served as an independent prognostic factor even after adjusting for clinical variables (age, grade and debulking) (HR = 0.71, 95% CI = 0.54–0.93, P = 0.014 for OS and HR = 0.78, 95% CI = 0.59–1.03, P = 0.083 for RFS) (Fig. 3c and Supplementary Fig. S2a). Similar results were observed in the TCGA cohort (Fig. 3d and 3e). We identified a subset of patients with a higher co-expression pattern of the 4-CXC chemokine signature and favorable prognosis (HR = 0.52, 95% CI = 0.37–0.75, P < 0.001 for OS and HR = 0.60, 95% CI = 0.43–0.85, P = 0.004 for RFS) (Fig. 3f and Supplementary Fig. S2b). The prognostic significance of the 4-CXC signature was maintained in multivariate analysis with an HR of 0.53 (95% CI = 0.36–0.78, P = 0.001) for OS and HR of 0.56 (95% CI = 0.38–0.83, P = 0.004) for RFS (Fig. 3f and Supplementary Fig. S2b).
Fig. 3. Identification of a novel 4-chemokine-dominant molecular subtype.

a Heatmap of unsupervised hierarchical clustering of four chemokines expression in the Meta-GPL96 cohort. b Kaplan‐Meier survival curves for overall survival and recurrence-free survival between 4-chemokines-based subtypes in the Meta-GPL96 cohort. c Forest plot of univariate and multivariate Cox proportional hazards regression analysis in the Meta-GPL96 cohort. d Heatmap of unsupervised hierarchical clustering of four chemokines expression in the TCGA cohort. e Kaplan‐Meier survival curves for overall survival and recurrence-free survival between 4-chemokines-based subtypes in the TCGA cohort. f Forest plot of univariate and multivariate Cox proportional hazards regression analysis in the TCGA cohort.
scRNA-seq reveals distinct immune microenvironments between chemokine-based subtypes
ScRNA-seq analysis was performed on 223,363 single cells from 39 ovarian cancer samples to investigate the diversity of chemokine gene expression at the single-cell level. This analysis revealed the presence of 14 different cell types, including B cells, CD4 + T cells, CD8 + T cells, NK cells, monocytes, macrophages, dendritic cells (DC), fibroblasts, mesothelial cells, myo-CAF (mCAF), epithelial cells, hematopoietic stem cells (HSC), proliferative cells, and endothelial cells (Fig. 4a). The expression patterns of the four chemokines CXCL9, CXCL10, CXCL11, and CXCL13 varied among these cell types, with CXCL9, CXCL10, and CXCL11 being predominantly expressed in macrophages as opposed to other cell types, and CXCL13 being predominantly expressed in CD8+ and CD4 + T cells (Fig. 4b and 4c). We used iTALK to examine the intercellular interactions mediated by four chemokine receptor-ligand pairs to explore the intricate communication network between immune cells modulated by chemokines. Our results showed that macrophages secrete CXCL9/10/11, effectively recruiting CXCR3 + NK and T cells into the TME (Fig. 4d).
Fig. 4. Expression of the 4-chemokine panel was associated with an active immune phenotype revealed by scRNA-Seq analysis.

a UMAP visualization plot showing 172,664 cells from 39 OV patients, colored by clusters. b, c Heatmap showing expression levels of four chemokines in different cell types. d Circos plots showing interactions of putative chemokines CXCL9/10/11/13 and their corresponding receptors between different cell types. e The immune cell scores inferred by four immune infiltration analysis methods in four cohorts. Significant statistical differences were assessed using t-test. The size of the dot represents the significance of the p-value. Red (or blue) represents the cell type was enriched in 4-CXChigh (or 4-CXClow).
We performed a comprehensive analysis of infiltrating immune cells in the tumor microenvironment using four different methods to examine immune infiltration based on bulk RNA-seq data. The results consistently showed a higher abundance of infiltrating immune cells in the 4-CXChigh subtype compared to the 4-CXClow subtype (Fig. 4e). These findings from both scRNA-seq and bulk RNA-seq data suggest that ovarian cancer patients characterized by the 4-CXChigh subtype have a propensity for attracting immune cells through the secretion of chemokines, which in turn maintains an immunologically dynamic antitumor microenvironment and consequently improves patient survival.
External multi-cohort validation of the 4-chemokine signature
To validate the presence and prognostic value of the 4-chemokine dominant subtype, originally identified in two discovery cohorts (the Meta-GPL96 cohort and the TCGA cohort), an external validation study was conducted on 1356 patients from 12 different datasets. To mitigate the potential impact of small sample sizes, all 12 independent datasets were pooled into three larger validation cohorts with uniform technological platforms. We then performed an unsupervised clustering analysis using the expression levels of the four chemokines across patients within the combined validation cohorts. In the Meta-GPL6480 cohort, samples were categorized into three groups: 4-CXChigh with the highest expression, 4-CXCmedian with intermediate expression, and 4-CXClow with the lowest expression. Survival analysis showed a statistically significant improvement in outcome for the 4-CXChigh group compared to the other two groups (log-rank test P < 0.001; Fig. 5a). Similarly, in the E-MTAB-386 and Meta-GPL570 cohorts, samples were stratified into 4-CXChigh and 4-CXClow groups with significantly different survival outcomes. As shown in Fig. 5b and 5c, patients in the 4-CXChigh group had significantly longer overall survival than those in the 4-CXClow group (log-rank test P = 0.036 for the E-MTAB-386 cohort; and P = 0.094 for the Meta-GPL570 cohort).
Fig. 5. External validation of the novel 4-chemokines-dominant molecular subtype in different public cohorts.

Heatmap of unsupervised hierarchical clustering of four chemokines expression and Kaplan‐Meier survival curves for overall survival between 4-chemokines-based subtypes in the Meta-GPL6480 cohort a E-MTAB-386 cohort b and Meta-GPL570 cohort c. d Forest plot of univariate and multivariate Cox proportional hazards regression analysis in three independent pooled cohorts.
Finally, we investigated the prognostic significance of the 4-CXC chemokine signature independent of clinical factors in three validation cohorts. Univariate Cox regression analyses revealed that patients classified in the 4-CXChigh group had significantly longer overall survival than those in the other groups. Specifically, in the Meta-GPL6480 cohort, the 4-CXChigh group showed a 37% reduction in the risk of death compared to the 4-CXClow-median group (HR = 0.63, 95% CI = 0.48–0.82, P < 0.001). Similarly, the E-MTAB-386 cohort showed a 40% reduction in the risk of death (HR = 0.60, 95% CI = 0.37–0.97, P = 0.039), while the Meta-GPL570 cohort showed a 17% reduction (HR = 0.83, 95% CI = 0.67–1.03, P = 0.096). Furthermore, in multivariate Cox regression analyses, the association between the 4-CXC chemokine signature and survival remained significant after adjusting for clinical factors, indicating the robust independent prognostic value of the 4-CXC chemokine signature (HR = 0.51, 95% CI = 0.31–0.85, P = 0.010 for the Meta-GPL6480 cohort; HR = 0.55, 95% CI = 0.34–0.91, P = 0.019 for the E-MTAB-386 cohort and HR = 0.61, 95% CI = 0.43–0.86, P = 0.005 for the Meta-GPL570 cohort) (Fig. 5d).
Immunohistochemical analyses and validation in an in-house cohort
Given the established correlations between the expression of four chemokine genes and prognosis, we analyzed the protein expression levels of CXCL9, CXCL10, CXCL11 and CXCL13 by IHC in our in-house cohort of 39 clinical OV samples. Subsequent unsupervised clustering analysis based on the protein expression levels of these chemokines uncovered two distinct clusters: one with higher expression (4-CXChigh) and another with lower expression (4-CXClow) among the 39 patients (Fig. 6a and 6b). Representative IHC images showing the four chemokines in cases from both the 4-CXChigh and 4-CXClow groups are shown in Fig. 6c. Kaplan-Meier analysis revealed a significant correlation between tumors in the 4-CXChigh group and improved survival as indicated by OS (HR = 0.28, 95% CI = 0.12–0.63, P = 0.002) and RFS (HR = 0.28, 95% CI = 0.13–0.64, P = 0.002) compared to the 4-CXClow group (Fig. 6d and 6e and Supplementary Fig. S3). After multivariate analysis and adjustment for clinical factors, the HR for OS and PFS between 4-CXChigh and 4-CXClow was 0.10 (95% CI = 0.03–0.32, P < 0.001) and 0.11 (95% CI = 0.03–0.33, P < 0.001), respectively, as shown in Fig. 6e and Supplementary Fig. S3, demonstrating that four-chemokine signature was independently correlated with OS and RFS.
Fig. 6. Immunostaining analyses and validation of the chemokines-dominant subtype in the HMUCH cohort.

a Heat map of protein expression of four chemokines in the HMUCH cohort. b Bar chart depicting the H-Score of four immunohistochemistry markers in the 4-CXChigh and 4-CXClow groups. c Representative IHC staining images of four chemokines for 4-CXChigh and 4-CXClow patient. d Kaplan-Meier curves showing the difference in OS and RFS between 4-CXChigh and 4-CXClow groups. e Forest plot showing the results of univariate and multivariate Cox proportional hazards regression analysis. RFS recurrence-free survival, OS overall survival.
Discussion
In this study, we performed an integrative multi-cohort analysis of transcriptome data from approximately 3000 OV patients to explore the clinical-biological significance of immune orientation towards the cytotoxic response. This study represents the largest multi-platform transcriptome analysis and demonstrated a significant association between immune cell orientation towards cytotoxicity and patient outcomes in OV. In addition, four chemokines (CXCL9, CXCL10, CXCL11 and CXCL13) were identified as critical mediators in the establishment of an active T cell-inflamed antitumor phenotype.
Although accumulating evidence from various solid tumor types has linked the immunologically active cancer phenotype, characterized by a Th-1 immune response, with a favorable prognosis and increased responsiveness to immunotherapy, this association has not been observed in all cancer types [15, 32, 33]. The ICR, indicative of a TME polarized toward a Th-1/cytotoxic response, has been widely used to define the continuum of cancer immune surveillance and the functional orientation of protective antitumor immunity [32]. In this study, we extended the ICR classification to a retrospective pooled set of 1120 OV samples and observed a significantly prolonged survival of patients with OV tumors exhibiting a coordinated expression of ICR marker genes. Our results demonstrate that the ICR is a robust prognostic indicator in OV, stratifying patients into groups with significantly different overall survival outcomes. As demonstrated by multivariate analysis, the independent prognostic value of ICR revealed the importance of immune orientation towards a cytotoxic response in influencing OV prognosis.
The observed differential expression of chemokines, particularly within the CXC family, between the ICRhigh and ICRlow groups underscores the critical role of chemokines in regulating the active T-cell–inflamed antitumor phenotype of ovarian cancer. The identification of enriched chemokine-related and MHC class II pathways in the ICRhigh group suggests a potential molecular mechanism for maintaining an immune-active tumor microenvironment, that may contribute to favorable outcomes in ovarian cancer patients. These findings are consistent with previous studies indicating the essential role of chemokines in recruiting effector immune cells to the tumor microenvironment, thereby enhancing antitumor responses [34–37]. Our study successfully identified two chemokine-based subgroups in OV and validated this classification in multiple public datasets and our in-house validation cohort using unsupervised analysis of the expression profiles of CXCL9, CXCL10, CXCL11, and CXCL13. Previous studies have suggested that CXCL10 regulates the TME in OV cancer, leading to significant immune cell infiltration [38, 39]. In addition, CXCL9 cooperates with CCL5 to play a crucial role in coordinating T cell responses within tumors, shaping T cell inflammatory phenotypes, and influencing the efficacy of checkpoint immunotherapy [40]. Furthermore, epigenetic silencing of the Th1 chemokines CXCL9 and CXCL10 can alter the T cell landscape and serve as a reversible mechanism used by tumors to evade immune surveillance [41]. A recent study has elucidated the significant role of CXCL13, expressed by stromal cells and macrophages, as a potent chemokine for recruiting B-cells [42]. CXCL13 also aids in sustaining CD8 + T cells within tertiary lymphoid structures (TLSs) and enhances the combined therapeutic efficacy of CXCL13 and PD-1 blockade therapy in high-grade serous ovarian cancer. The pivotal involvement of CXCL13 in forming an antitumor TME suggests its potential as a crucial component in therapeutic interventions against OV [43].
Our results provide evidence for the involvement of CXC chemokine gene induction in facilitating immune cell infiltration, thereby promoting the development of a pro-inflammatory T-cell response against tumors. Specifically, we observed a significant increase in the presence of activated CD4 + T cells, activated CD8 + T cells, macrophages, Th1 T cells, and DCs within the 4-CXChigh group compared to the 4-CXClow group. Previous studies have suggested that DCs play a critical role as immune system sentinels, capable of detecting tumor-specific antigens displayed on cancer cell surfaces [44]. Macrophages in the tumor microenvironment can adopt either an antitumor M1 phenotype or a pro-tumor M2 phenotype, with the heterogeneity of tumor-associated macrophages (TAMs) being influenced by various stimuli in the TME [45, 46]. This complexity highlights the importance of investigating the role of immune cells in OV, as the normal immune response may not be sufficient to fight the tumor effectively. Understanding the potential mechanisms underlying immune cell interactions in the TME is essential for developing effective therapeutic strategies.
Through a detailed analysis at the single-cell level, we investigated how cellular components interact through chemokine receptor signaling in the regulation of TME. Our findings indicated that macrophages are the primary sources of chemokine secretion, with M1 macrophages exhibiting higher expression levels than M2 macrophages. Previous studies have corroborated these results, demonstrating a correlation between a higher prevalence of M1 macrophages in ovarian cancer patients and improved OS [13]. Furthermore, a higher ratio of M1/M2 TAMs has been associated with improved 5-year survival in patients [13, 47]. In addition, CCR3 has been recognized as a primary receptor for CXCL9, CXCL10, and CXCL11, facilitating the recruitment of CD4 + T cells, CD8 + T cells and NK cells. These findings suggest that OV may induce antitumor responses by recruiting immune cells and activating the tumor microenvironment through the upregulation of these chemokines, which is consistent with existing literature showing that chemokines such as CXCL9, CXCL10, and CXCL11 facilitate interactions with their receptor CXCR3 following IFNγ induction, thereby orchestrating the selective recruitment of CD4 + TH1 cells, CD8 + T cells, NK cells and NKT cells to sites of inflammation [34].
In summary, our study found a significant association between the direction of immune cell cytotoxicity and clinical outcomes in OV, and identified a gene panel consisting of four chemokines (CXCL9, CXCL10, CXCL11 and CXCL13) as critical mediators in the assembly of an active T-cell–inflamed antitumor phenotype. This 4-chemokine signature has introduced a novel immune classification in OV that has the potential to predict prognosis and identify individuals who may benefit the most from chemokine-targeted combination therapies. This study provides novel perspectives on immune diversity in the TME and suggests the potential for personalized therapeutic strategies based on individual immune profiles.
Supplementary information
Author contributions
MZ and JS conceived and designed the study. FLM and KDS prepared samples and performed the experiments. LLZ and FLM analyzed the data and interpreted the results. All authors were involved in writing the paper and had final approval of the submitted and published version.
Funding
This study was supported by the National Natural Science Foundation of China (Grant No. 62272346), the Science and Technology Innovation Medical Development Foundation Project of Beijing (Grant No. KC2021-JF-0055-01), and the Medical Award Foundation Project of Beijing (Grant No. YXJL-2021-0577-0421, YXJL-2023-0894-0044). The funders had no roles in study design, data collection and analysis, publication decision, or manuscript preparation.
Data availability
The clinical and transcriptome data of ovarian tumors were retrieved from the GEO, TCGA and ArrayExpress data repositories. Single-cell RNA sequencing data were derived from Zheng’s study. Detailed information of ovarian cancer datasets used in this study in Supplementary Table 1.
Competing interests
The authors declare no competing interests.
Ethics approval and consent to participate
The study was performed in accordance with the Declaration of Helsinki and was approved by the Ethics Committee of the Harbin Medical University Cancer Hospital (KY2021-45). Informed consent of patients was waived due to the retrospective nature of the study.
Footnotes
Publisher’s note Springer Nature remains neutral with regard to jurisdictional claims in published maps and institutional affiliations.
These authors contributed equally: Lili Zhuo, Fanling Meng
Contributor Information
Meng Zhou, Email: zhoumeng@wmu.edu.cn.
Jie Sun, Email: suncarajie@wmu.edu.cn.
Supplementary information
The online version contains supplementary material available at 10.1038/s41416-024-02803-7.
References
- 1.Siegel RL, Miller KD, Wagle NS, Jemal A. Cancer statistics, 2023. CA Cancer J Clin. 2023;73:17–48. 10.3322/caac.21763 [DOI] [PubMed] [Google Scholar]
- 2.Sun J, Bao S, Xu D, Zhang Y, Su J, Liu J, et al. Large-scale integrated analysis of ovarian cancer tumors and cell lines identifies an individualized gene expression signature for predicting response to platinum-based chemotherapy. Cell Death Dis. 2019;10:661. 10.1038/s41419-019-1874-9 [DOI] [PMC free article] [PubMed] [Google Scholar]
- 3.Chen L, Ma R, Luo C, Xie Q, Ning X, Sun K, et al. Noninvasive early differential diagnosis and progression monitoring of ovarian cancer using the copy number alterations of plasma cell-free DNA. Transl Res. 2023;262:12–24. 10.1016/j.trsl.2023.07.005 [DOI] [PubMed] [Google Scholar]
- 4.Veneziani AC, Gonzalez-Ochoa E, Alqaisi H, Madariaga A, Bhat G, Rouzbahman M, et al. Heterogeneity and treatment landscape of ovarian carcinoma. Nat Rev Clin Oncol. 2023;20:820–42. 10.1038/s41571-023-00819-1 [DOI] [PubMed] [Google Scholar]
- 5.Yang Y, Wu SF, Bao W. Molecular subtypes of endometrial cancer: implications for adjuvant treatment strategies. Int J Gynaecol Obstet. 2024;164:436–59. 10.1002/ijgo.14969 [DOI] [PubMed] [Google Scholar]
- 6.Guo CC, Lee S, Lee JG, Chen H, Zaleski M, Choi W, et al. Molecular profile of bladder cancer progression to clinically aggressive subtypes. Nat Rev Urol. 2024;21:391–405. [DOI] [PubMed]
- 7.Dienstmann R, Vermeulen L, Guinney J, Kopetz S, Tejpar S, Tabernero J. Consensus molecular subtypes and the evolution of precision medicine in colorectal cancer. Nat Rev Cancer. 2017;17:268. 10.1038/nrc.2017.24 [DOI] [PubMed] [Google Scholar]
- 8.Collisson EA, Bailey P, Chang DK, Biankin AV. Molecular subtypes of pancreatic cancer. Nat Rev Gastroenterol Hepatol. 2019;16:207–20. 10.1038/s41575-019-0109-y [DOI] [PubMed] [Google Scholar]
- 9.Yang Z, Zhang Y, Zhuo L, Sun K, Meng F, Zhou M, et al. Prediction of prognosis and treatment response in ovarian cancer patients from histopathology images using graph deep learning: a multicenter retrospective study. Eur J Cancer. 2024;199:113532. 10.1016/j.ejca.2024.113532 [DOI] [PubMed] [Google Scholar]
- 10.Yang L, Zhang Z, Dong J, Zhang Y, Yang Z, Guo Y, et al. Multi-dimensional characterization of immunological profiles in small cell lung cancer uncovers clinically relevant immune subtypes with distinct prognoses and therapeutic vulnerabilities. Pharm Res. 2023;194:106844. 10.1016/j.phrs.2023.106844 [DOI] [PubMed] [Google Scholar]
- 11.Thorsson V, Gibbs DL, Brown SD, Wolf D, Bortone DS, Ou Yang TH, et al. The immune landscape of cancer. Immunity. 2018;48:812–30 e14. 10.1016/j.immuni.2018.03.023 [DOI] [PMC free article] [PubMed] [Google Scholar]
- 12.Engels CC, Fontein DB, Kuppen PJ, de Kruijf EM, Smit VT, Nortier JW, et al. Immunological subtypes in breast cancer are prognostic for invasive ductal but not for invasive lobular breast carcinoma. Br J Cancer. 2014;111:532–8. 10.1038/bjc.2014.338 [DOI] [PMC free article] [PubMed] [Google Scholar]
- 13.Yan C, Li K, Meng F, Chen L, Zhao J, Zhang Z, et al. Integrated immunogenomic analysis of single-cell and bulk tissue transcriptome profiling unravels a macrophage activation paradigm associated with immunologically and clinically distinct behaviors in ovarian cancer. J Adv Res. 2023;44:149–60. 10.1016/j.jare.2022.04.006 [DOI] [PMC free article] [PubMed] [Google Scholar]
- 14.Sun J, Yan C, Xu D, Zhang Z, Li K, Li X, et al. Immuno-genomic characterisation of high-grade serous ovarian cancer reveals immune evasion mechanisms and identifies an immunological subtype with a favourable prognosis and improved therapeutic efficacy. Br J Cancer. 2022;126:1570–80. 10.1038/s41416-021-01692-4 [DOI] [PMC free article] [PubMed] [Google Scholar]
- 15.Bertucci F, Niziers V, de Nonneville A, Finetti P, Mescam L, Mir O, et al. Immunologic constant of rejection signature is prognostic in soft-tissue sarcoma and refines the CINSARC signature. J Immunother Cancer. 2022;10:e003687. 10.1136/jitc-2021-003687 [DOI] [PMC free article] [PubMed] [Google Scholar]
- 16.Teschendorff AE, Miremadi A, Pinder SE, Ellis IO, Caldas C. An immune response gene expression module identifies a good prognosis subtype in estrogen receptor negative breast cancer. Genome Biol. 2007;8:R157. 10.1186/gb-2007-8-8-r157 [DOI] [PMC free article] [PubMed] [Google Scholar]
- 17.Roelands J, Kuppen PJK, Ahmed EI, Mall R, Masoodi T, Singh P, et al. An integrated tumor, immune and microbiome atlas of colon cancer. Nat Med. 2023;29:1273–86. 10.1038/s41591-023-02324-5 [DOI] [PMC free article] [PubMed] [Google Scholar]
- 18.Gautier L, Cope L, Bolstad BM, Irizarry RA. affy—analysis of affymetrix GeneChip data at the probe level. Bioinformatics. 2004;20:307–15. 10.1093/bioinformatics/btg405 [DOI] [PubMed] [Google Scholar]
- 19.Hao D, Li J, Jia S, Meng Y, Zhang C, Wang L, et al. Integrated analysis reveals tubal- and ovarian-originated serous ovarian cancer and predicts differential therapeutic responses. Clin Cancer Res. 2017;23:7400–11. 10.1158/1078-0432.CCR-17-0638 [DOI] [PubMed] [Google Scholar]
- 20.Mermel CH, Schumacher SE, Hill B, Meyerson ML, Beroukhim R, Getz G. GISTIC2.0 facilitates sensitive and confident localization of the targets of focal somatic copy-number alteration in human cancers. Genome Biol. 2011;12:R41. 10.1186/gb-2011-12-4-r41 [DOI] [PMC free article] [PubMed] [Google Scholar]
- 21.Markham A, Das R, Grosse-Wentrup M. A Distance Covariance-based Kernel for Nonlinear Causal Clustering in Heterogeneous Populations. In: Bernhard S, Caroline U, Kun Z, editors. Proceedings of the First Conference on Causal Learning and Reasoning; Proceedings of Machine Learning Research: PMLR; 2022. p. 542–58.
- 22.Subramanian A, Tamayo P, Mootha VK, Mukherjee S, Ebert BL, Gillette MA, et al. Gene set enrichment analysis: a knowledge-based approach for interpreting genome-wide expression profiles. Proc Natl Acad Sci USA. 2005;102:15545–50. 10.1073/pnas.0506580102 [DOI] [PMC free article] [PubMed] [Google Scholar]
- 23.Li B, Severson E, Pignon J-C, Zhao H, Li T, Novak J, et al. Comprehensive analyses of tumor immunity: implications for cancer immunotherapy. Genome Biol. 2016;17:174. 10.1186/s13059-016-1028-7 [DOI] [PMC free article] [PubMed] [Google Scholar]
- 24.Becht E, Giraldo NA, Lacroix L, Buttard B, Elarouci N, Petitprez F, et al. Estimating the population abundance of tissue-infiltrating immune and stromal cell populations using gene expression. Genome Biol. 2016;17:218. 10.1186/s13059-016-1070-5 [DOI] [PMC free article] [PubMed] [Google Scholar]
- 25.Barbie DA, Tamayo P, Boehm JS, Kim SY, Moody SE, Dunn IF, et al. Systematic RNA interference reveals that oncogenic KRAS-driven cancers require TBK1. Nature. 2009;462:108–12. 10.1038/nature08460 [DOI] [PMC free article] [PubMed] [Google Scholar]
- 26.Racle J, de Jonge K, Baumgaertner P, Speiser DE, Gfeller D. Simultaneous enumeration of cancer and immune cell types from bulk tumor gene expression data. eLife. 2017;6:e26476. [DOI] [PMC free article] [PubMed]
- 27.Zheng X, Wang X, Cheng X, Liu Z, Yin Y, Li X, et al. Single-cell analyses implicate ascites in remodeling the ecosystems of primary and metastatic tumors in ovarian cancer. Nat Cancer. 2023;4:1138–56. 10.1038/s43018-023-00599-8 [DOI] [PMC free article] [PubMed] [Google Scholar]
- 28.Wang Y, Wang R, Zhang S, Song S, Wang L. iTALK: an R package to characterize and illustrate intercellular communication. Am Soc Hematol. 2019;Preprint at bioRxiv 507871.
- 29.Humphries MP, Maxwell P, Salto-Tellez M. QuPath: The global impact of an open source digital pathology system. Computational Struct Biotechnol J. 2021;19:852–9. 10.1016/j.csbj.2021.01.022 [DOI] [PMC free article] [PubMed] [Google Scholar]
- 30.Paschalis A, Sheehan B, Riisnaes R, Rodrigues DN, Gurel B, Bertan C, et al. Prostate-specific membrane antigen heterogeneity and DNA repair defects in prostate cancer. Eur Urol. 2019;76:469–78. 10.1016/j.eururo.2019.06.030 [DOI] [PMC free article] [PubMed] [Google Scholar]
- 31.Bankhead P, Loughrey MB, Fernández JA, Dombrowski Y, McArt DG, Dunne PD, et al. QuPath: open source software for digital pathology image analysis. Sci Rep. 2017;7:16878. 10.1038/s41598-017-17204-5 [DOI] [PMC free article] [PubMed] [Google Scholar]
- 32.Roelands J, Hendrickx W, Zoppoli G, Mall R, Saad M, Halliwill K, et al. Oncogenic states dictate the prognostic and predictive connotations of intratumoral immune response. J Immunother Cancer. 2020;8:e000617. 10.1136/jitc-2020-000617 [DOI] [PMC free article] [PubMed] [Google Scholar]
- 33.Bertucci F, Finetti P, Simeone I, Hendrickx W, Wang E, Marincola FM, et al. The immunologic constant of rejection classification refines the prognostic value of conventional prognostic signatures in breast cancer. Br J Cancer. 2018;119:1383–91. 10.1038/s41416-018-0309-1 [DOI] [PMC free article] [PubMed] [Google Scholar]
- 34.Dillemans L, De Somer L, Neerinckx B, Proost P. A review of the pleiotropic actions of the IFN-inducible CXC chemokine receptor 3 ligands in the synovial microenvironment. Cell Mol Life Sci. 2023;80:78. 10.1007/s00018-023-04715-w [DOI] [PMC free article] [PubMed] [Google Scholar]
- 35.Mempel TR, Lill JK, Altenburger LM. How chemokines organize the tumour microenvironment. Nat Rev Cancer. 2024;24:28–50. 10.1038/s41568-023-00635-w [DOI] [PMC free article] [PubMed] [Google Scholar]
- 36.Romero JM, Grünwald B, Jang GH, Bavi PP, Jhaveri A, Masoomian M, et al. A four-chemokine signature is associated with a T-cell-inflamed phenotype in primary and metastatic pancreatic cancer. Clin Cancer Res. 2020;26:1997–2010. 10.1158/1078-0432.CCR-19-2803 [DOI] [PubMed] [Google Scholar]
- 37.Zha Y, Spranger S, Hernandez KM, Li Y, Bao R, Alexieff P, et al. Density of immunogenic antigens does not explain presence or absence of the T cell-inflamed tumor microenvironment in metastatic melanoma. J Immunother Cancer. 2015;3:1. 10.1186/2051-1426-3-S2-P425 [DOI] [PMC free article] [PubMed] [Google Scholar]
- 38.K Au K, Peterson N, Truesdell P, Reid-Schachter G, Khalaj K, Ren R, et al. CXCL10 alters the tumour immune microenvironment and disease progression in a syngeneic murine model of high-grade serous ovarian cancer. Gynecol Oncol. 2017;145:436–45. 10.1016/j.ygyno.2017.03.007 [DOI] [PubMed] [Google Scholar]
- 39.Jin J, Li Y, Muluh TA, Zhi L, Zhao Q. Identification of CXCL10-relevant tumor microenvironment characterization and clinical outcome in ovarian cancer. Front Genet. 2021;12:678747. 10.3389/fgene.2021.678747 [DOI] [PMC free article] [PubMed] [Google Scholar]
- 40.Dangaj D, Bruand M, Grimm AJ, Ronet C, Barras D, Duttagupta PA, et al. Cooperation between constitutive and inducible chemokines enables T cell engraftment and immune attack in solid tumors. Cancer Cell. 2019;35:885–900.e10. 10.1016/j.ccell.2019.05.004 [DOI] [PMC free article] [PubMed] [Google Scholar]
- 41.Peng D, Kryczek I, Nagarsheth N, Zhao L, Wei S, Wang W, et al. Epigenetic silencing of TH1-type chemokines shapes tumour immunity and immunotherapy. Nature. 2015;527:249–53. 10.1038/nature15520 [DOI] [PMC free article] [PubMed] [Google Scholar]
- 42.Hoellwerth M, Koelblinger P, Lang R, Harrer A. Revisiting the role of the CXCL13/CXCR5-associated immune axis in melanoma: potential implications for Anti-PD-1-related biomarker research. Life. 2023;13:553. 10.3390/life13020553 [DOI] [PMC free article] [PubMed] [Google Scholar]
- 43.Yang M, Lu J, Zhang G, Wang Y, He M, Xu Q, et al. CXCL13 shapes immunoactive tumor microenvironment and enhances the efficacy of PD-1 checkpoint blockade in high-grade serous ovarian cancer. J Immunother Cancer. 2021;9:e001136. 10.1136/jitc-2020-001136 [DOI] [PMC free article] [PubMed] [Google Scholar]
- 44.Wylie B, Macri C, Mintern JD, Waithman J. Dendritic cells and cancer: from biology to therapeutic intervention. Cancers. 2019;11:521. 10.3390/cancers11040521 [DOI] [PMC free article] [PubMed] [Google Scholar]
- 45.Xue J, Schmidt SV, Sander J, Draffehn A, Krebs W, Quester I, et al. Transcriptome-based network analysis reveals a spectrum model of human macrophage activation. Immunity. 2014;40:274–88. 10.1016/j.immuni.2014.01.006 [DOI] [PMC free article] [PubMed] [Google Scholar]
- 46.Ostuni R, Kratochvill F, Murray PJ, Natoli G. Macrophages and cancer: from mechanisms to therapeutic implications. Trends Immunol. 2015;36:229–39. 10.1016/j.it.2015.02.004 [DOI] [PubMed] [Google Scholar]
- 47.Hensler M, Kasikova L, Fiser K, Rakova J, Skapa P, Laco J, et al. M2-like macrophages dictate clinically relevant immunosuppression in metastatic ovarian cancer. J Immunother Cancer. 2020;8:e000979. 10.1136/jitc-2020-000979 [DOI] [PMC free article] [PubMed] [Google Scholar]
Associated Data
This section collects any data citations, data availability statements, or supplementary materials included in this article.
Supplementary Materials
Data Availability Statement
The clinical and transcriptome data of ovarian tumors were retrieved from the GEO, TCGA and ArrayExpress data repositories. Single-cell RNA sequencing data were derived from Zheng’s study. Detailed information of ovarian cancer datasets used in this study in Supplementary Table 1.