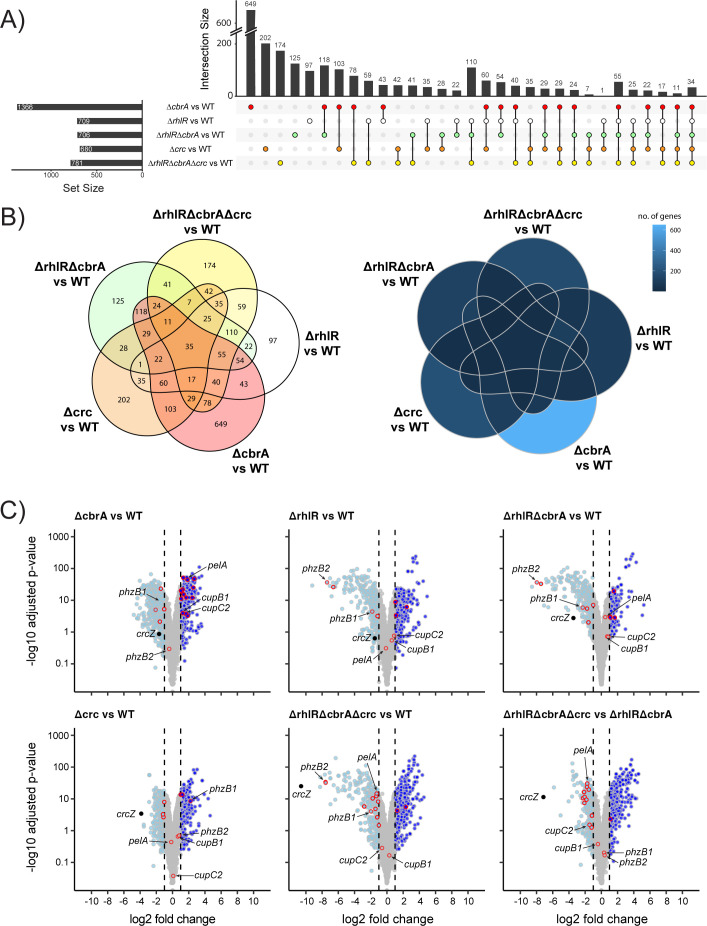
Fig 4.
RNA-seq analysis of biofilms of PA14 and mutants. (A) Upset plot showing overlaps in genes that are differentially regulated in ΔrhlR, ΔcbrA, Δcrc, ΔrhlRΔcbrA double, and ΔrhlRΔcbrAΔcrc triple mutants compared to WT. Numbers on top of each vertical bar indicate number of genes differentially regulated in each intersection. Set size indicates the total number of genes that are significantly differentially regulated in a particular mutant when compared to WT. (B) Venn diagrams showing overlaps in genes that are differentially regulated in ΔrhlR, ΔcbrA, Δcrc, ΔrhlRΔcbrA double, and ΔrhlRΔcbrAΔcrc triple mutants compared to WT. Numbers (left) or shade of blue (right) indicate number of genes differentially regulated in each intersection. (C) Volcano plots of RNA-seq data for ΔrhlR, ΔcbrA, Δcrc, ΔrhlRΔcbrA, and ΔrhlRΔcbrAΔcrc compared to WT, and ΔrhlRΔcbrAΔcrc compared to ΔrhlRΔcbrA. Light blue solid circles with gray outlines represent genes with expression fold-changes ≤−2 and the P values (Padj), adjusted using the Benjamini-Hochberg procedure, <0.05; dark blue solid circles with gray outlines represent genes with expression fold-changes ≥ 2 and the P values (Padj), adjusted using the Benjamini-Hochberg procedure, <0.05. Gray solid circles represent genes with gene expression fold changes ≥−2 or ≤2 or Padj ≥ 0.05. Genes reported to be associated with biofilms are outlined in red.

