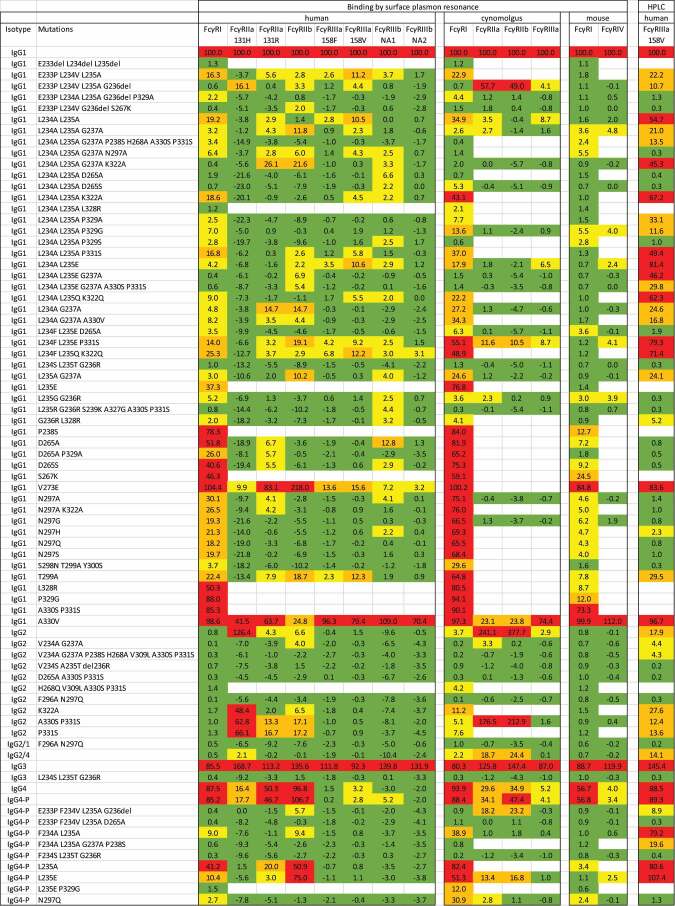
Table 2.
Relative binding responses of CD20 antibodies binding to human, cynomolgus and mouse Fc receptors measured by surface plasmon resonance or by affinity HPLC. All results are normalized and expressed as a percentage of wild-type IgG1. Due to assay noise, some of the normalized responses of negative samples are less than 0%. The magnitude of the negative values gives an impression of the experimental error for each receptor. Cells are shaded to indicate the response range: green = negative (less than 2%), yellow = low (2% to 10%), orange = substantial (10% to 40%), red = high (more than 40%).
 |
