

Summary
Due to rapid urbanization and climate change, cities face hidden drought risks. A single drought index may inadequately reflect urban meteorological drought. The indicator weight combination method does not fully consider index correlation and weight. This study constructed an urban meteorological drought evaluation index system and developed the Composite Fuzzy Matter Element Meteorological drought Comprehensive Index (CFEMCI) by combining the moment estimation weighting model. Analyzing Zhengzhou City from 2000 to 2019, CFEMCI effectively captured meteorological drought events, with a probability of detection (POD) > 0.78, critical success index (CSI) > 0.70, false alarm rate (FAR) < 0.13 and failure ratio (FR) < 0.22. Most meteorological droughts were classified as Grade I (no drought), with 26% being light and moderate (Grades II-III). Droughts mainly occurred in spring, and the summer drought showed a more significantly aggravating trend. This index provides reliable urban drought monitoring and supports disaster prevention and mitigation efforts.
Subject areas: Geography, Atmospheric science, Meteorology, Global change
Graphical abstract
Highlights
-
•
Developed a composite fuzzy matter element meteorological drought index (CFEMCI)
-
•
Introduced the moment estimation idea to determine the optimal weight of indicators
-
•
CFEMCI can accurately capture the occurrence and end of meteorological drought
-
•
CFEMCI detects drought events with POD >0.78, CSI >0.7, FAR <0.13, and FR < 0.22
Geography; Atmospheric science; Meteorology; Global change
Introduction
Drought is a complex natural phenomenon that continues to recur on multiple scales. It is also one of the natural disasters that can cause sustained and adverse consequences to sustainable social development.1 Drought is characterized by its wide range of impacts, high frequency of occurrence, long duration, and high economic losses.2,3 Due to gradual global warming, global drought is becoming increasingly prominent in regions such as Ethiopia, Kenya, subtropical South America, and East Africa.4,5,6 The drought situation in China and worldwide is showing an aggravating trend.7 This has seriously jeopardized socio-economic development and ecological stability.8 Therefore, it is particularly important to enhance the capacity to respond to drought risks and to monitor and assess regional drought severity. This can provide technical support for regional drought forecasting and early warning, drought loss reduction, and the formulation of disaster prevention and mitigation policies.
Characteristic variables, such as drought occurrence intensity, impact range, and, transmission time, are difficult to observe directly. Typically, drought indices are used to reflect drought using measured or simulated hydrological and meteorological data.9 Selecting appropriate drought indices allows for accurately assessing drought severity (e.g., intensity, duration, and extent) in a region and studying the propagation characteristics among different types of droughts (e.g., response timescale, lag time, propagation rate and spatial propagation).10 Different types of droughts should be assessed using different drought indices. Drought types are generally divided into four categories: meteorological drought, hydrological drought, agricultural drought, and socio-economic drought.11,12 Some studies also classify drought into meteorological drought, agricultural drought, surface water drought, and groundwater drought, leading to socio-economic drought and ecological drought.13 Regardless of the classification criteria of drought types, meteorological drought, where precipitation is the main factor, occurs first and serves as the beginning and foundation for the other drought types.14 Meteorological drought is also the dominant factor in the occurrence of the other drought types.15 Meteorological drought is characterized as regional extreme climate events with long duration and wide impact range. An effective meteorological drought index can provide significant research background and references for studying the other drought types.16 Therefore, establishing a scientific method to quantify the meteorological drought index is crucial for diagnosing regional drought severity.
In recent decades, meteorological drought indices have developed rapidly. The applications and applicability of different meteorological drought indices may vary in different regions and under different meteorological conditions. However, they are all important tools to measure meteorological drought situations.17,18 Currently, mature meteorological drought indices worldwide are mainly divided into single-factor indices, such as the precipitation frequency analysis method19,20 and the standardized precipitation index (SPI).21 Single-factor indices are mostly based on precipitation with different calculation principles, lacking representativeness. Multi-factor indices have been improved based on single-factor indices, such as the relative moisture index (MI),22 the standardized precipitation evapotranspiration index (SPEI),23 and the Palmer drought severity index (PDSI).24 The multi-factor index comprehensively considers meteorological factors in addition to precipitation.25 However, the evaluation methods still have shortcomings, and the indicator systems lack unified standards.
Many important meteorological drought indices have widely been used. For example, the standardized precipitation index (SPI) can be flexibly used on multiple temporal scales and under different climate conditions while considering precipitation data.26 PDSI has a strong capability to identify drought due to its consideration of soil data and total water balance methods.27 SPEI has a better ability to describe drought after considering evapotranspiration factors.28 These indices can consider different elements and have different calculation principles. However, meteorological drought is influenced by various factors and is characterized differently in different research areas. The analysis results of different meteorological drought indices may also vary for the same region. For different regions, the application scope of the indices also varies.29 It is currently urgent for hydrological workers to minimize the differences and maximize the application scope. Therefore, different data and processing methods required for different drought indices can be integrated, considering both multiple indices and factors. A comprehensive index based on multiple drought indices can be established to effectively conduct drought monitoring and prediction.30 In recent years, in-depth exploratory research has been conducted in the field of multi-indicator drought comprehensive evaluation, conveying comprehensive and reliable real-time drought conditions to management departments and the public. Karamouz et al. used artificial neural networks to construct a hybrid drought index (HDI) based on three drought indices.31 Hao et al. proposed a multivariate standardized draft index (MSDI) using the copula joint distribution function.32 Li et al. used the three-dimensional drought space to construct the Precipitation Temperature Evapotranspiration Drought Index (PTEDI) combined the Precipitation Condition Index (PCI), Temperature Condition Index (TCI), and Evapotranspiration Condition Index (ETCI).33 Liu et al. constructed the temperature-SIF-Water Balance Dryness Index (TSWDI) based on remote sensing technology to verify the applicability of TSWDI in monitoring agricultural and meteorological drought.34 Keyantash et al. developed an aggregate drought index (ADI) using precipitation, runoff and other physical form variables.35 Rajsekhar et al. constructed a multivariate drought index (MDI) based on entropy theory.36 Bravo et al. constructed a drought composite index (DCI) using the analytic hierarchy process (AHP) based on multiple indicators such as precipitation, sunshine speed, and wind speed.37
The commonly used methods for multi-indicator comprehensive drought evaluation include machine learning, joint distribution, and indicator weight combination. The machine learning method mainly demonstrates the fuzzy spatial correlation between drought index and drought conditions through training methods based on a large number of drought data.31,38 This method can efficiently process data and solve the problem of inconsistent spatiotemporal scales. However, machine learning has strict requirements for data volume and specific regional limitations. The joint distribution method mainly derives the joint cumulative probability of drought indices by constructing a joint distribution function. It can be easily affected by the number of indices and lacks a reasonable explanation of the underlying mechanism.32,39 Compared to the machine learning and joint distribution methods, the indicator weight combination method is mainly achieved by weighting various single indicators. This method is currently the most common construction method, with simple structures and easy operation. The key to this method lies in indicator selection and reasonable weight allocation. Consequently, this may ignore indicator correlation and does not fully consider weights. The fuzzy matter element model utilizes the concept of matter element analysis40 and the theories of fuzziness and Euclidean closeness, to analyze incompatibility problems.41 This method, as a mathematical language and quantitative tool, can describe quantitative and qualitative changes in things. Thus, this method is suitable for multi-indicator evaluation.42,43 When drought indicator values are bounded by two adjacent levels, this method can effectively solve relative classification and determine classification thresholds for drought evaluation results, thereby improving indicator correlation and analysis reliability. Meanwhile, indicator weight is one of the most important factors affecting multi-indicator evaluation.44 Common weighting methods include subjective weighting, objective weighting, and comprehensive weighting. Subjective weighting methods include AHP,45,46 order relation analysis (G1)47, and priority charts.48 These methods have the advantage of expert experience but are greatly influenced by human factors.49,50,51 Objective weighting methods include entropy weighting,52 CRITIC weighting53, and information content weighting. These methods can avoid subjective arbitrariness without subjective advantages.36,54 Comprehensive weighting methods often use multiplicative synthetic normalization or linear weighting methods.55,56,57 However, it is yet to be explored in addressing the "double effect" and reasonably determining weighting coefficients. Therefore, it is urgent to select an appropriate method for determining indicator weights. Constructing an index by considering indicator correlation and appropriate weighting models is an attempt to diagnose drought hazards and a theoretical method based on multiple meteorological drought indices.
Therefore, in order to comprehensively and objectively evaluate the characteristics of urban meteorological drought, this study selected MI, SPEI, and PDSI to establish an evaluation index system for urban meteorological drought. Then, the weights determined by AHP, G1, CRITIC, and the entropy weight method were used as the basic weight matrix to establish an optimization model. This model had an objective function of minimizing the deviation between the combination weight and the basic weight. The moment estimation idea was introduced to solve the combination weight of each indicator 58 Then, combined with the composite fuzzy matter element model, the urban meteorological drought comprehensive index, namely, the Composite Fuzzy matter Element Meteorological drought Comprehensive Index (CFEMCI) was constructed. CFEMCI was used to comprehensively evaluate the urban meteorological drought situation in Zhengzhou City from 2000 to 2019. The advantages and limitations of the model were summarized. Considering the meteorological drought trend in Zhengzhou City, the causes of meteorological drought in Zhengzhou City were analyzed. Disaster prevention and mitigation policies were also proposed. This study provides an approach for drought index construction, facilitating more accurate and comprehensive indicators for meteorological drought monitoring, drought severity evaluation and early warning of drought events.
Results
Weight of evaluation indicators
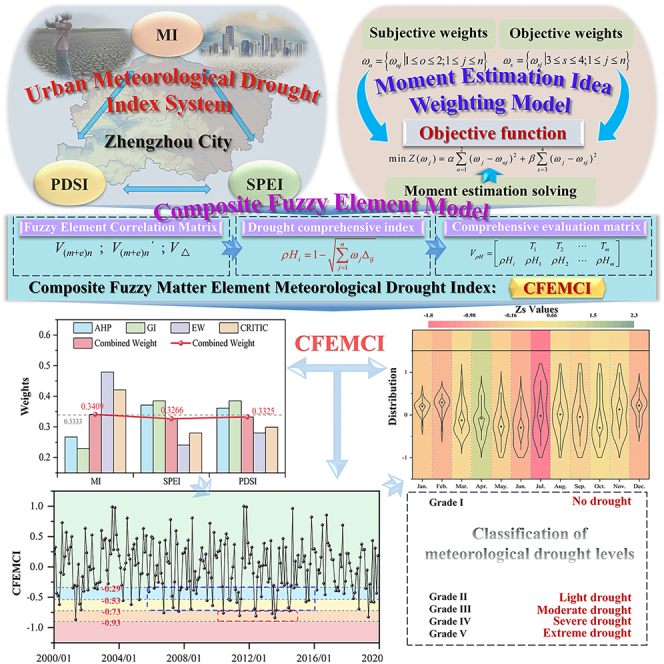
This study selected four methods from the subjective and objective weight methods to determine the combined weights of MI, SPEI, and PDSI in Zhengzhou from 2000 to 2019 (Figure 1). The weights by AHP and G1 were and , respectively. The weights of SPEI and PDSI by AHP and G1 remained around 0.38, much higher than those of MI. The weights by CRITIC and the entropy weight method were and , respectively. The weights of MI by both methods (above 0.40) were much higher than those of SPEI and PDSI, indicating significant differences and variability in MI. According to Equations 12 and 13, the relevant importance coefficients of subjective and objective weights were obtained: and . Then, the above subjective and objective weights and their relevant importance coefficients were substituted into the moment estimation weighting model to obtain the optimal combination weight of each indicator: . The combination weights were basically around the median (0.3333) of the four weights. SPEI and PDSI are subjectively believed to have relatively high weights. MI also exhibited a relatively high weight through objective calculations. The weights of the indicators from the moment estimation weighting model were maintained at 0.3367 ± 0.0042. This method considers not only subjective advantages but also the degree of variability of the indicators.
Figure 1.

Weights of various urban meteorological drought indicators
Meteorological drought assessment results
Changes in the meteorological drought index in Zhengzhou City
This study calculated the monthly scale MI, SPEI, and PDSI (Figures 2A–2C). Different meteorological drought indices showed different temporal oscillation frequencies, different numbers of identified drought events, different drought durations, and different dynamic characteristics. Taking SPEI as an example, the drought events identified by SPEI on the monthly scale mainly lasted for 1–3 months, showing a frequent phenomenon of dry-wet alternation. The monthly data of the three meteorological indicators for 20 years and the data of five evaluation criteria (4 cutoff values) were input into the composite fuzzy matter element model. The difference square composite fuzzy matter element matrix was calculated using Equations 2, 3, 4, 5, 6, and 7. Then, based on the weight coefficient from the moment estimation weighting model, the comprehensive index of the urban meteorological drought was calculated for each year, i.e., CFEMCI, as shown in Figure 2D. The trend and variation pattern of CFEMCI on a monthly scale were basically consistent with those of MI, SPEI, and PDSI, indirectly verifying the effectiveness of the calculated CFEMCI.
Figure 2.

The variation patterns of indices over time
Figure 3.

Changes in CFEMCI in Zhengzhou City from 2000 to 2019
Figure 4.

Temporal trend characteristic values and distribution of CFEMCI
Changes in meteorological drought grades in Zhengzhou City
The classification criteria for CFEMCI grades and thresholds as shown in Table 1. Among the evaluation criteria in different ranges, a comprehensive index was classified as follows: >-0.29, Grade I; −0.29 ∼ −0.53, Grade II; −0.53 ∼ −0.73, Grade III; −0.73 ∼ −0.93, Grade IV; <-0.93, Grade V.
Table 1.
Classification and threshold classification of CFEMCI
| Status | I | II | Ⅲ | Ⅳ | V |
|---|---|---|---|---|---|
| CFEMCI | > −0.29 | (-0.29, −0.53] | (-0.53, −0.73] | (-0.73, −0.93] | ≤ −0.93 |
| Grade | No drought Green |
Light drought Blue |
Moderate drought Yellow |
Severe drought Orange |
Extreme drought Red |
To visually display the CFEMCI changes in Zhengzhou City from 2000 to 2019, a comparative analysis was to visualize the CFEMCI changes in Zhengzhou City from 2000 to 2019, a comparative analysis was conducted between the comprehensive evaluation criteria at all grades and the urban meteorological drought comprehensive index for each year, as shown in Figure 3. The occurrence frequency of drought events in Zhengzhou City was as follows: no drought, 70%; light + moderate drought, 26%; severe drought, 4%; very few occurrences of extreme drought. Overall, the drought situation in Zhengzhou City has been relatively improved over the past 20 years. However, light and moderate droughts showed higher occurrence, mainly between 2007 and 2015. During this period, urban economic and social development was subjected to rapid growth, leading to more pronounced fluctuations in drought risks. Severe drought situations occurred more frequently around 2012, mainly due to increased rainless days in Zhengzhou.59,60 It is urgent to propose disaster prevention and mitigation measures, prevent water supply and demand imbalances, and address the potential occurrence of severe drought situations. In the event of a major drought, significant urban economic losses would occur.
Comprehensive indicator performance
In order to objectively quantify the characterization ability of CFEMCI for drought, we compared CFEMCI with its constituent meteorological indices (MI, SPEI, PDSI) and other meteorological drought indices, i.e., precipitation anomaly in percentage (PA) and SPI. A comprehensive analysis was conducted on the instances of missed, false, early, and late reporting of drought events.
CC was first used to evaluate the correlation degree of CFEMCI with MI, SPEI, PDSI, PA, and SPI, as shown in Table 2. The CCs of CFEMCI with MI, SPEI, and PDSI on the monthly scale were greater than 0.78, passing the 95% confidence interval test. CFEMCI showed the most significant relationship with SPEI, with a CC of up to 0.86 on the monthly scale. The results indicate that in the process of constructing the comprehensive index, the correlation with the basic meteorological indices was maintained, and no data distortion occurred due to the model-building process. This demonstrates that it was reasonable to use this method to construct the comprehensive index. The CFEMCI showed a low correlation (0.19) with other meteorological drought indices (PA and SPI). This is because PA and SPI are calculated solely based on precipitation data using different principles, making them single-factor indices. In contrast, the CFEMCI takes into account multiple factors, including precipitation, temperature, evapotranspiration, and soil moisture, thereby providing a more comprehensive assessment.
Table 2.
Drought characterization ability of CFEMCI
| Capture ability | CC | POD | CSI | FAR | FR |
|---|---|---|---|---|---|
| MI | 0.78 | 0.79 | 0.72 | 0.12 | 0.21 |
| SPEI | 0.86 | 0.81 | 0.76 | 0.07 | 0.19 |
| sc PDSI | 0.79 | 0.78 | 0.70 | 0.13 | 0.22 |
| PA | 0.19 | 0.78 | 0.71 | 0.12 | 0.22 |
| SPI | 0.19 | 0.80 | 0.73 | 0.07 | 0.16 |
The drought events for the monthly scale CFEMCI, MI, SPEI, PDSI, PA, and SPI sequences in Zhengzhou from 2000 to 2019 were identified using the run theory. The comprehensive ability of CFEMCI to capture drought events was validated using POD, CSI, FAR, and FR, as shown in Table 2. CFEMCI captured the five meteorological drought indices with POD >0.78, CSI >0.70, FAR <0.13, and FR < 0.22 in Zhengzhou City, with the overall FAR lower than FR. The results indicate that the CFEMCI accurately captures over 70% of meteorological drought events with few false alarms. The identification of meteorological drought frequency, occurrence time, duration, and other characteristics by different meteorological drought indices is not completely the same, resulting in some differences in the outcomes, and these differences are not significant. Due to these differences, the CFEMCI cannot fully identify drought events under different meteorological drought indices. The data shows that CFEMCI exhibited similar and relatively good capabilities in capturing drought events corresponding to the five meteorological drought indices. For the basic meteorological drought indices (MI, SPEI, and PDSI), CFEMCI had a stronger ability to capture drought events corresponding to SPEI, with the highest POD and CSI and the lowest FAR and FR. Conversely, CFEMCI was weak in capturing PDSI. However, due to the different degrees of recognition of drought event intensity by the three meteorological indices, the CFEMCI had a relatively high miss rate of drought events. For other meteorological drought indices (PA and SPI), even though their correlation with CFEMCI was low, CFEMCI still maintained good capability in capturing drought events corresponding to PA and SPI.
In summary, the CFEMCI constructed based on the composite fuzzy matter element-moment estimation weighting model in this study is characterized by reliability, sensitivity, and comprehensiveness. This index can comprehensively reflect meteorological drought, with a reliable ability to characterize meteorological drought events. It also combines the advantages of multiple meteorological drought indicators and can capture the occurrence and end of drought.
Monthly scale variation trend of meteorological drought
The monthly distribution of CFEMCI and the temporal trend characteristic values based on the MMK trend test are shown in Figure 4. The monthly trend characteristic values of Zs in Zhengzhou City from 2000 to 2019 were - 0.30, - 0.68, 0.02, 1.30, - 0.19, - 0.79, - 1.75, 0.05, - 0.19, 0.15, 0.05 and - 0.65. Zs > 0 indicates an alleviation trend of drought, with April being the most significant. Zs < 0 indicates an aggravating trend of drought, with July being the most significant. The overall drought situation in Zhengzhou City showed a slight aggravating trend, with alleviation trends in spring and autumn and aggravating trends in summer and winter. From the distribution of CFEMCI, it can be observed that the index distribution in different months in Zhengzhou City was mainly influenced by seasonal changes. The overall distribution level of the index from March to June was relatively lower compared to that in other months, prone to drought events. The index distribution from July to November was relatively average, showing dry-wet alternation. The distribution of the index from December to February was generally higher and more concentrated.
The trend characteristic value Zs was combined with the distribution of CFEMCI for an overall analysis. In spring, drought showed an alleviating trend, with a lower distribution of CFEMCI and a higher frequency of drought events over the years. In summer, drought showed an aggravating trend, with an average distribution of CFEMCI and alternating wet and dry climate conditions. In autumn, drought showed an alleviating trend, with a relatively average distribution of CFEMCI and more frequent droughts under alternating wet and dry conditions. In winter, drought showed an aggravating trend, with a higher distribution of CFEMCI and fewer drought events. In months and seasons with severe drought, drought monitoring should be strengthened. Drought prevention measures should be formulated to improve the ability to resist drought disasters.
Discussion
Advantages of the study
Many drought indices have been developed in previous drought monitoring studies,37,61 with a prevalent use of machine learning,31 joint distribution,32 and indicator weight combination methods. Compared to machine learning and joint distribution methods, the indicator weight combination method is currently the most common construction approach, which is particularly important for index selection and rational weight allocation. Therefore, this study started from the most basic and important meteorological drought types and selected multiple meteorological drought indices to overcome the limitations of using a single meteorological index. The CFEMCI based on a composite fuzzy matter element-moment estimation weighting model was proposed to characterize the meteorological drought in Zhengzhou City. The method of constructing a comprehensive index using this model has not yet been explored.
Firstly, this study selected the multi-factor meteorological drought indices (MI, SPEI, and PDSI) to construct the evaluation index system. Compared to other single-factor indices, multi-factor indices can be considered a more comprehensive and representative approach.25 Based on the principle of fuzzy matter element, we constructed a composite model that could transform the three meteorological indices (MI, SPEI, and PDSI) and evaluation standards (from no drought to extreme drought) into a comprehensive index (CFEMCI) and corresponding standards. Compared to other index combination methods, this model can better address relative grading levels, determine drought grading thresholds, and enhance the reliability of the comprehensive index.42,43 The weights determined by AHP, G1, CRITIC, and the entropy weight methods were used as the basic weight matrix. The moment estimation method was used to solve the optimal combination weight of each index. The subjective and objective weights differed significantly in weight assignment to the three selected meteorological drought indices (MI, SPEI, and PDSI). The combined weight values obtained by the moment estimation method were close to the median values of the weight values obtained by the four weighting methods. Compared to other single-weighting methods,35,36,37,62,63 this method considered both subjective advantages and the degree of variations in indicator values. This can overcome the problem of single subjective and objective weights. Secondly, the monthly scale trend and variation pattern of the constructed CFEMCI were similar to those of MI, SPEI, and PDSI. Combined with the urban development process of Zhengzhou City over the past two decades,64,65 the frequency of light and moderate droughts was 26%. Fewer severe droughts occurred in Zhengzhou, primarily around 2012, according to research by other scholars.59,60 This indicates the effectiveness and reliability of the constructed CFEMCI. CFEMCI had a significant correlation with MI, SPEI, and PDSI (p < 0.05) and can also reliably capture the occurrence of meteorological drought events, with the best effect on SPEI. This indicates the rationality of using this method to construct the composite index and the capability of CFEMCI to identify meteorological drought more accurately and comprehensively. Finally, the monthly CFEMCI distribution and the MMK-based temporal trend characteristic values indicate that Zhengzhou had more drought in spring and less drought in winter. Summer and autumn were in the dry-wet alternation stage. Drought in summer showed a significant increasing trend, which was consistent with the development and urban climate characteristics of Zhengzhou City.66,67,68 This further verified the adaptability of CFEMCI in the region. In summary, through comparisons with other relevant studies, we believe that the proposed comprehensive index has good application effects.
Limitations of the study
In addition, although CFEMCI can capture the start, duration, and end times of most meteorological drought events, it still has some limitations and shortcomings. (1) In the process of constructing comprehensive indicators, selecting different drought indices has varying degrees of effectiveness in identifying drought events. This can result in a relatively high incidence of underreporting of drought events in this study. Therefore, when applying the model in this study to construct composite indices for other regions, it is important to consider various factors, such as local urban types and climate conditions when selecting drought indices to establish the comprehensive index system. For example, MI is more suitable for monitoring and evaluating drought on a monthly (or longer) scale during the crop growing season.22 The climate weight coefficient and duration factor for PDSI vary in different regions.24,27 PA and SPEI are suitable for semi-arid and semi-humid areas.23,69 SPI is applicable to various regions across different time scales.21,26 (2) In constructing the evaluation index system, this study only considers meteorological drought as the subject of research, without considering other types of drought, such as agricultural, hydrological, and socio-economic droughts. In fact, drought is influenced by multiple factors.12,13 Therefore, it is more comprehensive to select multiple types of drought indices as the basis for comprehensive drought evaluation. (3) Temporally, this study only considers the exponential patterns on the monthly scale. Spatially, this study only considers the urban area of Zhengzhou as the whole research area. Expanding the range of temporal and spatial scales is necessary to improve the accuracy of the method. Increasing seasonal and annual scales and grid division of the study area can increase the rationality of the method. (4) The composite drought index in this study, along with many other composite drought indices, is constructed based on various data, methods, and principles. With the rapid development of satellite remote sensing technology, drought characteristics from regional to global scales can be continuously observed. Integrating remote sensing technology can greatly enhance drought research.70
Overall, the meteorological drought comprehensive index (CFEMCI) constructed based on the three meteorological drought indices and a composite fuzzy matter element-moment estimation weighting model can evaluate the urban meteorological drought to a high extent. CFEMCI is an effective tool for monitoring and predicting drought. The limitations and shortcomings in this study are urgent issues that need to be addressed in future research. However, the ideas of constructing this model can provide directions and insights for further drought assessment research.
Causes of urban meteorological drought and disaster prevention and mitigation policies
Different cities exhibit significant differences in factors such as geographical location, altitude, climate type, and urbanization development level.71 Figure 5 shows that in recent decades, frequent meteorological droughts can mainly be attributed to uneven rainfall distribution caused by urban climate change, temperature rise caused by rapid urban development and intensified heat island effect.64,72,73 Continuous population growth increases the daily water consumption of residents, leading to excessive water resource exploitation.74,75 Land warming affects atmospheric circulation, leading to the accelerated evapotranspiration of water resources and imbalanced water supply and demand. These are the main factors that promote the formation of drought.76,77 In severe cases, they can further increase the likelihood of extreme drought disasters.78,79
Figure 5.

Monthly average temperature and precipitation in Zhengzhou City from 2000 to 2019
Urban drought prevention and disaster reduction planning schemes tailored to local conditions need to be developed based on a city’s own construction and resource endowment. It is also necessary to improve the feasibility and pertinence of the planning schemes. Taking Zhengzhou City as an example, this study explores drought prevention and control planning strategies from three perspectives. (1) At the macro urban level: the meteorological, water conservancy, and emergency management departments of Zhengzhou City should jointly establish a drought disaster monitoring and early warning system and an emergency response plan.80,81 For the seasons with aggravating drought trends, particularly summer and winter (especially July), monitoring and early warning should be intensified. In the event of a drought (mostly light and moderate drought), emergency response measures should be implemented based on the risk assessment levels. The water department of Zhengzhou City should enhance the planning of water network connectivity, especially in developing areas, by planning underground water storage facilities to achieve balanced water resource distribution. The urban planning department should increase the urban green coverage, prioritizing the planting of drought-resistant plants, such as Sophora japonica, Fraxinus chinensis, and Cynodon dactylon, in areas prone to drought and in areas with low green coverage.82 (2) At the meso block level: communities and schools use can brochures, lectures, and public service advertisements to conduct drought safety and water-saving awareness campaigns, enhancing the public’s understanding and awareness of drought prevention.83 Each area can promote water-saving technologies, facilities, and greywater recycling systems, providing financial subsidies to households and businesses that install water-saving devices. Thus, this can improve residents' emergency water-saving capabilities. (3) At the microsite level: promoting rainwater infiltration paving technology in parks, squares, and neighborhoods. Residential communities and public facilities should be equipped with rainwater storage devices to improve the collection and utilization capacity of rainwater in Zhengzhou, reduce rainwater runoff, and ensure water supply during drought periods.84
Conclusions
This study starts from the perspective of meteorological drought, avoids the limitations of using a single meteorological drought index, and addresses the problem of unreasonable allocation of subjective and objective weights in multi-indicator comprehensive evaluation research. Three meteorological drought indices (i.e., MI, SPEI, and PDSI) are selected. A weighting model based on composite fuzzy matter element-moment estimation is proposed to construct the comprehensive meteorological drought index (CFEMCI). Then, CFEMCI is used to evaluate and analyze the meteorological drought characteristics of Zhengzhou City. The following conclusions are mainly drawn.
-
(1)
The traditional evaluation models have the problem of employing single indicators and ignoring the impact of specific environmental and social factors on regional drought. Thus, these models cannot fully reflect the complexity of drought, leading to limitations in evaluation results. This study proposes a composite fuzzy matter element model, which can effectively solve these problems. This model can handle uncertainty and fuzzy information, fully utilize the characteristic information of indicator data, and quantitatively describe the relative grading level of evaluation results. Multiple meteorological drought evaluation indicators and criteria are transformed into comprehensive indicators. This has great reference significance for improving the comprehensiveness and accuracy of the evaluation model.
-
(2)
In order to overcome the shortcomings of a single weighting method in terms of subjectivity and objectivity, this study selects four weighting methods (i.e., AHP, G1, CRITIC, and the entropy weighting method). An optimization model is constructed with the objective function of minimizing weight deviations. Then, the moment estimation method is used to solve the problem. The comprehensive weight value is maintained at 0.3367 ± 0.0042. This method incorporates the subjective advantages and combines the degree of variations in indicator values, significantly improving the "double effect" in the existing combination weight schemes. However, this method cannot avoid the subjective selection of basic weight sets, providing ideas for weight determination.
-
(3)
The model is applied using Zhengzhou City as an example. On the timescale from 2000 to 2019, the constructed CFEMCI has a significant correlation with MI, SPEI, and PDSI. CFEMCI has a strong ability to characterize meteorological drought and can effectively capture the occurrence time of meteorological drought. The drought in spring and autumn shows an annually alleviating trend. The meteorological drought is also concentrated in spring and autumn over the years. The summer drought shows a more significant aggravating trend year by year, and the climate is characterized by alternating dry-wet conditions.
Resource availability
Lead contact
Requests for further information and resources should be directed to the lead contact, Huiliang Wang (wanghuiliang@zzu.edu.cn).
Materials availability
This study did not generate new unique reagents.
Data and code availability
-
•
DATA: All datasets used in this study are publicly available: Monthly precipitation and temperature data used in this study were obtained from the China Meteorological Administration (http://data.cma.cn/).
-
•
CODE: This article does not report original code.
-
•
Any additional information required to reanalyze the data reported in this article is available from the lead contact upon request.
Acknowledgments
The research was funded by the Key Technologies Research and Development Program of China (2021YFC3000204), National Natural Science Foundation of China (52279028) and Research Fund of Key Laboratory of Water Management and Water Security for Yellow River Basin, Ministry of Water Resources (2022-SYSJJ-06). We thank anonymous reviewers for their insightful comments that have helped improve this article.
Author contributions
The contributions of each author were specified as follows: X.Z. developed the original idea, wrote original draft and wrote review & editing; F.Z., C.H. and Y.Z. were responsible for data collection and date processing; Z.W. provided research funding and wrote review & editing; H.W. provided research funding and served as the corresponding author on the revisions.
Declaration of interests
The authors declare no competing interests.
STAR★Methods
Key resources table
| REAGENT or RESOURCE | SOURCE | IDENTIFIER |
|---|---|---|
| Deposited data | ||
| Monthly precipitation and temperature data | the National Meteorological Information Center of the China Meteorological Administration (CMA) | http://data.cma.cn/ |
| Software and algorithms | ||
| ArcGIS | ESRI | https://www.arcgis.com/index.html |
| Origin 2022 | OriginLab | https://www.originlab.com/OriginProLearning.aspx |
Methods details
Study area and data sources
Zhengzhou is located in the south of the North China Plain and the north of central Henan Province (112°42′-114°14′ E, 34°16′-34°58′ N). Zhengzhou is one of the largest cities in central China, with an urbanization rate of over 70%. In recent years, Zhengzhou has experienced particularly significant urban climate change. The warming rate in Zhengzhou City was 2.2 times higher than the global land warming trend (about +0.9°C) from 1981 to 2019, and the heat island effect showed a rapid upward trend after 2000.64 Moreover, Zhengzhou has a temperate monsoon climate with uneven precipitation distribution throughout the year. The precipitation in the flood season (June to September) accounts for approximately 60% of the annual precipitation. Drought often occurs in other seasons. Owing to rapid urbanization and urban climate change, urban meteorological drought disasters have seriously threatened the healthy development of Zhengzhou and become a prominent bottleneck that restricts its further development. Consequently, this results in serious economic losses and threatens urban socio-economic development. Therefore, it is of great significance to select the urban area of Zhengzhou as the research area and study the comprehensive evaluation of its meteorological drought for urban disaster prevention and mitigation.
This study mainly used precipitation and temperature data for analysis. The data were obtained from the National Meteorological Information Center of the China Meteorological Administration (CMA), with a timescale of months and a duration from 2000 to 2019 (http://data.cma.cn/). In addition, the homogeneity and reliability of the meteorological data were checked by CMA before release. Under strict quality control, the data showed good homogeneity.
Drought evaluation index system
Drought indicators are classified into multiple types. Particularly, meteorological indicators serve as the foundation and primary cause of other indicators, transitioning from meteorological drought to other forms of drought.14 Meteorological indicators can prioritize and intuitively reflect the degree of urban meteorological drought. It is particularly important to accurately identify urban meteorological drought. This study started from meteorological indicators of drought. Compared to single-factor indicators, multi-factor indicators are more representative and comprehensive as they can consider various meteorological factors such as precipitation, temperature, and evapotranspiration.25 MI, SPEI, and PDSI have been widely used and validated in various fields such as climatology, hydrology, and environmental science, providing a solid academic foundation that ensures the rationality and effectiveness of the methods.22,23,27,28 Furthermore, the data required for these three indicators are relatively easy to obtain from many meteorological monitoring stations and climate databases, providing a robust data foundation that guarantees the feasibility of the research and the validity of the results. Therefore, considering the mutual influence of climate change, the environment, and human activities, selecting representative multi-factor drought evaluation indicators (MI, SPEI, and PDSI) to establish an urban meteorological drought evaluation indicator system is more reliable.
Relative moisture index (MI)
MI is one of the indicators used to characterize the balance between precipitation and evapotranspiration during a certain period. It evaluates drought conditions based on changes in relative humidity. This indicator reflects the atmospheric water balance during the crop growing season and is suitable for urban environments where air humidity changes are significant. In cities, humidity variations directly affect human activities, health, and comfort. Therefore, MI can help assess the impact of air humidity on urban residents and the environment.
| (Equation 1) |
where MI is the relative moisture at a certain stage; P is the precipitation, mm; PET is the potential evapotranspiration, mm; PET was calculated using the FAO Penman-Monteith or Thornthwaite method. In this study, the Thornthwaite method mainly based on monthly average temperature was used for calculation.85
Standardized precipitation evapotranspiration index (SPEI)
SPEI is an indicator used to characterize the probability of the difference between precipitation and evapotranspiration during a certain period, reflecting the impact of climatic conditions on water resources. In urban environments, especially considering the changes in precipitation patterns that may be brought about by climate change, SPEI can provide more comprehensive drought monitoring information and has good comparability across regions and periods. In 2010, Vicente-Serrano constructed SPEI using the difference between precipitation and evapotranspiration,23 and described its changes using a log-logistic probability distribution function of three parameters. SPEI was obtained by normalization. This indicator is suitable for monitoring and evaluating drought on different temporal scales in semi-arid and semi-humid areas. In this study, the calculation method is as follows: (1) PET is calculated using the Thornthwaite method; (2) the difference between monthly precipitation and potential evapotranspiration is calculated; (3) the difference sequence is accumulated and then fitted using the generalized logistic distribution; (4) the cumulative probability density is standardized to calculate SPEI.
Palmer drought severity index (PDSI)
PDSI represents the degree of deficit in regional actual soil moisture supply during a certain period relative to the suitable moisture supply for the local climate. This indicator is established based on the principle of soil moisture balance, considering factors such as precipitation, evapotranspiration, runoff and effective soil water storage. PDSI is a historical data-driven indicator set against the backdrop of climate change that combines hydrological cycles and soil moisture balance, and it is capable of effectively assessing the persistence and trends of drought. This indicator is applicable to drought monitoring and evaluation at monthly (or above) scales.24 Although the calculation of PDSI is relatively complex, its multi-layered, comprehensive characteristics enable the indicator to effectively reflect meteorological drought conditions in urban areas for extensive drought monitoring. The climate weight coefficient and duration factor of PDSI are fixed values derived from empirical analysis based on the climate characteristics of a specific region. However, using fixed climate weight coefficients and duration factors can lead to problems in their application in other climate zones outside the study area. Thus, Wells et al. suggested obtaining climate weight coefficients and duration factors for specific months at designated locations based on observations at each station.86 This study used a program developed by professional researchers at the University of Nebraska in the United States to calculate the self-calibrated PDSI.
Classification and threshold division of the evaluation index system
The current mature drought evaluation theory divides the degree of drought into five grades. Based on relevant literature data and expert experience,12,87 the established comprehensive evaluation index system for urban meteorological drought is shown in supplemental information.
Meteorological drought comprehensive index
This study employed a composite fuzzy matter element model that combined moment estimation weighting. The characteristic information of indicator data was fully utilized to quantitatively describe the relative grading level of evaluation results. The model can provide a feasible approach for comprehensively evaluating urban meteorological drought.
Composite fuzzy matter element model
Cai proposed the theory of "matter element analysis" to solve incompatible multi-indicator evaluation problems.40 It attempts to formalize problem-solving processes and establish corresponding matter element models. This study combined the theory of "matter element analysis" with the concepts of fuzzy sets and closeness and introduced the moment estimation weighting method for weight calculation. This method can reliably and objectively conduct a comprehensive evaluation analysis of urban meteorological drought. The model construction processes are as follows.
Composite fuzzy element matrix
The three elements of matter element analysis analysis consist of "thing T, feature S, and the corresponding quantity x", V=(T, S, x). If thing T has n features () corresponding to a fuzzy quantity (), it constitutes an n-dimensional composite element V. If the n-dimensional elements of m things are combined, they form a composite fuzzy element, denoted as .
A composite fuzzy matter element matrix, composed of m evaluation things T, e boundary conditions, and n evaluation features S, is comprehensively considered:
| (Equation 2) |
where is the composite fuzzy matter element matrix; is the i-th thing ; e is the sum of the evaluation boundary conditions; is the i-th boundary condition ; is the j-th feature ; is the fuzzy quantity value corresponding to the j-th feature of the i-th thing.
Composite fuzzy matter element matrix with optimal membership degree
Each evaluation indicator body has different calculation formulas for the calculation methods used in scheme evaluation:
The larger the value, the better the type (indicating that as the drought index value increases, the drought severity decreases):
| (Equation 3) |
The smaller the value, the better the type (indicating that as the drought index value decreases, the drought severity decreases):
| (Equation 4) |
where represents the optimal membership degree corresponding to the fuzzy values of each evaluation indicator ; and are the maximum and minimum values of all measurements for each evaluation indicator, respectively.
After transforming the fuzzy values of all evaluation indicators using the above formula, the composite fuzzy matter element matrix with optimal membership degree is constructed as follows:
| (Equation 5) |
Standard fuzzy element and difference square composite fuzzy element matrix
The optimal membership degree of each indicator is the standard fuzzy matter element. In this study, if the optimal membership degree is all 1, then the standard fuzzy matter element is expressed as:
| (Equation 6) |
where represents standard things.
is used to represent the square of the differences between the optimal membership degree fuzzy matter element and the standard fuzzy matter element . The difference square composite fuzzy matter element matrix is obtained:
| (Equation 7) |
where .
European closeness composite fuzzy matter element and fuzzy matter element comprehensive evaluation matrix
The European closeness degree represents the degree of closeness between the evaluated sample and the standard sample. Based on the principle of getting closer to larger values, the quality of the scheme can be evaluated. The Euclidean closeness is calculated by combining the difference square composite fuzzy matter element by the composite fuzzy matter element model with the weight coefficient by the moment estimation weighting model:
| (Equation 8) |
where is the Euclidean closeness of the i-th scheme, which is the composite index; is the weight coefficient, estimated using a moment estimation weighting model in this study; is the difference square composite fuzzy object element.
A comprehensive fuzzy matter element evaluation matrix is constructed:
| (Equation 9) |
where is the fuzzy matter element comprehensive evaluation matrix.
Moment estimation weighting method
Indicator weighting is crucial in determining the rationality of evaluation results and is also a key step in comprehensive evaluation methods. Existing comprehensive weighting methods are all balanced weighting methods that combine subjective or objective weighting advantages, with double effects or subjective shortcomings. Moment estimation is a relatively balanced parameter solving scheme that directly uses the moment of samples as the estimate of the population moment.58 Using the moment estimation method to determine the optimal combination weights of various indicators is more reasonable. Therefore, in this study, the weights determined by AHP, G1, CRITIC and entropy weighting were used as the basic weight matrix. An optimization model for determining the indicator weights was constructed with the objective function of minimizing the deviation between the combination weight and the basic weight.
Subjective weighting method
AHP is a multi-criteria decision-making method that combines qualitative and quantitative approaches. AHP treats a complex multi-objective decision problem as a system and then decomposes it into multiple criteria. By using the fuzzy quantification methods of qualitative indicators, AHP calculates hierarchical rankings and overall rankings to serve as a systematic approach for multi-criteria optimization decision-making.45 The AHP method is used to compare each pair of indicators at the same level. The corresponding scale table is also defined. The judgment matrix is constructed, and consistency tests are conducted. Thus, the AHP indicator weights are determined.
The ordinal relationship analysis method (G1) avoids the assumption that the judgment matrix is difficult to satisfy consistency when using the AHP method.47 Therefore, it does not require consistency testing. By evaluating the order relationship of various indicators at the same level through expert evaluation, the importance ratio of adjacent indicators is rationally assigned. The weight coefficient of G1 is finally determined as .
Objective weighting method
The CRITIC method is an objective weighting method proposed by Diakoulaki.53 The theoretical basis of the CRITIC method includes two aspects. (1) The contrast intensity (degree of variation), which refers to the magnitude of differences in the same indicator. The greater the difference, the greater the information it contains. (2) The conflict between indicators. The weight of each indicator is determined as based on its variability and correlation.
In information theory, entropy is a measure of the degree of disorder in a system. The basic principle of the entropy weighting method is to determine the objective weight of indicators based on the degree of variation of indicator values. It is a systematic analysis method of quantitatively evaluating complex multi-indicator systems, overcoming the irrationality of subjective judgment through the objective weighting method.52 When the degree of variation of a certain indicator in the evaluation object is large, the entropy value is small. This indicates that the indicator provides a large amount of effective information and occupies a larger weight in the comprehensive evaluation; otherwise, it occupies a smaller weight. By standardizing the indicators, the entropy value of the evaluation indicators is determined. Finally, the entropy weight of the evaluation indicators is calculated as .
Moment estimation weighting method
To combine the advantages of subjective and objective weighting methods, the four weight vectors mentioned above are integrated based on the moment estimation weighting method to obtain a comprehensive weight vector . Let be the subjective weight set consisting of the weights by AHP and G1; Let be the weight set consisting of the weights by CRITIC and the entropy weight method. Each subjective and objective weight vector must satisfy non-negativity and be normalized.
To obtain the optimal weight vector , it is necessary to ensure that its deviation from the four weight vectors is as small as possible. The proportions of subjective and objective weights vary under different attribute evaluation objectives α and β. To represent the relevant importance coefficients of subjective and objective weights, the objective function of optimal weight combination is:
| (Equation 10) |
where . The solution steps are as follows:
Step 1. According to the basic idea of the moment estimation weighting method,88 the expected values of indicator sets and are calculated:
| (Equation 11) |
Step 2. The relevant importance coefficients of subjective and objective indicators are calculated:
| (Equation 12) |
Step 3. For each evaluation indicator, it can be regarded as extracting n samples from two populations separately. According to the theory of moment estimation weighting, we can obtain:
| (Equation 13) |
Step 4. For each evaluation indicator, the smaller the objective function , the better. The objective function can be transformed into:
| (Equation 14) |
where .
Step 5. By linearly weighting the above equation, we can obtain:
| (Equation 15) |
where .
Step 6. Using the Lagrange multiplier method to solve the objective function, the optimal combination weight for each evaluation indicator is obtained:
| (Equation 16) |
Urban meteorological drought comprehensive index
Subjective weighting methods (AHP and GI) and objective weighting methods (CRITIC and entropy weight) were used to construct a moment estimation weighting model in order to obtain weights for the composite mathematical model. Subsequently, a composite fuzzy matter element model was employed to convert multiple meteorological drought indicators (MI, SPEI, PDSI) and meteorological drought evaluation standards (ranging from no drought to extreme drought) into comprehensive indicators and comprehensive indicator standards. In this study, the CFEMCI was proposed. The process framework is shown in supplemental information. The calculation steps for the composite index are as follows:
Step 1. Calculating the subjective and objective weights for MI, SPEI, and PDSI, as shown in supplemental information.
Step 2. Calculating the optimal combination weights for MI, SPEI, and PDSI from the above results using Equations 10, 11, 12, 13, 14, 15, and 16.
Step 3. Constructing the fuzzy matter element comprehensive evaluation matrix using Equations 2, 3, 4, 5, 6, 7, 8, and 9 with 240 evaluation objects (2000–2019), 4 boundary conditions (cutoff values from no drought to extreme drought), and 3 evaluation features (MI, SPEI, PDSI).
Step 4. Substituting the optimal combination weights from Step 2 into the fuzzy matter-element comprehensive evaluation matrix from Step 3 to obtain the comprehensive indicator (CFEMCI) and the corresponding standards (cutoff values from no drought to extreme drought).
The rationality of the comprehensive index
In order to verify the rationality of the constructed CFEMCI, this study used the run length theory to calculate drought characteristic variables such as drought duration and severity for the meteorological drought index and the comprehensive index. Then, quantitative analysis methods were used to compare the rationality between the meteorological drought index system and the comprehensive index.
Run theory
Based on the run theory, drought events in the drought index time series can be identified.89 Drought characteristic variables, such as drought duration and severity, can be calculated to reveal basic drought attributes.90 The commonly used single threshold method may cause a relatively severe drought event to be divided into multiple relatively moderate drought events. This can underestimate drought severity and result in low recognition accuracy. Considering that drought only has a greater impact at a certain threshold, only a single truncation level was set to avoid inaccurate identification of drought events.91 This study utilized the optimization operation theory to separate drought duration (time from occurrence to end) and severity (absolute value of cumulative drought index values during drought events) from the drought index time series. According to the Chinese meteorological drought classification standard and related studies, the drought index values were classified into three truncation levels, i.e., X0, X1, and X2.69,92,93,94.
-
(1)
When the calculated drought index value is less than X1, it is preliminarily determined that a drought event has occurred in this month.
-
(2)
When the drought duration is only one month and the calculated drought index is greater than X2, (i.e., when the severity does not reach the drought threshold X2), it is determined that no drought events have occurred in this month and therefore were removed.
-
(3)
If the time interval between two adjacent drought events is only one month, and the corresponding drought index value for that month is less than X0, these two drought events can be combined into one drought event. The drought duration and severity are the sum of the durations and severities of adjacent drought events, respectively. Otherwise, they are taken as two independent drought events.
Evaluation metrics
In order to better quantify and compare CFEMCI with MI, SPEI, and PDSI, this study used the SPSS software to perform correlation coefficient (CC) analysis. The accuracy of CFEMCI was thus evaluated. CC was used to evaluate the degree of correlation of CFEMCI with MI, SPEI, and PDSI. In order to analyze the applicability of CFEMCI in detecting drought events, four indicators were used: probability of detection (POD), critical success index (CSI), false alarm rate (FAR) and failure rate (FR). These indicators were used to demonstrate the ability of CFEMCI to correctly capture drought events as calculated by MI, SPEI, and PDSI.95,96,97 POD describes the proportion of drought events occurring in MI, SPEI, and PDSI correctly detected by CFEMCI. CSI describes the overall performance of CFEMCI in determining the correct detection of drought events. FAR describes the proportion of drought events that are detected by CFEMCI but do not actually occur. FR describes the proportion of drought events that are not detected by CFEMCI but occur. The calculation equations for the above indicators are shown in supplemental information.
Note: n is the length of the sequence in the sample; Xi and Yi represent the i-th CFEMCI and one of
the three meteorological drought indices, respectively; and are the corresponding sample averages; TURE is the number of drought events simultaneously detected by CFEMCI and the meteorological drought index; FALSE is the number of drought events detected by CFEMCI but not by the meteorological drought index; MISS is the number of drought events detected by the meteorological drought index but not by CFEMCI.
Test on the trend of the comprehensive index
The traditional Mann-Kendall (MK) trend test is currently the main method for trend detection in meteorology and hydrology. This test is a non-parametric method used to identify the trend characteristics of time series.98 For a given significance level , when the testing statistic , it indicates a significant changing trend; when , it indicates an insignificant changing trend. However, due to the autocorrelation of the time series, the significance of the results obtained by traditional MK methods is affected. Thus, this study used a modified Mann-Kendall (MMK) trend test method to eliminate the autocorrelation of the time series and improve the detection ability of the MK method.99 The temporal trend of drought in Zhengzhou City from 2000 to 2019 was identified.100 For a time series , the MK trend statistic S is expressed as:
| (Equation 17) |
where
| (Equation 18) |
The variance of S is expressed as:
| (Equation 19) |
The significance of the time series trend Z is tested by Z:
| (Equation 20) |
Then, autocorrelation coefficients ( at lag (i)), which are significantly different from zero at the level of 0.05, are used to estimate the modified variance () of S:
| (Equation 21) |
where Cor represents a correction factor considering the autocorrelation within the time series:
| (Equation 22) |
Quantification and statistical analysis
There are no quantification or statistical analyses to include in this study.
Published: August 23, 2024
Footnotes
Supplemental information can be found online at https://doi.org/10.1016/j.isci.2024.110798.
Supplemental information
References
- 1.Corey L., Pedram R., Navin R. Influence of extreme weather disasters on global crop production. Nature. 2016;529:84–87. doi: 10.1038/nature16467. [DOI] [PubMed] [Google Scholar]
- 2.Amir A., David F., Martin H., Travis H., Jay L. Water and climate: Recognize anthropogenic drought. Nature. 2015;524:409–411. doi: 10.1038/524409a. [DOI] [PubMed] [Google Scholar]
- 3.Li Y., Luo L., chang J., Wang Y., Guo A., Fan J., Liu Q. Hydrological drought evolution with a nonlinear joint index in regions with significant changes in underlying surface. J. Hydrol. 2020;585 doi: 10.1016/j.jhydrol.2020.124794. [DOI] [Google Scholar]
- 4.Philip S., Kew S.F., Van Oldenborgh G.J., Otto F., O'Keefe S., Haustein K., King A., Zegeye A., Eshetu Z., Hailemariam K. Attribution analysis of the Ethiopian drought of 2015. J. Clim. 2017;31:2465–2486. doi: 10.1175/JCLI-D-17-0274.1. [DOI] [Google Scholar]
- 5.Uhe P., Philip S., Kew S., Shah K., Kimutai J., Mwangi E., van Oldenborgh G.J., Singh R., Arrighi J., Jjemba E., et al. Attributing drivers of the 2016 Kenyan drought. Int. J. Climatol. 2018;38:e554–e568. doi: 10.1002/joc.5389. [DOI] [Google Scholar]
- 6.Msg A., Ifdac A., Gvmb C. 2019/2020 drought impacts on South America and atmospheric and oceanic influences. Weather Clim. Extrem. 2021;34 doi: 10.1016/j.wace.2021.100404. [DOI] [Google Scholar]
- 7.Haile G.G., Tang Q., Li W., Liu X., Zhang X. Drought: Progress in broadening its understanding. WIREs Water. 2020;7 doi: 10.1002/wat2.1407. [DOI] [Google Scholar]
- 8.Huang S., Wang L., Wang H., Huang Q., Leng G., Fang W., Zhang Y. Spatio-temporal characteristics of drought structure across China using an integrated drought index. Agric. Water Manag. 2019;218:182–192. doi: 10.1016/j.agwat.2019.03.053. [DOI] [Google Scholar]
- 9.Lloyd-Hughes B. The impracticality of a universal drought definition. Theor. Appl. Climatol. 2014;117:607–611. doi: 10.1007/s00704-013-1025-7. [DOI] [Google Scholar]
- 10.Zhang X., Hao Z., Singh V.P., Zhang Y., Feng S., Xu Y., Hao F. Drought propagation under global warming: Characteristics, approaches, processes, and controlling factors. Sci. Total Environ. 2022;838 doi: 10.1016/j.scitotenv.2022.156021. [DOI] [PubMed] [Google Scholar]
- 11.Wilhite D.A., Glantz M.H. Understanding: the Drought Phenomenon: The Role of Definitions. Water Int. 1985;10:111–120. doi: 10.1080/02508068508686328. [DOI] [Google Scholar]
- 12.Mishra A.K., Singh V.P. A review of drought concepts. J. Hydrol. 2010;391:202–216. doi: 10.1016/j.jhydrol.2010.07.012. [DOI] [Google Scholar]
- 13.Liu Y., Shan F., Yue H., Wang X., Fan Y. Global analysis of the correlation and propagation among meteorological, agricultural, surface water, and groundwater droughts. J. Environ. Manag. 2023;333 doi: 10.1016/j.jenvman.2023.117460. [DOI] [PubMed] [Google Scholar]
- 14.Sun H., Sun X., Chen J., Deng X., Yang Y., Qin H., Chen F., Zhang W. Different types of meteorological drought and their impact on agriculture in Central China. J. Hydrol. 2023;627 doi: 10.1016/j.jhydrol.2023.130423. [DOI] [Google Scholar]
- 15.Shi H., Zhou Z., Liu L., Liu S. A global perspective on propagation from meteorological drought to hydrological drought during 1902–2014. Atmos. Res. 2022;280 doi: 10.1016/j.atmosres.2022.106441. [DOI] [Google Scholar]
- 16.Guo E., Liu X., Zhang J., Wang Y., Wang C., Wang R., Li D. Assessing spatiotemporal variation of drought and its impact on maize yield in Northeast China. J. Hydrol. 2017;553:231–247. doi: 10.1016/j.jhydrol.2017.07.060. [DOI] [Google Scholar]
- 17.Heim R.R., Jr. A review of twentieth-century drought indices used in the United States. Bull. Am. Meteorol. Soc. 2002;83:1149–1166. doi: 10.1175/1520-0477-83.8.1149. [DOI] [Google Scholar]
- 18.Mukherjee S., Mishra A., Trenberth K.E. Climate change and drought: a perspective on drought indices. Curr. Clim. Change Rep. 2018;4:145–163. doi: 10.1007/s40641-018-0098-x. [DOI] [Google Scholar]
- 19.Mo C., Ruan Y., He J., Jin J., Liu P., Sun G. Frequency analysis of precipitation extremes under climate change. Int. J. Climatol. 2019;39:1373–1387. doi: 10.1002/joc.5887. [DOI] [Google Scholar]
- 20.Marra F., Nikolopoulos E.I., Anagnostou E.N., Bárdossy A., Morin E. Precipitation frequency analysis from remotely sensed datasets: A focused review. J. Hydrol. 2019;574:699–705. doi: 10.1016/j.jhydrol.2019.04.081. [DOI] [Google Scholar]
- 21.McKee T.B., Doesken N.J., Kleist J. The relationship of drought frequency and duration to time scales. Proceedings of the 8th Conference on Applied Climatology. 1993;17:179–183. [Google Scholar]
- 22.Wu Y., Bake B., Zhang J., Rasulov H. Spatio-temporal patterns of drought in North Xinjiang, China, 1961–2012 based on meteorological drought index. J. Arid Land. 2015;7:527–543. doi: 10.1007/s40333-015-0125-x. [DOI] [Google Scholar]
- 23.Vicente-Serrano S.M., Beguería S., López-Moreno J.I. A multiscalar drought index sensitive to global warming: the standardized precipitation evapotranspiration index. J. Clim. 2010;23:1696–1718. doi: 10.1175/2009JCLI2909.1. [DOI] [Google Scholar]
- 24.Palmer W.C. Vol. 30. US Department of Commerce, Weather Bureau; 1965. (Meteorological Drought). [Google Scholar]
- 25.Li W., Duan L., Wang W., Wu Y., Liu T., Quan Q., Chen X., Yin H., Zhou Q. Spatiotemporal characteristics of drought in a semi-arid grassland over the past 56 years based on the Standardized Precipitation Index. Meteorol. Atmos. Phys. 2021;133:41–54. doi: 10.1007/s00703-020-00727-4. [DOI] [Google Scholar]
- 26.Tsakiris G. Drought risk assessment and management. Water Resour. Manag. 2017;31:3083–3095. doi: 10.1007/s11269-017-1698-2. [DOI] [Google Scholar]
- 27.Choi M., Jacobs J.M., Anderson M.C., Bosch D.D. Evaluation of drought indices via remotely sensed data with hydrological variables. J. Hydrol. 2013;476:265–273. doi: 10.1016/j.jhydrol.2012.10.042. [DOI] [Google Scholar]
- 28.Soh Y.W., Koo C.H., Huang Y.F., Fung K.F. Application of artificial intelligence models for the prediction of standardized precipitation evapotranspiration index (SPEI) at Langat River Basin, Malaysia. Comput. Electron. Agric. 2018;144:164–173. doi: 10.1016/j.compag.2017.12.002. [DOI] [Google Scholar]
- 29.Ma M., Ren L., Singh V.P., Tu X., Jiang S., Liu Y. Evaluation and application of the SPDI-JDI for droughts in Texas, USA. J. Hydrol. 2015;521:34–45. doi: 10.1016/j.jhydrol.2014.11.074. [DOI] [Google Scholar]
- 30.Murthy C.S., Singh J., Kumar P., Sesha Sai M.V.R. A composite index for drought hazard assessment using CPC rainfall time series data. Int. J. Environ. Sci. Technol. 2017;14:1981–1988. doi: 10.1007/s13762-017-1278-2. [DOI] [Google Scholar]
- 31.Karamouz M., Rasouli K., Nazif S. Development of a Hybrid Index for Drought Prediction: Case Study. J. Hydrol. Eng. 2009;14:617–627. doi: 10.1061/(ASCE)HE.1943-5584.0000022. [DOI] [Google Scholar]
- 32.Hao Z., AghaKouchak A. Multivariate Standardized Drought Index: A parametric multi-index model. Adv. Water Resour. 2013;57:12–18. doi: 10.1016/j.advwatres.2013.03.009. [DOI] [Google Scholar]
- 33.Li J., Li Y., Yin L., Zhao Q. A novel composite drought index combining precipitation, temperature and evapotranspiration used for drought monitoring in the Huang-Huai-Hai Plain. Agric. Water Manag. 2024;291 doi: 10.1016/j.agwat.2023.108626. [DOI] [Google Scholar]
- 34.Liu Y., Yu X., Dang C., Yue H., Wang X., Niu H., Zu P., Cao M. A dryness index TSWDI based on land surface temperature, sun-induced chlorophyll fluorescence, and water balance. ISPRS J. Photogrammetry Remote Sens. 2023;202:581–598. doi: 10.1016/j.isprsjprs.2023.07.005. [DOI] [Google Scholar]
- 35.Keyantash J.A., Dracup J.A. An aggregate drought index: Assessing drought severity based on fluctuations in the hydrologic cycle and surface water storage. Water Resour. Res. 2004;40:9. doi: 10.1029/2003WR002610. [DOI] [Google Scholar]
- 36.Rajsekhar D., Singh V.P., Mishra A.K. Multivariate drought index: An information theory based approach for integrated drought assessment. J. Hydrol. 2015;526:164–182. doi: 10.1016/j.jhydrol.2014.11.031. [DOI] [Google Scholar]
- 37.Bravo R.Z.B., Cunha A.P.M.d.A., Leiras A., Cyrino Oliveira F.L. A new approach for a drought composite index. Nat. Hazards. 2021;108:755–773. doi: 10.1007/s11069-021-04704-x. [DOI] [Google Scholar]
- 38.Shin H.-S., Salas J.D. Regional Drought Analysis Based on Neural Networks. J. Hydrol. Eng. 2000;5:145–155. doi: 10.1061/(ASCE)1084-0699(2000)5:2(145). [DOI] [Google Scholar]
- 39.Kao S.-C., Govindaraju R.S. A copula-based joint deficit index for droughts. J. Hydrol. 2010;380:121–134. doi: 10.1016/j.jhydrol.2009.10.029. [DOI] [Google Scholar]
- 40.Cai W. Science and Technology Literature Press; 1994. Matter-element Model and its Application; pp. 267–275. [Google Scholar]
- 41.Ng D.K.W., Cai W. Treating non-compatibility problem from matter element analysis to extenics. SIGICE Bull. 1997;22:2–9. doi: 10.1145/270524.270527. [DOI] [Google Scholar]
- 42.Deng X., Xu Y., Han L., Yu Z., Yang M., Pan G. Assessment of river health based on an improved entropy-based fuzzy matter-element model in the Taihu Plain, China. Ecol. Indicat. 2015;57:85–95. doi: 10.1016/j.ecolind.2015.04.020. [DOI] [Google Scholar]
- 43.Shan C., Dong Z., Lu D., Xu C., Wang H., Ling Z., Liu Q. Study on river health assessment based on a fuzzy matter-element extension model. Ecol. Indicat. 2021;127 doi: 10.1016/j.ecolind.2021.107742. [DOI] [Google Scholar]
- 44.Wu J., Lin X., Wang M., Peng J., Tu Y. Assessing Agricultural Drought Vulnerability by a VSD Model: A Case Study in Yunnan Province, China. Sustainability. 2017;9:918. doi: 10.3390/su9060918. [DOI] [Google Scholar]
- 45.Saaty T.L. A scaling method for priorities in hierarchical structures. J. Math. Psychol. 1977;15:234–281. doi: 10.1016/0022-2496(77)90033-5. [DOI] [Google Scholar]
- 46.Palchaudhuri M., Biswas S. Application of AHP with GIS in drought risk assessment for Puruliya district, India. Nat. Hazards. 2016;84:1905–1920. doi: 10.1007/s11069-016-2526-3. [DOI] [Google Scholar]
- 47.Guo Y., Pan D. A New method of the multiple-attributive evaluation. Syst. Eng. Theor. Pract. 1994;9:58–62. [Google Scholar]
- 48.Moody P.E. McGraw-Hill Companies; 1983. Decision Making: Proven Methods for Better Decisions. [Google Scholar]
- 49.Hasekioğulları G.D., Ercanoglu M. A new approach to use AHP in landslide susceptibility mapping: a case study at Yenice (Karabuk, NW Turkey) Nat. Hazards. 2012;63:1157–1179. doi: 10.1007/s11069-012-0218-1. [DOI] [Google Scholar]
- 50.Yuan X.C., Wang Q., Wang K., Wang B., Jin J.L., Wei Y.M. China’s regional vulnerability to drought and its mitigation strategies under climate change: data envelopment analysis and analytic hierarchy process integrated approach. Mitig. Adapt. Strategies Glob. Change. 2015;20:341–359. doi: 10.1007/s11027-013-9494-7. [DOI] [Google Scholar]
- 51.Su G., Jia B., Wang P., Zhang R., Shen Z. Risk identification of coal spontaneous combustion based on COWA modified G1 combination weighting cloud model. Sci. Rep. 2022;12:2992. doi: 10.1038/s41598-022-06972-4. [DOI] [PMC free article] [PubMed] [Google Scholar]
- 52.Shannon C.E. A mathematical theory of communication. The Bell system technical journal. 1948;27:379–423. [Google Scholar]
- 53.Diakoulaki D., Mavrotas G., Papayannakis L. Determining objective weights in multiple criteria problems: The critic method. Comput. Oper. Res. 1995;22:763–770. doi: 10.1016/0305-0548(94)00059-H. [DOI] [Google Scholar]
- 54.Yi F., Li C., Feng Y. Two precautions of entropy-weighting model in drought-risk assessment. Nat. Hazards. 2018;93:339–347. doi: 10.1007/s11069-018-3303-2. [DOI] [Google Scholar]
- 55.Yang S., He J. Analysis of digital economy development based on AHP-Entropy weight method. J. Sens. 2022;2022:1–8. doi: 10.1155/2022/7642682. [DOI] [Google Scholar]
- 56.Xiao K., Tamborski J., Wang X., Feng X., Wang S., Wang Q., Lin D., Li H. A coupling methodology of the analytic hierarchy process and entropy weight theory for assessing coastal water quality. Environ. Sci. Pollut. Res. Int. 2022;29:31217–31234. doi: 10.1007/s11356-021-17247-2. [DOI] [PubMed] [Google Scholar]
- 57.Ye F., Sun J., Wang Y., Nedjah N., Bu W. A novel method for the performance evaluation of institutionalized collaborative innovation using an improved G1-CRITIC comprehensive evaluation model. J. Innov. Knowledge. 2023;8 doi: 10.1016/j.jik.2022.100289. [DOI] [Google Scholar]
- 58.Pearson K. Method of Moments and Method of Maximum Likelihood. Biometrika. 1936;28:34–59. doi: 10.2307/2334123. [DOI] [Google Scholar]
- 59.Xu L., Chen N., Yang C., Zhang C., Yu H. A parametric multivariate drought index for drought monitoring and assessment under climate change. Agric. For. Meteorol. 2021;310 doi: 10.1016/j.agrformet.2021.108657. [DOI] [Google Scholar]
- 60.Lu J., Jia L., Zhou J. Vol. 9808. SPIE; 2015. Characterization of 2014 summer drought over Henan province using remotely sensed data; pp. 308–316. (International Conference on Intelligent Earth Observing and Applications). [DOI] [Google Scholar]
- 61.Lu J., Carbone G.J., Gao P. Mapping the agricultural drought based on the long-term AVHRR NDVI and North American Regional Reanalysis (NARR) in the United States, 1981-2013. Appl. Geogr. 2019;104:10–20. doi: 10.1016/j.apgeog.2019.01.005. [DOI] [Google Scholar]
- 62.Rhee J., Im J., Carbone G.J. Monitoring agricultural drought for arid and humid regions using multi-sensor remote sensing data. Remote Sens. Environ. 2010;114:2875–2887. doi: 10.1016/j.rse.2010.07.005. [DOI] [Google Scholar]
- 63.Ai P., Chen B., Yuan D., Hong M., Liu H. Dynamic risk assessment of drought disaster: a case study of Jiangxi Province, China. J. Water Clim. Chang. 2021;12:1761–1777. doi: 10.2166/wcc.2020.141. [DOI] [Google Scholar]
- 64.Li H., Jombach S., Tian G., Li Y., Meng H. Characterizing Temporal Dynamics of Urban Heat Island in a Rapidly Expanding City: A 39 Years Study in Zhengzhou, China. Land. 2022;11:1838. doi: 10.3390/land11101838. [DOI] [Google Scholar]
- 65.Hao H., Zhu H., Wang F. Regional agricultural drought risk assessment based on attribute interval identification: a study from Zhengzhou, China. Water Supply. 2022;22:5309–5330. doi: 10.2166/ws.2022.177. [DOI] [Google Scholar]
- 66.Yao J.B., Liu J.H., Ma H.J., Pan H.W. DROUGHT ANALYSIS BASED ON THE INFORMATION DIFFUSION AND FRACTAL TECHNOLOGY: A CASE STUDY OF WINTER WHEAT IN CHINA. Appl. Eng. Agric. 2020;36:869–877. doi: 10.13031/aea.13829. [DOI] [Google Scholar]
- 67.Hu Y., Wang H., Guo Y. Research on the characteristics of disaster-causing precipitation in Zhengzhou urban area based on web crawler and IDF curve. Water Resour. Power. 2021;39:4–7. [Google Scholar]
- 68.Zhang J., Li G., Zang H., Zhang J., Zhao Q., Chen D., Wang M., Zheng G. 2022. Water Supply and Demand Changes and Spatial-Temporal Distribution Characteristics of Summer Peanut in Henan Province. [Google Scholar]
- 69.Hao Z., AghaKouchak A. A nonparametric multivariate multi-index drought monitoring framework. J. Hydrometeorol. 2014;15:89–101. doi: 10.1175/JHM-D-12-0160.1. [DOI] [Google Scholar]
- 70.Li M., Chu R., Islam A.R.M.T. A New Drought Fluorescence Monitoring Index Established for Detecting Drought Evolution Characteristics in the Middle and Lower Reaches of the Yangtze River, China During 2001–2020. IEEE Trans. Geosci. Rem. Sens. 2023;61:1–13. doi: 10.1109/TGRS.2023.3290239. [DOI] [Google Scholar]
- 71.Hua L.J., Ma Z.G., Guo W.D. The impact of urbanization on air temperature across China. Theor. Appl. Climatol. 2008;93:179–194. doi: 10.1007/s00704-007-0339-8. [DOI] [Google Scholar]
- 72.Zhao H., Zhang H., Miao C., Ye X., Min M. Linking Heat Source–Sink Landscape Patterns with Analysis of Urban Heat Islands: Study on the Fast-Growing Zhengzhou City in Central China. Rem. Sens. 2018;10:1268. doi: 10.3390/rs10081268. [DOI] [Google Scholar]
- 73.Yu Z., Yao Y., Yang G., Wang X., Vejre H. Spatiotemporal patterns and characteristics of remotely sensed region heat islands during the rapid urbanization (1995–2015) of Southern China. Sci. Total Environ. 2019;674:242–254. doi: 10.1016/j.scitotenv.2019.04.088. [DOI] [PubMed] [Google Scholar]
- 74.Pedro-Monzonís M., Solera A., Ferrer J., Estrela T., Paredes-Arquiola J. A review of water scarcity and drought indexes in water resources planning and management. J. Hydrol. 2015;527:482–493. doi: 10.1016/j.jhydrol.2015.05.003. [DOI] [Google Scholar]
- 75.Kahil M.T., Dinar A., Albiac J. Modeling water scarcity and droughts for policy adaptation to climate change in arid and semiarid regions. J. Hydrol. 2015;522:95–109. doi: 10.1016/j.jhydrol.2014.12.042. [DOI] [Google Scholar]
- 76.Van Loon A.F., Van Lanen H.A.J. Making the distinction between water scarcity and drought using an observation-modeling framework. Water Resour. Res. 2013;49:1483–1502. doi: 10.1002/wrcr.20147. [DOI] [Google Scholar]
- 77.Kummu M., Guillaume J.H.A., de Moel H., Eisner S., Flörke M., Porkka M., Siebert S., Veldkamp T.I.E., Ward P.J. The world’s road to water scarcity: shortage and stress in the 20th century and pathways towards sustainability. Sci. Rep. 2016;6 doi: 10.1038/srep38495. [DOI] [PMC free article] [PubMed] [Google Scholar]
- 78.Mo K.C., Lettenmaier D.P. Heat wave flash droughts in decline. Geophys. Res. Lett. 2015;42:2823–2829. doi: 10.1002/2015GL064018. [DOI] [Google Scholar]
- 79.Liu X., Liu Y., Wang Y., Liu Z. Evaluating potential impacts of land use changes on water supply–demand under multiple development scenarios in dryland region. J. Hydrol. 2022;610 doi: 10.1016/j.jhydrol.2022.127811. [DOI] [Google Scholar]
- 80.Pulwarty R.S., Sivakumar M.V. Information systems in a changing climate: Early warnings and drought risk management. Weather Clim. Extrem. 2014;3:14–21. doi: 10.1016/j.wace.2014.03.005. [DOI] [Google Scholar]
- 81.Cravens A.E., Henderson J., Friedman J., Burkardt N., Cooper A.E., Haigh T., Hayes M., McEvoy J., Paladino S., Wilke A.K., Wilmer H. A typology of drought decision making: Synthesizing across cases to understand drought preparedness and response actions. Weather Clim. Extrem. 2021;33 doi: 10.1016/j.wace.2021.100362. [DOI] [Google Scholar]
- 82.Yin Q., Shi X., Xiong S., Qu Y., Zhou Y., Liu J., Jia Z., Ma L. Selection of Water-Saving Plants and Annual Water Consumption Estimation for Garden Green Spaces in Beijing. Forests. 2021;12:1572. doi: 10.3390/f12111572. [DOI] [Google Scholar]
- 83.Jones V., Whitehouse S., McEwen L., Williams S., Gorell Barnes L. Promoting Water Efficiency and Hydrocitizenship in Young People’s Learning about Drought Risk in a Temperate Maritime Country. Water. 2021;13:2599. doi: 10.3390/w13182599. [DOI] [Google Scholar]
- 84.Kasprzyk M., Szpakowski W., Poznańska E., Boogaard F.C., Bobkowska K., Gajewska M. Technical solutions and benefits of introducing rain gardens – Gdańsk case study. Sci. Total Environ. 2022;835 doi: 10.1016/j.scitotenv.2022.155487. [DOI] [PubMed] [Google Scholar]
- 85.Thornthwaite C.W. An Approach toward a Rational Classification of Climate. Geogr. Rev. 1948;38:55–94. doi: 10.2307/210739. [DOI] [Google Scholar]
- 86.Wells N., Goddard S., Hayes M.J. A self-calibrating Palmer drought severity index. J. Clim. 2004;17:2335–2351. doi: 10.1175/1520-0442(2004)017<2335:ASPDSI>2.0.CO;2. [DOI] [Google Scholar]
- 87.Zargar A., Sadiq R., Naser B., Khan F.I. A review of drought indices. Environ. Rev. 2011;19:333–349. doi: 10.1139/a11-013. [DOI] [Google Scholar]
- 88.Wooldridge J.M. Applications of generalized method of moments estimation. J. Econ. Perspect. 2001;15:87–100. doi: 10.1257/jep.15.4.87. [DOI] [Google Scholar]
- 89.Yevjevich V.M. Colorado State University Fort Collins, CO, USA; 1967. Objective approach to definitions and investigations of continental hydrologic droughts, An. Hydrology papers no. 23. [Google Scholar]
- 90.Chang J., Li Y., Wang Y., Yuan M. Copula-based drought risk assessment combined with an integrated index in the Wei River Basin, China. J. Hydrol. 2016;540:824–834. doi: 10.1016/j.jhydrol.2016.06.064. [DOI] [Google Scholar]
- 91.He J., Yang X., Li Z., Zhang X., Tang Q. Spatiotemporal variations of meteorological droughts in China during 1961–2014: An investigation based on multi-threshold identification. Int. J. Disaster Risk Sci. 2016;7:63–76. doi: 10.1007/s13753-016-0083-8. [DOI] [Google Scholar]
- 92.Wu J., Chen X., Yao H., Gao L., Chen Y., Liu M. Non-linear relationship of hydrological drought responding to meteorological drought and impact of a large reservoir. J. Hydrol. 2017;551:495–507. doi: 10.1016/j.jhydrol.2017.06.029. [DOI] [Google Scholar]
- 93.Guo Y., Huang S., Huang Q., Wang H., Wang L., Fang W. Copulas-based bivariate socioeconomic drought dynamic risk assessment in a changing environment. J. Hydrol. 2019;575:1052–1064. doi: 10.1016/j.jhydrol.2019.06.010. [DOI] [Google Scholar]
- 94.Wang F., Wang Z., Yang H., Di D., Zhao Y., Liang Q., Hussain Z. Comprehensive evaluation of hydrological drought and its relationships with meteorological drought in the Yellow River basin, China. J. Hydrol. 2020;584 doi: 10.1016/j.jhydrol.2020.124751. [DOI] [Google Scholar]
- 95.Halwatura D., McIntyre N., Lechner A.M., Arnold S. Capability of meteorological drought indices for detecting soil moisture droughts. J. Hydrol.: Reg. Stud. 2017;12:396–412. doi: 10.1016/j.ejrh.2017.06.001. [DOI] [Google Scholar]
- 96.Ma Z., Xu J., Zhu S., Yang J., Tang G., Yang Y., Shi Z., Hong Y. AIMERG: a new Asian precipitation dataset (0.1°/half-hourly, 2000–2015) by calibrating the GPM-era IMERG at a daily scale using APHRODITE. Earth Syst. Sci. Data. 2020;12:1525–1544. doi: 10.5194/essd-12-1525-2020. [DOI] [Google Scholar]
- 97.Das P.K., Mohinuddin S.K., Midya S.K., Das D.K., Sharma R., Bandyopadhyay S. Can multiscalar meteorological drought indices detect soil moisture droughts? A study of Indian regions. Hydrol. Sci. J. 2021;66:1475–1487. doi: 10.1080/02626667.2021.1942475. [DOI] [Google Scholar]
- 98.Mitchell J., Dzerdzeevskii B., Flohn H., Hofmeyr W., Lamb H., Rao K., Wallen C. World Meteorological Organization; 1966. Climate Change, WMO Technical Note No. 79; pp. 79–83. [DOI] [Google Scholar]
- 99.Hamed K.H., Ramachandra Rao A. A modified Mann-Kendall trend test for autocorrelated data. J. Hydrol. 1998;204:182–196. doi: 10.1016/S0022-1694(97)00125-X. [DOI] [Google Scholar]
- 100.Guo Y., Huang S., Huang Q., Wang H., Fang W., Yang Y., Wang L. Assessing socioeconomic drought based on an improved Multivariate Standardized Reliability and Resilience Index. J. Hydrol. 2019;568:904–918. doi: 10.1016/j.jHydrol.2018.11.055. [DOI] [Google Scholar]
Associated Data
This section collects any data citations, data availability statements, or supplementary materials included in this article.
Supplementary Materials
Data Availability Statement
-
•
DATA: All datasets used in this study are publicly available: Monthly precipitation and temperature data used in this study were obtained from the China Meteorological Administration (http://data.cma.cn/).
-
•
CODE: This article does not report original code.
-
•
Any additional information required to reanalyze the data reported in this article is available from the lead contact upon request.