Abstract
NK cells traffic through the blood and mount cytolytic and interferon γ (IFNγ) focused responses to intracellular pathogens and tumors. Type 1 innate lymphoid cells (ILC1s) also produce type 1 cytokines but reside in tissues and are not cytotoxic. Whether these differences reflect discrete lineages or distinct states of a common cell type is not understood. Using single-cell RNA-sequencing and flow cytometry, we focused on populations of TCF7+ cells that contained precursors for NK cells and ILC1 and identified a subset of bone marrow lineage (Lin)–NK receptor– cells that expressed the transcription factor Eomes, termed EomeshiNKneg. Transfer of EomeshiNKneg cells into Rag2−/−IL2rg−/− recipients generated functional NK cells capable of preventing metastatic disease. In contrast, transfer of PLZF+ ILCP generated a mixture of ILC1, ILC2 and ILC3 that lacked cytotoxic potential. These findings identified EomeshiNKneg cells as the bone marrow precursor to classical NK cells and demonstrated that the NK and ILC1 lineages diverged early during development.
Natural killer (NK) cells were discovered based on their ability to kill tumor cells without prior priming and were considered the only innate lymphocyte population1. The identification of innate lymphoid cells (ILCs), including the subsets ILC1, ILC2 and ILC3, which produce type 1, type 2 and type 17 cytokines, respectively, broadened the pool of innate lymphocytes and spurred interest in understanding how they each contribute to immunity2, 3. NK cells and ILC1s are both CD3ε−NKp46+NK1.1+ type 1 effectors that express the transcription factor Tbet and release IFNγ when exposed to diverse stimuli, ranging from infection to malignancy4, 5, 6, 7. On the other hand, NK cells and ILC1s differ in developmental kinetics, anatomic localization and mode of activation. Specifically, NK cells develop after birth, while ILC1s are produced throughout fetal and post-natal life. NK cells primarily circulate in the blood, while ILC1s reside in tissues, including the liver, intestine, spleen, thymus and salivary glands.8, 9, 10, 11. Further, NK cells are short-lived cytolytic effectors that express receptors from the Ly49 family, while ILC1 are long-lived, minimally cytotoxic cells without Ly49 receptor expression12, 13. However, tissue-resident NK cells and cytotoxic ILC1s that challenge this paradigm have been reported9, 10, which highlights the need to clarify the developmental relationships between NK cells and ILC1s.
NK cell and ILC1 development proceeds through the common lymphoid progenitor (CLP) towards a more NK/ILC-restricted intermediate. BM progenitors, such as CLP, α-lymphoid precursor (αLP) and early innate lymphoid cell progenitor (EILP) generate NK cells and ILC lineages14, 15. High expression of Zbtb16 (encoding the transcription factor PLZF) identifies precursor cells committed to the ILC lineages, referred to as ILC precursors (ILCPs), and not the NK cell lineage5. Lineage fate mapping experiments in PLZFGFPCre mice showed that ILCs, but not NK cells, transitioned through a PLZF-GFP+ intermediate5. In competitive transfers of CLPs and congenically labeled PLZF-GFP+ fetal liver or BM ILCPs into Rag2−/−IL2rg−/− recipients, ILCPs gave rise to ILCs but not other lineages5. Transcription factor reporter lines have uncovered heterogeneity among EILPs and ILCPs, including intermediate expression of PLZF in EILPs and heterogeneous expression of the transcription factors ID2 and Bcl11b among ILCPs16, 17, 18. Notably, in vitro culture or in vivo transfer showed that the ID2+ subsets of ILCPs retained NK cell potential and supported a model with a common NK cell-ILC1 precursor distinct from, and likely downstream of, ILCP16, 17, 19.
ILC1s and NK cells differ in their requirements for the T-box family transcription factors T-bet and Eomes. Both ILC1s and NK cells express T-bet and are impaired in its absence20, 21, 22. However, Eomes is not expressed in ILC1s, whereas deficiency of Eomes ablates NK cells in the periphery, suggesting that Eomes is essential for the BM phase of NK cell development9, 20, 23, 24. Consistent with this, ectopic expression of Eomes using the promoter for Tbx21 (which encodes Tbet) induces neonatal ILC1s to adopt an NK cell-like phenotype25, suggesting Eomes is a fate-determining factor for NK commitment. However, the stage at which Eomes enforces diversion to the NK cell lineage remains unclear and the field lacks a developmental model that distinguishes NK cell commitment from that of ILC1. Here, coupling single-cell RNA-sequencing (scRNA-seq) analysis and RNA-velocity–based trajectory inference with in vitro and in vivo validation, we identified an Eomes-expressing progenitor that had NK cell but not ILC1 potential. Thus, our study identified the BM NK cell precursor and clarified developmental trajectories for NK cells and ILC1s.
RESULTS
Eomes+ non-NK cells can be detected in the mouse BM
To characterize innate lymphocyte development without relying on a complex, possibly biased panel of markers, we sorted BM lineage− (CD4−CD8−CD3ε−TCRβ−TCRγδ−CD19−B220−Gr1−CD11c−CD25−Ter119−(Lin−)) Tcf7-mCherry+ cells from EomesGFP/+Tcf7mCherry/+Zbtb16hCD4/+RorcThy1.1/+ mice, pooled them with BM mature Eomes-GFP+NK1.1+ NK cells and Eomes-GFP−NK1.1+IL-7Rα+ ILC1s and profiled them using scRNA-seq (Extended Data Fig. 1). After quality control, we identified clusters expressing markers for several progenitor populations, such as EILP (Nfil3, Bcl11a, Mycn; cluster 0)26, ILCP (Il7r, Zbtb16, Thy1, Pdcd1; cluster 1)16, 17, 27 and ILC2P (Icos, Il17rb, Gata3, Bcl11b; cluster 2)17, 28, 29 (Fig. 1a–c, Extended Data Fig. 2a–f, Methods). While these genes were highly expressed within anticipated populations, some markers, particularly ILCP markers (Il7r, Thy1), demonstrated broad expression across other clusters (Fig. 1b–c), suggesting that post-transcriptional regulation may play a role in their protein-level expression. Additionally, we identified clusters whose gene expression profiles were consistent with more mature cell states, such as NK cells (Gzma, Klra3, Itga2, Tbx21; cluster 3) and ILC1s (Xcl1, Itga1, Cd200r1 Klrb1b, Tbx21; cluster 5)8, as well as sEILP2 (H2-Ab1, Cd74, Ciita, Nfil3; cluster 7) (Fig. 1b), a population downstream of early EILP with antigen-presenting potential26. We further observed a population that expressed antigen-presenting genes alongside ILC3-associated genes (Rorc, Il17re, Il23r, Ly6a; cluster 8, “Rorc+ antigen presenting cell (APC)”), although type 17 cytokine expression (Il17a, Il17f and Il22) was almost entirely absent (Extended Data Fig. 2g). We could not definitively identify these cells, but expression of certain genes (Zbtb46, Ccr6, Aire) suggests they may be related to other APCs, such as Thetis or Janus cells30, 31, 32. We also noticed a small neighborhood of cells expressing markers of both ILC1 (Tbx21, Cd200r1, Klrb1b) and Rorc+ APC (Rorc, Il23r, Cd74), which we termed “intermediate ILC” (Int. ILC, cluster 6) (Fig. 1a,b), though it was unclear if these cells represented shared progenitors of ILC1 and Rorc+ APC or simply a similar cell state. Finally, we observed a cluster situated in the embedding between EILPs and ILCPs that had strong Eomes expression, intermediate Tcf7 expression and low NK receptor gene expression (e.g. Klrb1c, Klra3, Ncr1 and Tbx21) (Fig. 1b, c). We tentatively referred to this cluster as Eomes+Tcf7int. Thus, scRNA-seq catalogued the TCF7+ cells in the BM and identified an Eomes+ population that expressed low amounts of NK receptor transcripts.
Figure 1. Identification of Eomes+ cells in the mouse BM.
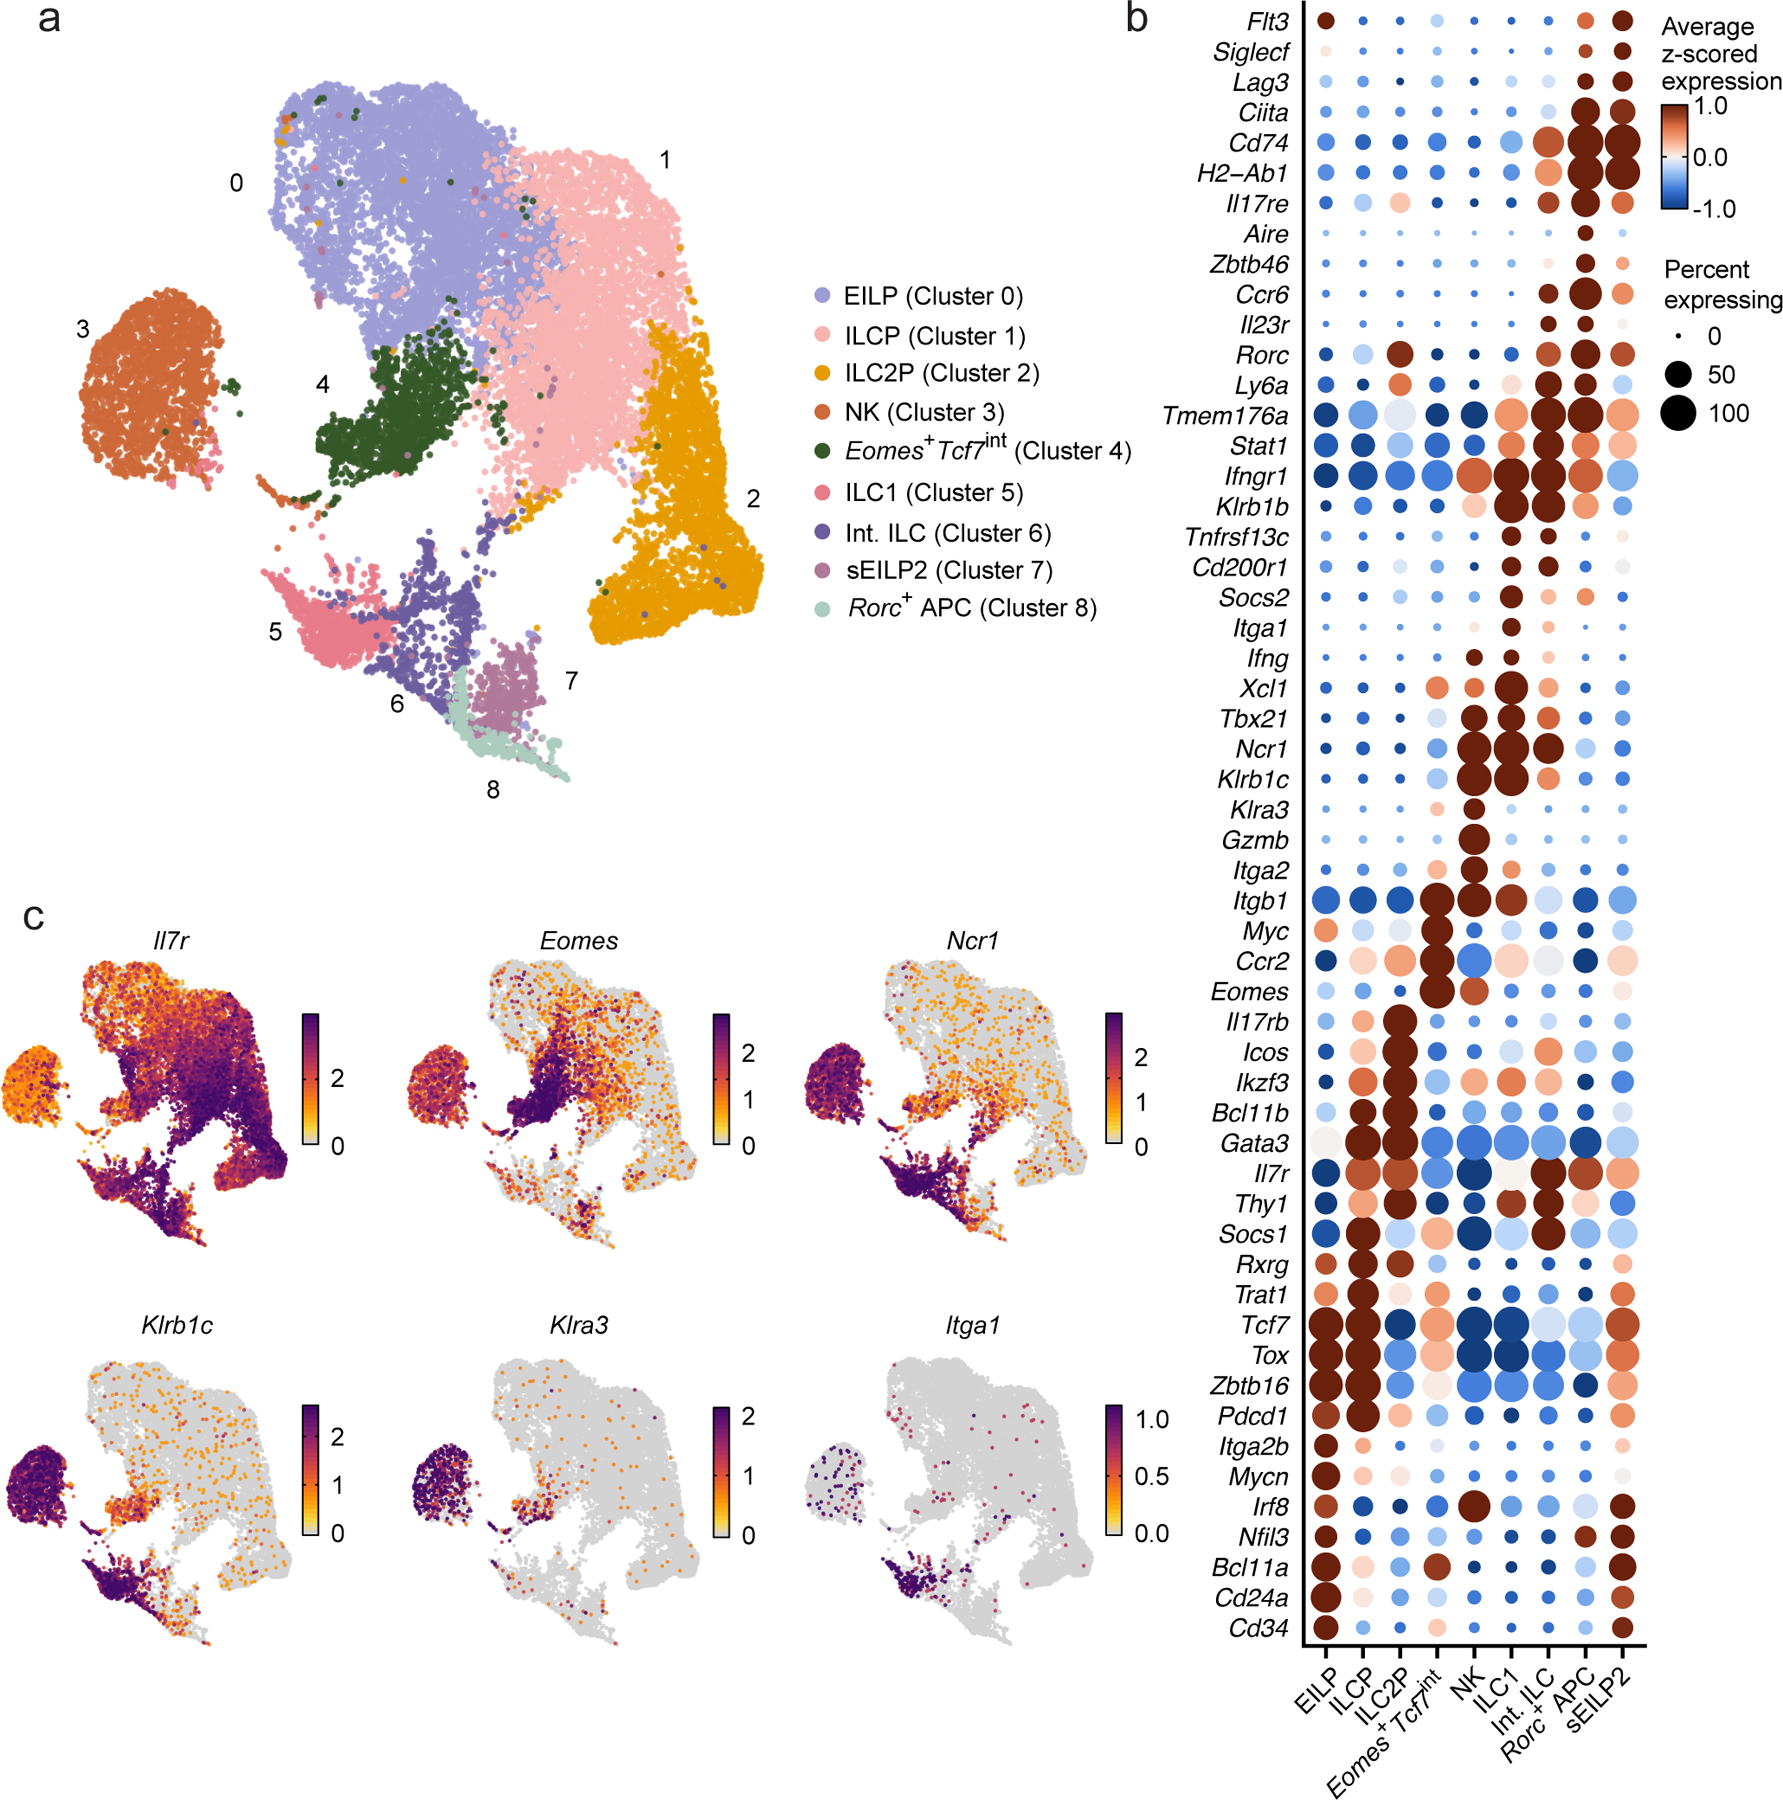
a, UMAP embedding of scRNA-seq data showing 19,961 CD4−CD8−CD3ε−TCRβ−TCRγδ−CD19−B220−Gr1−CD11c−CD25−Ter119−(Lin−) Tcf7-mCherry+ cells and NK1.1+ cells sorted from the BM of 19 females and 16 males EomesGFP/+Tcf7mCherry/+Zbtb16hCD4/+RorcThy1.1/+ mice, annotated by cluster (color, index number). b, Dot plot showing the expression of curated genes that are differentially expressed in a cluster relative to all other cells in clusters as in a. FDR-adjusted P < 0.05; absolute value of the log2-fold change (abs. log2FC) > 0.5. Dot color: row z-scored, cluster average of log- and size-normalized gene counts (normalized expression). Dot size, percent of cells in cluster with positive expression of the gene. c, UMAP embeddings, colored by normalized expression of curated differentially expressed genes as in b.
Eomes+Tcf7+ population is distinct from NK and ILC1
To understand the relationships between Eomes+Tcf7int, NK and ILC1 clusters in the scRNA-seq dataset, we performed differential expression analysis directly comparing the three populations. We found a large set of NK receptor genes (e.g. Klrg1, Klre1, Klra8, and Klrc2) and cytotoxic genes (e.g. Gzma, Gzmb, Fasl, Prf1) that were more highly expressed in NK cells than the Eomes+Tcf7int cluster, as well as some NK receptors with shared high expression in NK cells and ILC1s (e.g. Klrb1c, Ncr1, Klrk1, and Tbx21) (Fig. 2a, Supplementary Table 1). In contrast, the Eomes+Tcf7int cluster expressed transcripts associated with, and broadly expressed in, the multipotent progenitors EILP and ILCP such as Tcf7, Bcl11a and Tox17, 26 (Fig. 2a).
Figure 2. EomeshiNKneg cells are distinct from NK cells and ILC1s.
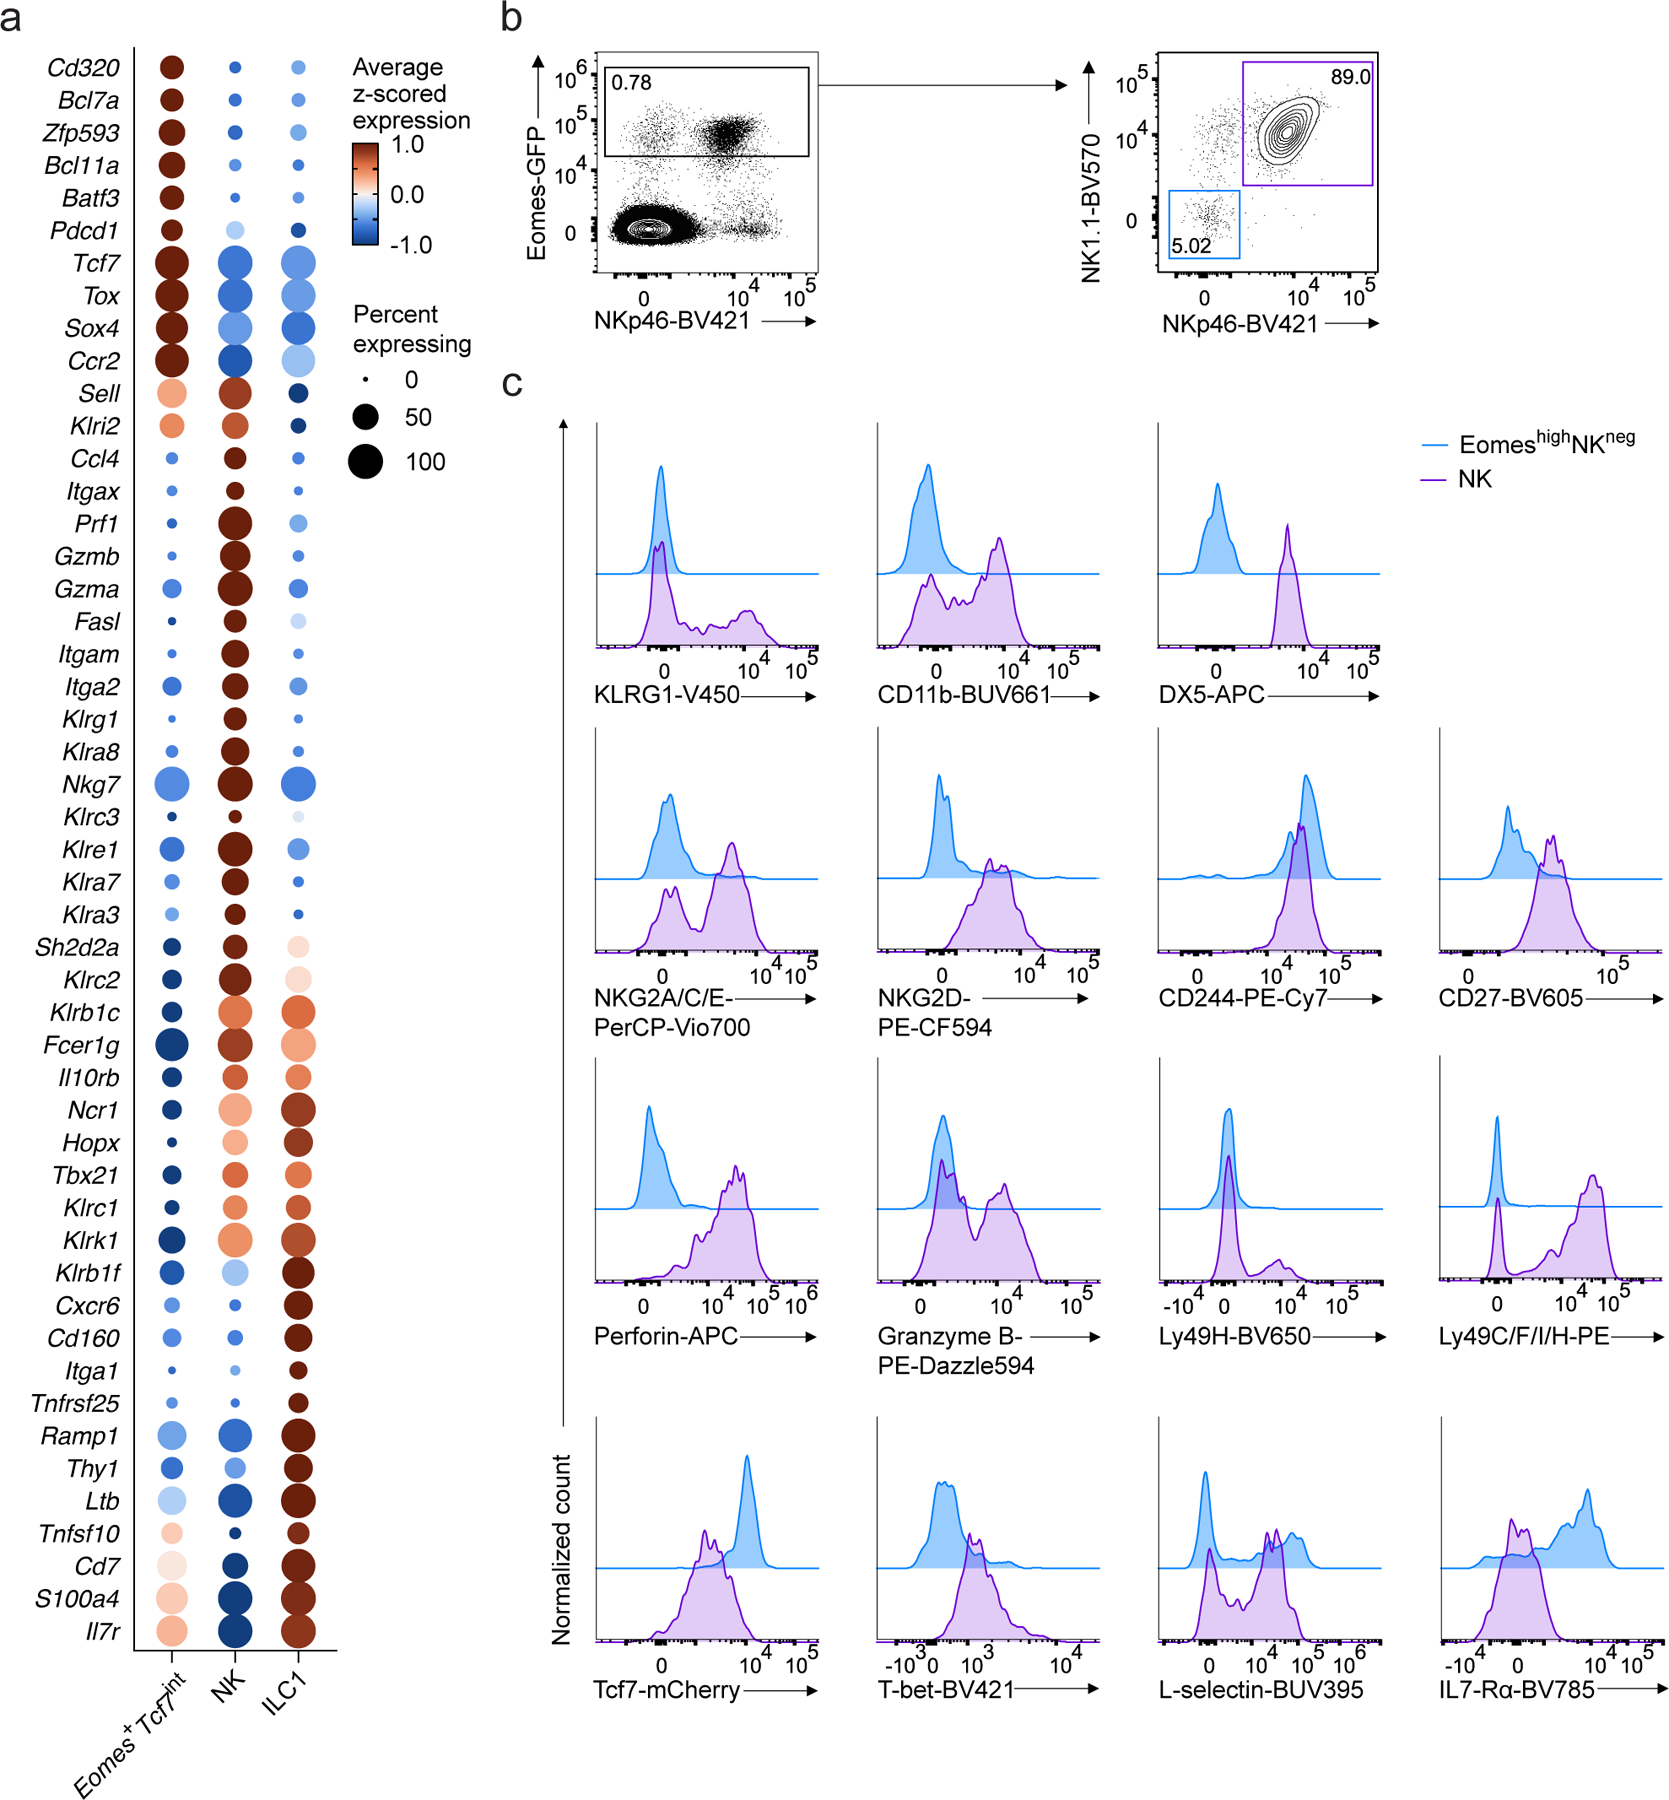
a, Dot plot showing expression of select genes differentially expressed in Eomes+Tcf7int, NK, or ILC1 clusters, relative to the other two clusters in scRNA-seq data. FDR-adjusted P < 0.05; abs. log2FC > 0.5. Dot color, size, as in Fig. 1b. b, Representative flow cytometry plots of Eomes-GFP+NK1.1−NKp46− cells (EomeshiNKneg) and Eomes-GFP+NK1.1+NKp46+ NK cells in BM CD4−CD8−CD3ε−TCRβ−TCRγδ−CD19−B220−Gr1−CD11c−CD25−Ter119−(Lin−) CD45+ cells from EomesGFP mice. c, Representative histogram showing the expression of NK associated markers KLRG1, CD11b, DX5, NKG2A/C/E, NKG2D, CD244, CD27, perforin, granzyme B, Ly49H, Ly49C/F/I/H, TCF7, T-bet, L-selectin and IL-7Rα on EomeshiNKneg cells or NK cells from the BM of EomesGFP/+Tcf7mCherry/+ mice. Data are pooled from 2 independent experiments.
To determine whether we could identify an analogous Eomes+ cell population by flow cytometry, we used EomesGFP mice, which express GFP under the control of the Eomes locus24. While the majority of BM Eomes-GFP+ cells expressed the NK cell and ILC1 markers NK1.1 and NKp46, a minority (5%) did not (Fig. 2b). Instead, the Eomes-GFP+NK1.1−NKp46− cells co-expressed TCF7 (Fig. 2b,c), suggesting that this population, termed EomeshiNKneg cells, was related to the scRNA-seq Eomes+Tcf7int cluster. To understand how transcriptional differences manifested at the protein level, we assessed expression of a number of NK cell markers, including CD11b, DX5, NKG2A/C/E, NKG2D, KLRG1, granzyme B, perforin, Ly49H, Ly49C/F/I/H and Tbet and found that EomeshiNKneg cells did not express any of these proteins (Fig. 2c). Thus, transcriptional profiling informed a flow cytometry analysis that identified EomeshiNKneg cells in the BM which were distinct from mature NK cells and ILC1s and exhibited characteristics of a progenitor population.
EomeshiNKneg cells are distinct from other progenitors
To further characterize the EomeshiNKneg population, we performed flow cytometry on BM Lin−Tcf7-mCherry+ cells from Tcf7mCherryEomesGFP mice. EomeshiNKneg cells, Tcf7-mCherry+α4β7+CD244+IL-7Rα−CD90− EILPs, and Tcf7-mCherry+α4β7+CD244+IL-7Rα+CD90+PD1+ ILCPs were detected at similar frequencies (Fig. 3a–d). EomeshiNKneg cells, EILPs and ILCPs segregated in the UMAP embedding due to differential expression of α4β7, PD1, PLZF, Thy1, IL-7Rα, CD122, Eomes and T-bet (Fig. 3b,d). To understand whether EomeshiNKneg cells were transcriptionally primed for differentiation to a particular lineage, we evaluated the expression of transcription factors known to be involved in innate lymphocyte development in our scRNA-seq dataset. While Cd24a+ EILP and Pdcd1hi ILCP clusters expressed transcription factors typical of multiple lineages (e.g. Gata3, Rorc, Tox2, Bcl11b), the Eomes+Tcf7int cluster expressed genes that are highly associated with the NK lineage, including Foxo1, Klf2, Nkg7, Tbx21 and Eomes8, 19, 33 (Fig. 3e, Supplementary Table 1). The Eomes+Tcf7int cluster also expressed more transcripts for NK receptors (e.g. Klra4, Klrc1, Klre1, Klra8) compared to EILPs and ILCPs (Fig. 3e, Supplementary Table 1), although expression was low relative to the Gzmb+ NK and Itga1+ ILC1 clusters (Fig. 2a, Supplementary Table 1) and not detectable at the protein level (Fig. 2c).
Figure 3. EomeshiNKneg cells are distinct from other progenitors.
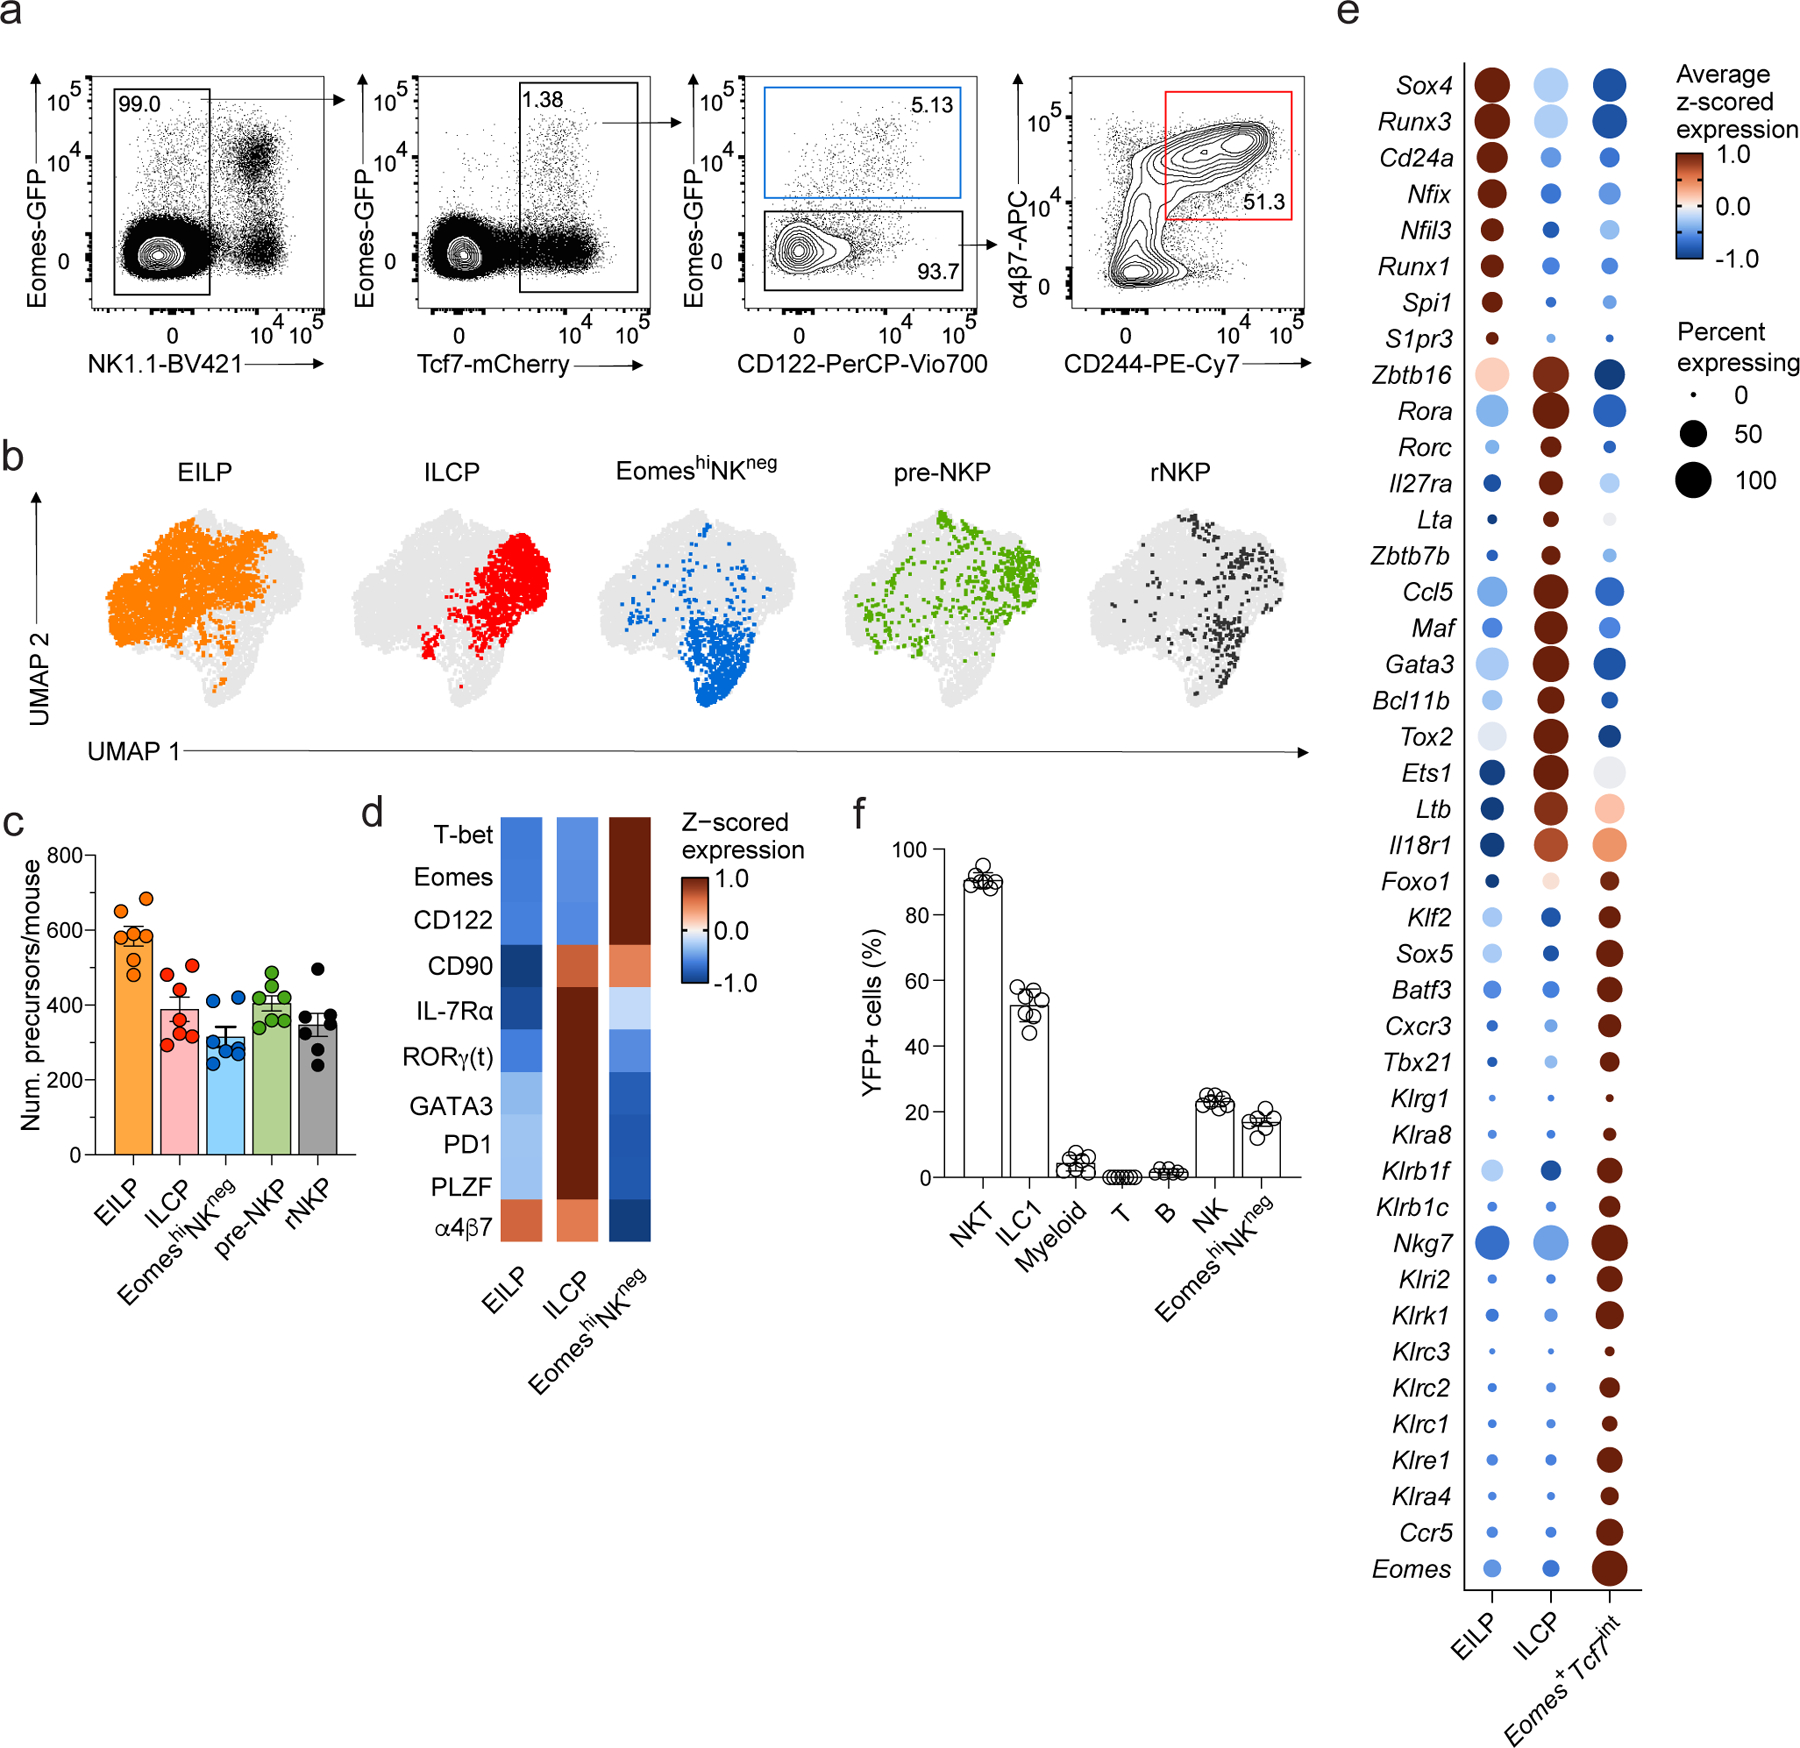
a, Gating strategy used for the identification of EomeshiNKneg cells, Tcf7-mCherry+α4β7+CD244+IL-7Rα−CD90− EILPs, Tcf7-mCherry+α4β7+CD244+IL-7Rα+CD90+PD1+ ILCPs in the BM of Tcf7mCherry/+EomesGFP/+Zbtb16hCD4/+RorcThy1.1/+ mice by flow cytometry. Gated on Lin− cells as shown in Extended Data 1. b, High-dimensional flow cytometry embedding of BM precursors, shown as UMAP with FlowSOM clustering among cell populations selected as in a. c, Number of EILPs (n=7), ILCPs (n=7), EomeshiNKneg cells (n=7), preNKPs (n=6), rNKPs (n=7) isolated from the BM of 4-week-old Tcf7mCherry/+EomesGFP/+Zbtb16hCD4/+RorcThy1.1/+ mice. Data are pooled from 7 independent experiments, data represent mean ± s.e.m. d, Heatmap showing relative expression of α4β7, PD1, PLZF, CD90, IL-7Rα, Eomes and CD122 in EILPs, ILCPs and EomeshiNKneg clusters as in b. e, Dot plot showing expression of genes differentially expressed in EILP (cluster 0), ILCP (cluster 1) or Eomes+Tcf7int (cluster 4) relative to the other two clusters in scRNA-seq. FDR-adjusted P < 0.05; abs. log2FC > 0.5. Dot color, size, as in Fig. 1b. f, Bar graph showing the frequency of PLZF-fate mapped YFP+ fraction in liver GR1+ myeloid cells (n=7), spleen CD3ε+Cd1d-tetramer+ NKT cells (n=7), spleen CD19+ B cells (n=7), spleen CD3ε+ T cells (n=7), liver CD3ε−NK1.1+DX5−CD49a+ ILC1 (n=7), liver CD3ε−NK1.1+DX5+CD49a− NK cells (n=7), BM EomeshiNKneg cells (n=6) in radiation chimeras reconstituted with YFP− Lin− Sca-1+ cKit+ BM LSK cells from PLZFGFP-Cre/+ ROSA26fl-STOP-fl-YFP/+ mice. Data are pooled from 4 independent experiments. Data represent mean ± s.e.m.
Because other NK-committed precursor cells, such as Lin–CD244+CD27+IL-7Rα+Flt3–CD122+ rNKPs and Lin–CD244+CD27+IL-7Rα+Flt3–CD122– pre-NKPs34 have been described, we sought to understand the relationships between these precursors and EomeshiNKneg cells. However, we were unable to assign the pre-NKP or rNKP populations to distinct clusters in our scRNA-seq data (Extended Data Fig. 3a, Fig. 1) because of broad expression of relevant marker genes (e.g., Cd27, Il7r), reflecting either poor correlation between transcript and protein levels or previously reported heterogeneity within populations35. UMAP and clustering analysis of the flow cytometry data supported the hypothesis that these cells were heterogeneous, with rNKPs overlapping with ILCPs, and EomeshiNKneg cells and pre-NKPs clustering with EILPs and ILCPs (Fig. 3b). Lin–Id2+IL-7Rα+CD25–α4β7–NKG2A/C/E+Bcl11b–aceNKP were described as progenitors with both NK cell and ILC1 potential36. Gene expression of aceNKP-defining proteins (e.g., Il7r, Klrc1, Klrc2, Zbtb16 and Bcl11b) was high in ILC1s and a fraction of Eomes+Tcf7int cells in our scRNA-seq data (Extended Data Fig. 3b). The lack of a distinct cluster matching the aceNKP profile suggested the population was heterogeneous.
To assess the developmental divergence of EomeshiNKneg cells from PLZF+ progenitors such as ILCP, we employed a fate mapping approach using irradiated recipients reconstituted with sorted YFP−Lin−Sca1+cKit+ precursors from PLZFGFP-Cre/+ROSA26fl-STOP-fl-YFP/+ mice, where YFP expression denotes cells derived from a PLZF-expressing precursor5, 35. Over 50% of ILC1s expressed YFP, while only 20% of EomeshiNKneg and NK cells were YFP+, suggesting that the majority of EomeshiNKneg cells and NK cells did not originate from a PLZF+ precursor (Fig. 3f). Consistent with this, we examined the BM of Zbtb16 +18/32Δ/Δ mice, which lack an enhancer required for PLZF expression, and found that the number of EomeshiNKneg cells was unchanged relative to controls (Extended Data Fig. 4), suggesting that EomeshiNKneg development was PLZF independent. These results indicated that EomeshiNKneg cells may represent precursors of NK cells distinct from the multipotent EILPs and ILCPs and highlighted a previously underappreciated heterogeneity among other proposed NK and ILC1 precursors, which may have confounded previous studies.
EomeshiNKneg cells emerge postnatally
To investigate the developmental trajectory of EomeshiNKneg cells in relation to NK cells and ILC1, we assessed the expression of DX5, CD49a, Eomes, CD200r, L-selectin, TRAIL, KLRG1 and CD69, which have been reported to distinguish NK cells and ILC1s, in CD3ε–NK1.1+NKp46+ lymphocytes isolated from the liver of 1 to 6-week-old EomesGFP mice (Extended Data Fig. 5a). ILC1s represented nearly 50% of liver CD3ε–NK1.1+NKp46+ cells at week 1, while NK cells greatly outnumbered them (80%) at week 6 (Extended Data Fig. 5b,c), consistent with previous reports35, 37. We also identified a DX5loCD49a+CD200r– population that lacked a clear bias towards an NK or ILC1 phenotype that was detected early in ontogeny, but gradually lost (Extended Data Fig. 5a–d), suggesting it may contain a mixture of immature cells. EomeshiNKneg cells and NK1.1+Eomes-GFP+ NK cells were nearly absent in the fetal liver at E14.5 but rapidly accumulated in neonates BM (Fig. 4a,b), while ILCPs were identified in both fetal liver and BM across all examined time points (Fig. 4b). These results confirmed reports that NK cells and ILC1s seed the liver at different times35, 37 and suggested that EomeshiNKneg cells were distinct from ILCPs based on their developmental kinetics.
Figure 4. EomeshiNKneg cells emerge post-natally.
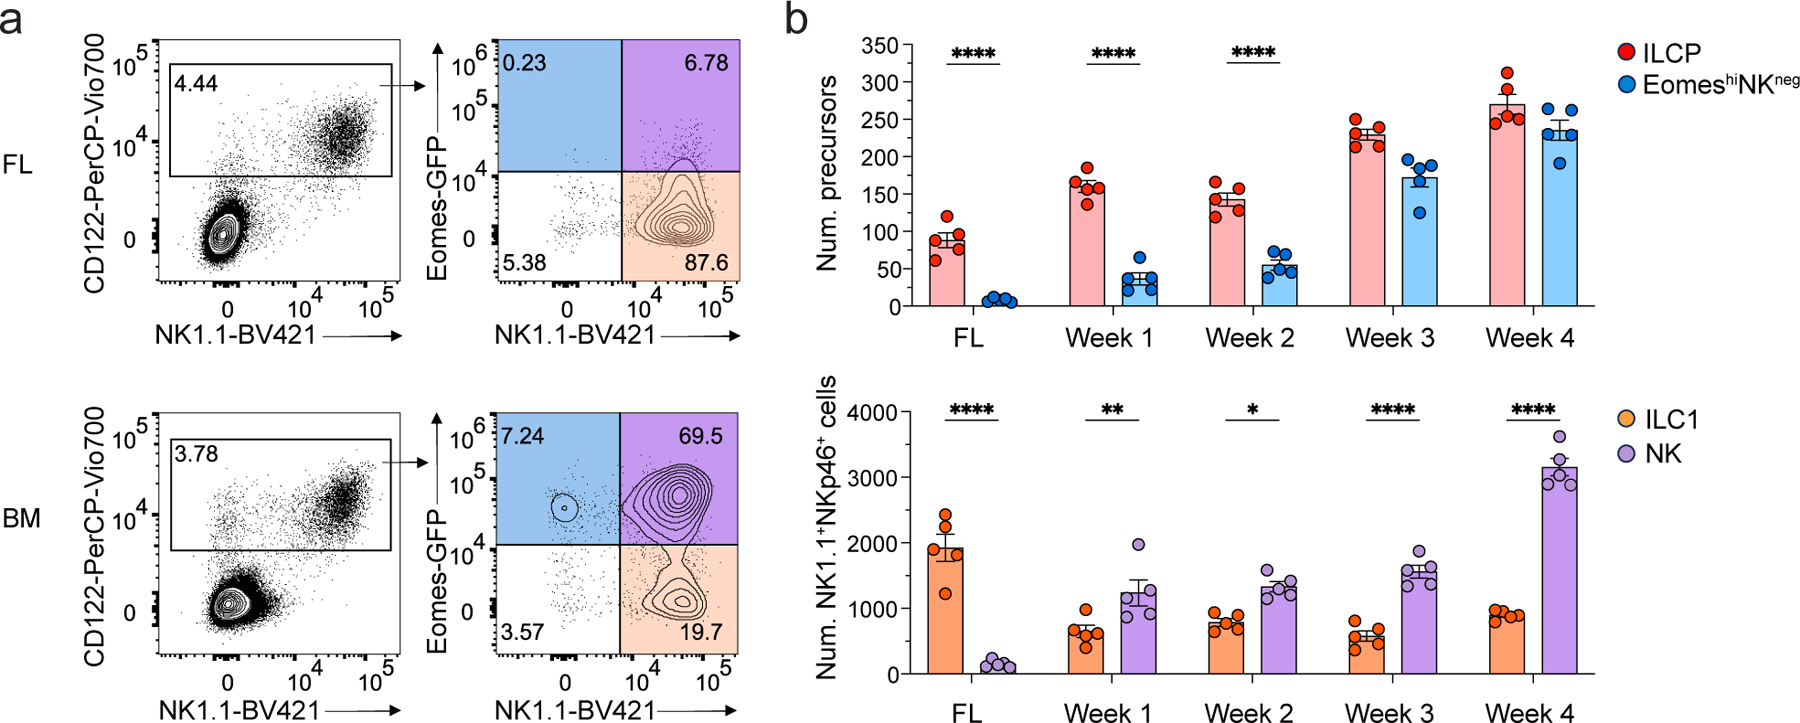
a, Representative flow cytometry plot showing the frequency of Eomes-GFP+NK1.1− EomeshiNKneg cells, Eomes-GFP+NK1.1+ NK cells and Eomes-GFP−NK1.1+ ILC1s in Lin−CD45+ lymphocytes isolated from fetal liver at embryonic day 14.5 (E14.5; pooled samples from 9 fetus) and the BM of 4-week-old Tcf7mCherry/+EomesGFP/+ mice. b, Bar graph showing number of Eomes-GFP+NK1.1− cells (EomeshiNKneg), Tcf7-mCherry+α4β7+CD244+IL-7Rα+CD90+PD1+ ILCPs, Eomes-GFP+NK1.1+ NK cells and Eomes-GFP−NK1.1+ ILC1s in the E14.5 fetal liver (n=5) or 1–4 week old BM (n=5) of Tcf7mCherry/+EomesGFP/+ mice. Data are representative of two independent experiments. Statistical significance was calculated by two-way ANOVA with Tukey’s multiple comparisons test. Data represent mean ± s.e.m. *P < 0.05. **P < 0.01. ****P < 0.0001.
EomeshiNKneg cells are committed precursors to NK cells
To assess the developmental potential of EomeshiNKneg cells and test whether Eomes distinguished NK cell precursors from ILC1 precursors, we cultured EomeshiNKneg cells or ILCPs on OP9 stroma for 7 days in the absence of polarizing cytokines. Because expression of Eomes and DX5 was not reliable in OP9 cultures (Extended Data Fig. 6a), we used a combination of TRAIL and KLRG1 to distinguish between NK cells and ILC1. At day 7, cultured ILCPs generated all ILC lineages, including NK1.1–ICOS+Rorc-Thy1.1– ILC2s, NK1.1–Rorc-Thy1.1+ ILC3s and NK1.1+ICOS–TRAIL+KLRG1– ILC1s (Fig. 5a,b). About 70% of cells generated from EomeshiNKneg were NK1.1+ICOS–TRAIL–KLRG1+ NK cells (Fig. 5a,b). EomeshiNKneg cells generated some ILC1s (<5%), but did not generate ILC2 or ILC3 (Fig. 5a,). Single-cell culture of EomeshiNKneg led to the development of 70% TRAIL–KLRG1+ NK cells (Fig. 5c), demonstrating a bias toward the production of NK cells. By day 7, EomeshiNKneg-derived cells, like cultured NK1.1+Eomes-GFP+ NK cells, exhibited high expression of perforin and lysed YAC1 cells (Fig 5d,e).
Figure 5. EomeshiNKneg cells generate functional NK cells in vitro.
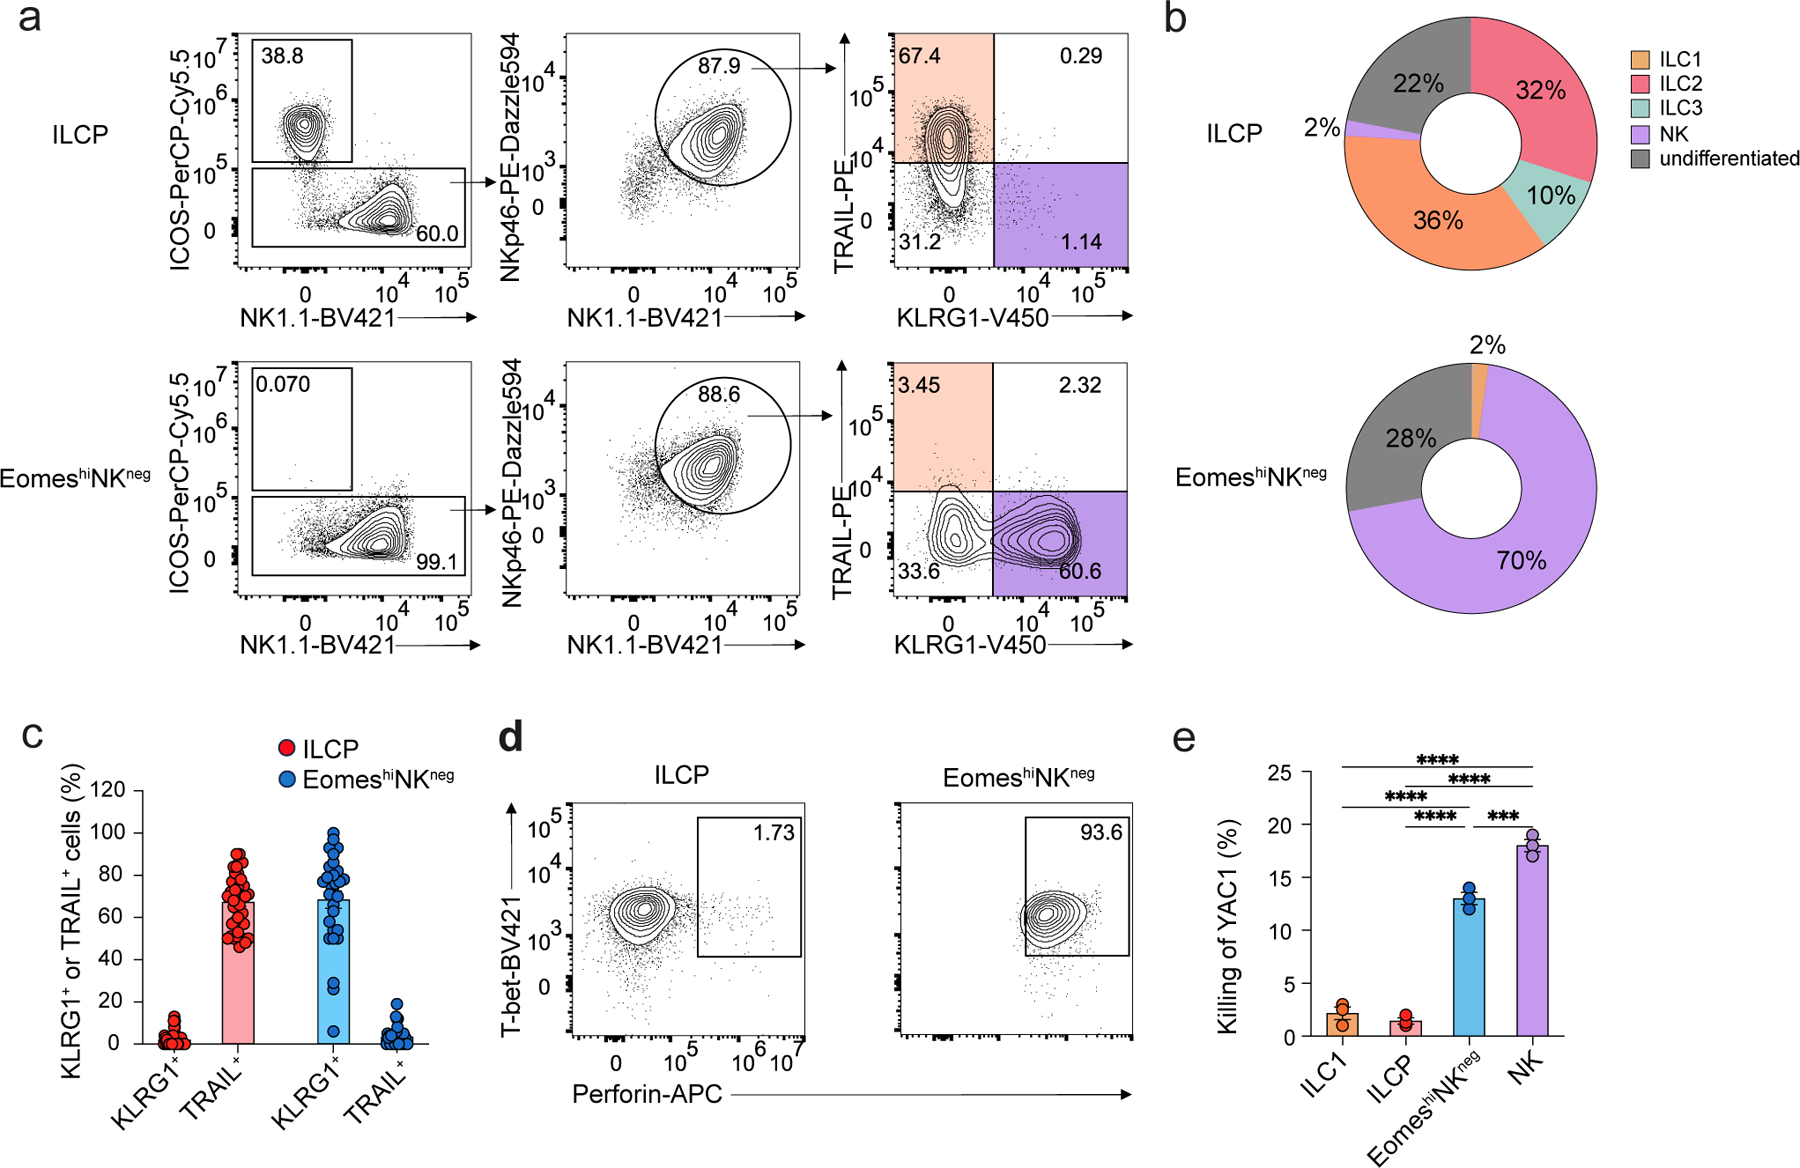
a, Representative flow cytometry plots showing ILCP- and EomeshiNKneg cell-derived NK1.1–ICOS+ ILC2/ILC3s, NK1.1+ICOS–TRAIL+KLRG1– ILC1s and NK1.1+ICOS–TRAIL–KLRG1+ NK cells on day 7 of co-culture with OP9 cells with IL-2, IL-7 and SCF. b, Pie chart showing the average frequency of NK1.1–ICOS+Rorc-Thy1.1– ILC2s, NK1.1–Rorc-Thy1.1+ ILC3s, NK1.1+ICOS–TRAIL+KLRG1– ILC1s, NK1.1+ICOS–TRAIL–KLRG1+ NK cells and NK1.1+ICOS–TRAIL–KLRG1– undifferentiated cells in ILCP or EomeshiNKneg cell-derived progenies at day 7 as in a. Data are representative of three independent experiments. c, Bar graph showing the expression of TRAIL and KLRG1 on NK1.1+ICOS– cells derived from single ILCP (n=37) or EomeshiNKneg cells (n=19) at day 7 as in a. d, Intracellular staining of Tbet and perforin in ILCP- or EomeshiNKneg cell-derived NK1.1+ICOS–Nkp46+ cells at day 7 of culture as in a. e, Percentage of efficiency of killing of YAC1 tumor cells cultured at 1:1 ratio with NK1.1+ICOS– cells derived from Eomes-GFP−NK1.1+IL-7Rα+ ILC1s (n=3), α4β7+CD244+IL-7Rα+CD90+PD1+ ILCPs (n=3), EomeshiNKneg cells (n=3) or Eomes-GFP+NK1.1+ NK cells (n=3) sorted from the BM of EomesGFP mice, co-cultured with OP9 cells with IL-2, IL-7, SCF for 6 days and stimulated with IL-15 overnight. Statistical significance was calculated by two-way ANOVA with Tukey’s multiple comparisons test. Data represent mean ± s.e.m. ***P<0.001, ****P < 0.0001
To further evaluate the developmental potential of the EomeshiNKneg population, we intravenously transferred CD45.1/CD45.2 EomeshiNKneg cells along with equal numbers of CD45.2/CD45.2 EILPs, ILCPs, pre-NKPs or rNKPs sorted from the BM of Tcf7mCherry/+EomesGFP/+ mice into sublethally-irradiated Rag2−/−IL2rg−/− recipients and examined the reconstitution of CD3ε−NK1.1+NKp46+ cells in the liver at week 2 post-transfer. These competitive transfers aimed to minimize abnormal differentiation following transfer into a lymphopenic recipient and to gauge the relative efficiency of NK cell generation against a comparator population. EILPs gave rise to both DX5+CD49a– NK cells and DX5–CD49a+ ILC1s, ILCPs gave rise mostly to ILC1s, and EomeshiNKneg cells predominantly generated NK cells, some of which expressed Ly49H (Fig. 6a,b). As previously reported5, ILCPs generated some DX5+ NK cells, although these cells did not acquire expression of Ly49H (Fig. 6a), suggesting that ILCP-derived cells did not acquire the typical mature NK program. pre-NKPs and rNKPs generated both NK cells and ILC1s, similar to EILPs (Fig. 6b). Unlike ILCPs, EomeshiNKneg cells did not reconstitute NK1.1−CD90+IL-7Rα+CD25+IL-33Rα+ ILC2s in the lung at week 2 post-transfer (Extended Data Fig. 6c), but gave rise to a small population of liver ILC1s (Fig. 6a,b). To determine the relative contribution of each transferred population to the NK compartment, we assessed the origin of Eomes-GFP+CD3ε−NK1.1+NKp46+DX5+ NK cells in spleen, liver and lung of sublethally irradiated Rag2−/−IL2rg−/− mice at week 2 post-competitive transfer of EomeshiNKneg cells with either rNKPs or ILCPs. In all tissues examined, EomeshiNKneg cells generated over 80% of NK cells, while rNKPs and ILCPs generated less than 20% of NK cells (Fig. 6c,d), suggesting that EomeshiNKneg cells were more efficient NK cell precursor cells than rNKPs and ILCPs. These results indicated that the EomeshiNKneg cells were NK cell precursors and suggested that the contribution of ILCPs to the mature NK compartment was minimal.
Figure 6. EomeshiNKneg cells are precursors committed to the NK cell lineage.
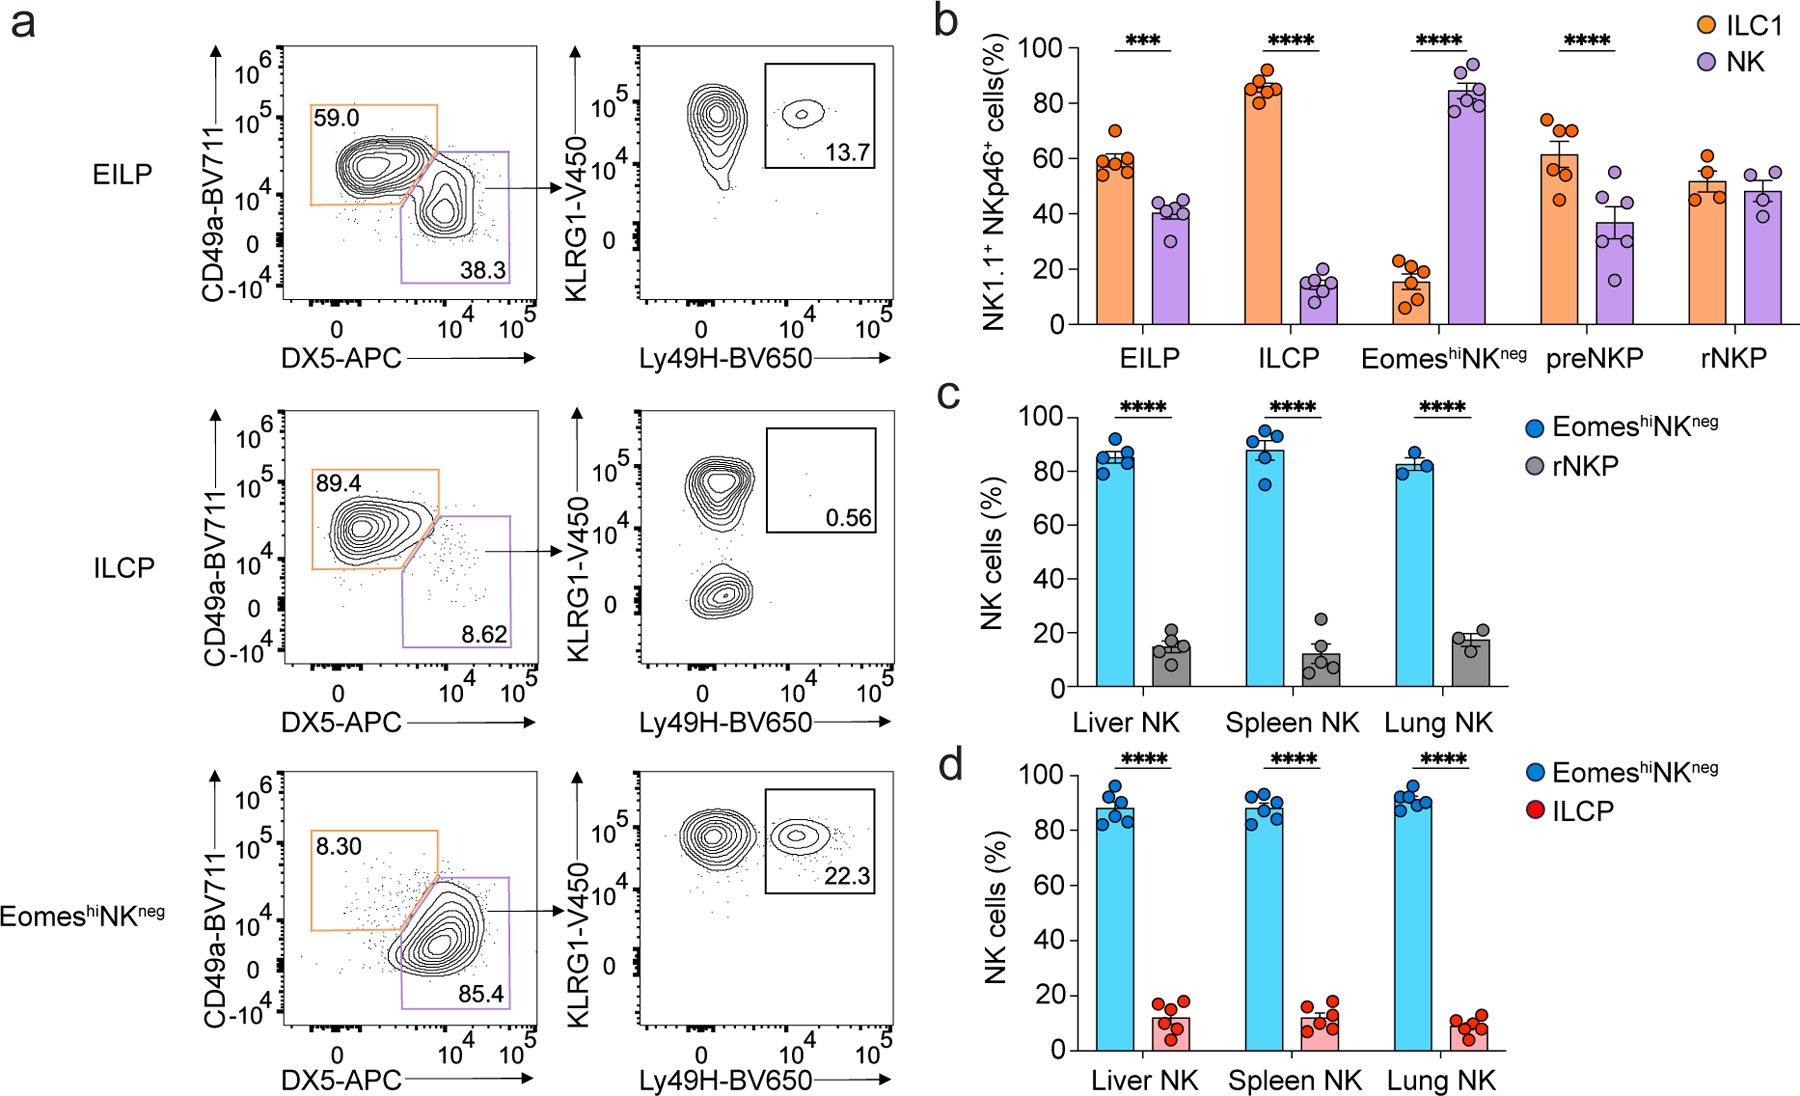
a, Representative flow cytometry of DX5−CD49a+ ILC1s and DX5+CD49a−KLRG1+Ly49H+ NK cells within the CD3ε−TCRb−NK1.1+NKp46+ cell compartment in the liver of CD45.2/CD45.2 Rag2−/−IL2rg−/− mice intravenously transferred with equal mixes of CD45.1/CD45.2 EomeshiNKneg cells and CD45.2/CD45.2 Tcf7-mCherry+α4β7+CD244+IL-7Rα−CD90− EILPs, Tcf7-mCherry+α4β7+CD244+IL-7Rα+CD90+PD1+ ILCPs, CD244+CD27+IL7R+Flt3–CD122– pre-NKPs and CD244+CD27+IL-7Rα+Flt3–CD122+ rNKPs at week 2 post-transfer. b, Frequency of reconstituted DX5−CD49a+ ILC1s and DX5+CD49a− NK cells in the liver of Rag2−/−IL2rg−/− mice transferred with EILPs (n=6), ILCPs (n=6), EomeshiNKneg cells (n=8), preNKPs (n=4) and rNKPs (n=4) as in a, at week 2 post-transfer. Data represent mean ± s.e.m. ***P = 0.0008, ****P < 0.0001. Data are representative of five independent experiments. c, Relative contribution of CD45.1/CD45.2 EomeshiNKneg cells and CD45.2/CD45.2 rNKPs to the reconstitution of CD3ε−NK1.1+NKp46+DX5+CD49a− NK cells in the liver (n=5), spleen (n=5) and lung (n=3) of Rag2−/−IL2rg−/− mice transferred with an equal mix of precursor cells as in a, at week 2 post-transfer. Data are representative of two independent experiments. Data represent mean ± s.e.m. ****P < 0.0001. d, Relative contribution of CD45.1/CD45.2 EomeshiNKneg cells and CD45.2/CD45.2 ILCPs to CD3ε−NK1.1+NKp46+DX5+CD49a− NK cells in the liver (n=6), spleen (n=6) and lung (n=6) of Rag2−/−IL2rg−/− mice transferred with an equal mix of precursor cells as in a, at week 2 post-transfer. Data are representative of three independent experiments. Data represent mean ± s.e.m. ****P < 0.0001.
PLZF+Eomes+ cells have both ILC1 and NK potential
We next tested whether ILC1 generation by EomeshiNKneg cells and NK cell generation by ILCPs was an artifact of the experimental system or reflected developmental complexity. Flow cytometry analysis indicated that 16% of EomeshiNKneg cells co-expressed low levels of PLZF and PD1 relative to PLZFintPD1int EILPs and PLZFhiPD1hi ILCPs (Fig. 7a). Conversely, approximately 5% of ILCPs were EomesintPD1+ (Fig. 7b). In the scRNA-seq data, based on expression patterns of Eomes, Zbtb16 and Pdcd1, we estimated that the cells most likely to correspond to the PLZFlo subsets of EomeshiNKneg cells were situated at the junction of Cd24a+ EILP, Pdcd1hi ILCP and Eomes+Tcf7int clusters (Fig. 7c).
Figure 7. PLZF+Eomes+ cells have both ILC1 and NK potential.
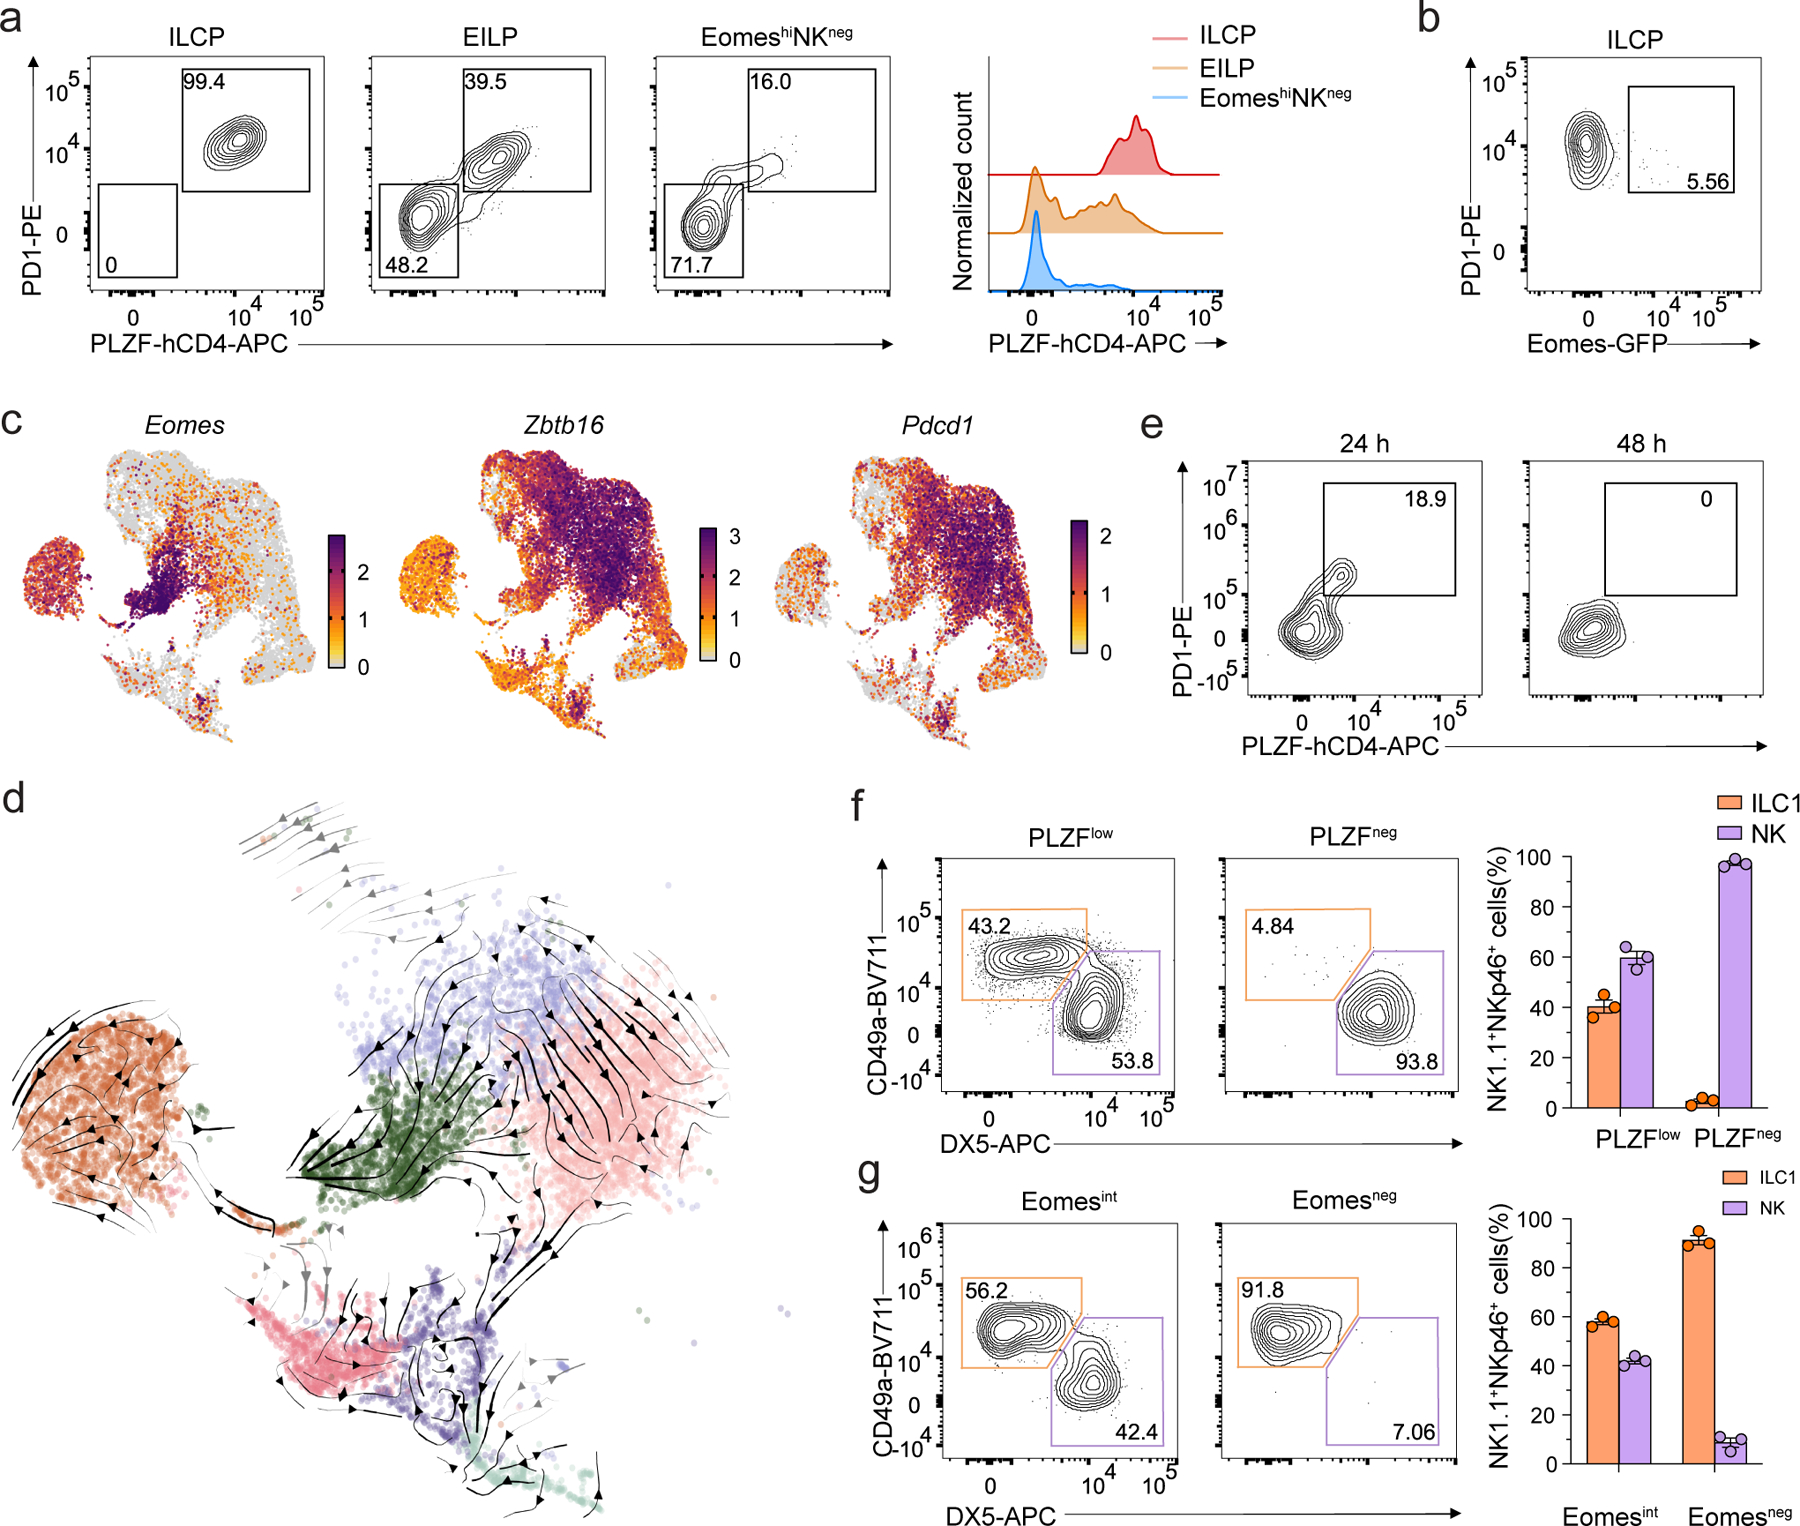
a, Representative flow cytometry showing PD1 by PLZF staining (left) and histogram of PLZF expression (right) on Tcf7-mCherry+α4β7+CD244+IL-7Rα+CD90+PD1+ ILCPs, EomeshiNKneg cells and Tcf7-mCherry+α4β7+CD244+IL-7Rα−CD90− EILPs from the BM of Tcf7mCherry/+EomesGFP/+Zbtb16hCD4/+RorcThy1.1/+ mice. b, Representative flow cytometry plot of PLZF and Eomes expression in ILCPs as in a. c, UMAP embedding of scRNA-seq data as in Fig. 1a, with cells colored by normalized expression of Eomes, Zbtb16, and Pdcd1. d, Close-up of UMAP embedding colored by cluster, as in Fig. 1a, focused on cells with relatively high expression of gene programs relating to NK, ILC1, ILCP, and Eomes+Tcf7int populations (Methods). Arrows, overlaid RNA velocity streamlines indicating the cellular state transitions inferred by TopicVelo from the displayed cells (Methods, Supplementary Fig. 2,3). Arrows are colored gray over very low density UMAP regions and otherwise black. e, Representative flow cytometry plot of PD1 and PLZF expression on PLZFloEomeshiNKneg cells isolated from BM of Tcf7mCherry/+EomesGFP/+Zbtb16hCD4/+RorcThy1.1/+ mice and cultured on OP9 cells with IL-2, IL-7 and SCF at 24 and 48 hours of co-culture. f, Representative flow cytometry plot (left) and quantification (right) of CD3ε−NK1.1+DX5−CD49a+ ILC1s and CD3ε−NK1.1+DX5+CD49a− NK cells in the liver of CD45.2/CD45.2 Rag2−/−IL2rg−/− mice transferred with equal mixes of CD45.1/CD45.2 PLZFloEomeshiNKneg or PLZFnegEomeshiNKneg cells and CD45.2/CD45.2 ILCPs, at week 2 post transfer (n=3). Data represent mean ± s.e.m. g, Representative flow cytometry plot (left) and quantification (right) of CD3ε−NK1.1+DX5−CD49a+ ILC1s and CD3ε−NK1.1+DX5+CD49a− NK cells in the liver of CD45.2/CD45.2 Rag2−/−IL2rg−/− mice transferred with equal mixes of CD45.1/CD45.2 Eomesint ILCPs and CD45.2/CD45.2 Eomesneg ILCPs at week 2 post transfer (n=3). Data are representative of three independent experiments. Data represent mean ± s.e.m.
To gain insight into the transcriptional state transitions these cells may undergo during development, we performed trajectory inference on our scRNA-seq data using multiple methods: PAGA, a method that infers relationships based on transcriptional similarity38; scVelo, the standard method for RNA velocity, which infers directed transitions by modeling transcriptional dynamics39; and TopicVelo, an RNA velocity method that addresses some limitations of scVelo by disentangling distinct gene programs using a probabilistic topic model and estimating the dynamics of distinct processes using a stochastic transcriptional burst model40. While PAGA identified relationships between clusters, they were not necessarily associated with validated developmental pathways. For instance, a relationship between NK cells and ILC1 was likely caused by shared type 1 effector genes, though we could not rule out a precursor-product relationship (Extended Data Fig. 7a). Results from scVelo failed to recapitulate known developmental relationships, predicting that ILC1s were upstream of ILCPs (Extended Data Fig. 7b). We reasoned that the global dynamics estimated by scVelo may be confounded by the existence of separate, simultaneous developmental processes with distinct dynamics and hence applied TopicVelo. In a focused analysis of the cells relatively high in the gene programs related to NK cells, ILC1, ILCP and Eomes+Tcf7int, as well as in a global analysis of all cells, TopicVelo results reflected known developmental relationships without being given prior information about them (Fig. 7d, Extended Data Figs. 7c,d,8, Methods). For example, cells in the EILP cluster gave rise to cells in the ILCP cluster, which, in turn, transitioned toward the Itga1+ ILC1 and Icoshi ILC2P clusters (Fig. 7d, Extended Data Fig. 7d). TopicVelo also revealed a divergence in the Eomes+Zbtb16+Pdcd1+ neighborhood of EILPs, with flow both toward the Eomes+Tcf7int cluster and toward the Eomes+Zbtb16+Pdcd1+ ILCP neighborhood upstream of ILC1s (Fig. 7d, Extended Data Fig. 7d), suggesting that the PLZFloPD1loEomeshiNKneg population might have dual potential for NK cells and ILC1s.
Because our adoptive transfer experiments were agnostic to expression of PLZF in the EomeshiNKneg cell population, we next evaluated whether the ILC1 potential of EomeshiNKneg cells stemmed from the PLZFloPD1loEomeshiNKneg subset (hereafter PLZFloEomeshiNKneg). To establish the relationship between PLZFlo and PLZFneg EomeshiNKneg subsets, we plated PLZFloEomeshiNKneg cells on OP9 stroma with IL-2, IL-7 and SCF. After 24 hours, we observed the loss of PLZF expression (Fig. 7e), suggesting a precursor-product relationship. By day 7, neither PLZFloEomeshiNKneg nor PLZFnegEomeshiNKneg generated NK1.1–ICOS+ ILC2s or NK1.1–ICOS+ ILC3s (Extended Data Fig. 9a). Further, PLZFnegEomeshiNKneg cells generated more KLRG1+ NK cells than the PLZFloEomeshiNKneg counterpart (Extended Data Fig. 9a). We performed similar experiments using Eomesint or Eomesneg ILCPs and found that Eomesint ILCPs generated NK cells but not ILC2s or ILC3s (Extended Data Fig. 9b).
To assess the relative potential of PLZFlo or PLZFnegEomeshiNKneg subsets to generate ILC1s or NK cells in vivo, we co-transferred CD45.2/CD45.2 PLZFloEomeshiNKneg or PLZFnegEomeshiNKneg subsets sorted from EomesGFP/+Zbtb16hCD4/+ mice with equal numbers of CD45.1/45.2 ILCPs from EomesGFP/+ mice into Rag2−/−IL2rg−/− mice. We examined the liver at week 2 post-transfer and found that PLZFnegEomeshiNKnegcells generated DX5+CD49a– NK cells nearly exclusively (>90%), while PLZFloEomeshiNKnegcells generated both DX5+CD49a– NK cells and DX5–CD49a+ILC1s (Fig. 7f). Neither population generated ILC2s in the lung (Extended Data Fig. 9c). This suggested that PLZFnegEomeshiNKnegcells were almost entirely NK-committed, whereas the PLZFloEomeshiNKneg subset retained dual potential for NK and ILC1. Conversely, competitive transfer of CD45.1/CD45.2 Eomesint ILCPs with CD45.2/CD45.2 Eomesneg ILCPs sorted from the BM of EomesGFP/+Zbtb16hCD4/+ mice into Rag2−/−γc−/− mice showed that Eomesint ILCPs, which also expressed both Eomes and PLZF, generated approximately 40% DX5+CD49a– NK cells and 60% DX5–CD49a+ILC1s in the liver (Fig. 7g), indicating they retained NK potential, whereas Eomesneg ILCPs generated almost exclusively ILC1s (Fig. 7g). These observations suggested that cell fate choice between NK cells and ILC1s depended on competition between factors that promoted expression of Eomes or PLZF (Extended Data Fig. 10). Several cytokine receptor transcripts (e.g., Tgfbr1, Tgfbr2 and Il4ra) that could be implicated in this fate decision were detected in the scRNA-seq EILP cluster (Supplementary Table 2). Although exact factors influencing this decision remain unclear, these results identified subsets of ILCP and EomeshiNKneg that co-expressed PLZF and Eomes and retained dual ILC1 and NK cell lineage potential. In contrast, more mature PLZFnegEomeshiNKneg and Eomesneg ILCP generated only NK cells and ILCs, respectively.
EomeshiNKneg cells give rise to functional NK cells
To probe whether the NK cells derived in vivo from EomeshiNKneg cells were functional, we intravenously transferred EomeshiNKneg cells or ILCPs isolated from the BM of EomesGFP mice into sublethally irradiated Rag2−/−IL2rg−/− mice, isolated CD3ε−NK1.1+NKp46+ cells from the liver at week 2 post-transfer and stimulated them with PMA and ionomycin. EomeshiNKneg-derived CD3ε−NK1.1+NKp46+DX5+ cells produced IFNγ, but not TNF or GM-CSF, similar to control DX5+CD49a– NK cells isolated from the liver of EomesGFP mice (Fig. 8a). We also transferred EomeshiNKneg cells isolated from the BM of EomesGFP mice into sublethally irradiated Rag2−/−IL2rg−/− mice, isolated poly (I:C)-stimulated CD3ε−NK1.1+NKp46+ NK cells from the spleen at week 2 post-transfer and cultured them with YAC1 cells at a 1:1 effector:target (E:T) ratio. EomeshiNKneg-derived cells degranulated in response to YAC1 cells, similar to control NK cells isolated from the spleen of EomesGFP mice (Fig. 8b).
Figure 8. EomeshiNKneg cells give rise to functional NK cells in vivo.

a, Intracellular ex vivo staining of TNF, GM-CSF and IFNγ after PMA and ionomycin stimulation for 4 hours of CD3ε−CD19−NK1.1+NKp46+ cells isolated from the liver of Rag2−/−IL2rg−/− mice transferred with ILCPs or EomeshiNKneg cells 2 weeks before analysis or liver CD3ε−NK1.1+DX5−CD49a+ ILC1 and CD3ε−NK1.1+DX5+CD49a− NK cells isolated from age-matched EomesGFP mice as controls. b, Degranulation (measured as percentage of CD107a expression) of CD45.1/CD45.2 CD3ε−NK1.1+ NK cells isolated from the spleen of CD45.2/CD45.2 Rag2−/−IL2rg−/− mice at week 2 post-intravenous injection with CD45.1/CD45.2 EomeshiNKneg cells and 18 hours post-priming with 200 μg of polyinosinic:polycytidylic acid and incubated ex vivo with YAC1 tumor cells at a ratio of 1:1 for 4h. Data are representative of three independent experiments. Data represent mean ± s.e.m. ****P < 0.0001. c, Quantification metastases in the lung right inferior lobe of Rag2−/−IL2rg−/− mice at day 12 post-intravenous injection with 50,000 B16-F10 cells in Rag2−/−IL2rg−/− mice were intravenously transferred with PBS control (n=5), ~800 ILCPs (n=3) or EomeshiNKneg cells (n=4) 10 days before the transfer of tumor cells. Data are representative of three independent experiments. Statistical significance was calculated by two-way ANOVA with Tukey’s multiple comparisons test. Data represent mean ± s.e.m. ****P < 0.0001.
NK cells limit the spread of B16F10 melanoma to the lung by IFNγ expression and direct cytolysis41, 42, 43. To test the ability of EomeshiNKneg cell-derived NK cells to clear B16F10 tumors, we intravenously transferred 800 EomeshiNKneg cells or ILCPs into sublethally irradiated Rag2−/−IL2rg−/− mice, followed by intravenous transfer of 50,000 B16F10 melanoma cells 10 days later. At day 12 post tumor-transfer, mice that had received EomeshiNKneg cells exhibited a lower tumor burden in the lungs compared to the mice that received ILCPs or PBS (Fig. 8c). These results indicated that EomeshiNKneg cells generated NK cells in vivo that produced IFNγ and were directly cytotoxic against YAC1 and B16F10.
DISCUSSION
Here, we showed that EomeshiNKneg cells, an immature Eomes-expressing population found in the BM and distinct from NK cells and ILC1, developed post-natally, expressed genes associated with both progenitor cells (Tcf7) and the NK cell lineage (Tbx21, Klrc1) and generated functional NK cells upon transfer into Rag2−/−IL2rg−/− recipients.
We found that previously proposed NK cell precursors, including pre-NKPs and rNKPs, were contaminated with PLZF+ ILCPs, confirming previous reports35. In addition, culture of progenitor cells including EILP and ILCP on OP9 cells, which have been used frequently to study the developmental potential of early lymphoid precursors, generated cells that did not reliably mirror the NK cells or ILC1 that develop in vivo. Our results are compatible with reports that a subset of ID2+ ILCP and a subset of ID2+NKG2A/C/E+ cells, which was proposed to be downstream of ILCP, retain ILC1 and NK potential16. The PLZFloEomeshiNKneg cells we identified here had dual ILC1 and NK cell potential. Our data suggest a model in which PLZFintEomesneg EILPs predominantly diverge into either PLZF+ ILCPs or EomeshiNKneg cells that, in turn, produce ILC1 or NK cells, respectively. Our observations suggest that this transition is noisy, with small fractions of each population co-expressing PLZF and Eomes, thereby driving the heterogeneous lineage potential observed in our in vivo transfer experiments. Notably, we found that expression of Eomes was associated with loss of ILC2 and ILC3 potential. The factors that control the balance of PLZF and Eomes, and the eventual fate of ILC1s versus NK cells among EILPs remain to be clarified. Eomes may influence the expression of PLZF in these progenitors, similar to its function in thymic NKT development44. In addition, given that TGF-β has been reported to suppress Eomes expression and promote ILC1 differentiation11, 43, 45, 46, our scRNA-seq data, which showed Tgfbr1 and Tgfbr2 transcripts in EILP, suggests that TGF-β might be a key cytokine that impacts cell fate decisions.
Although less automated than many trajectory inference methods, TopicVelo-based RNA velocity analysis allowed us to zero in on the distinct dynamics of an Eomes+ gene program associated with commitment to the NK lineage versus those of a gene program associated with ILCPs that give rise to ILC1s. These developmental processes were not apparent in the global analysis of transcriptional dynamics from scVelo, nor in the similarity-based relationships identified by PAGA. The TopicVelo analysis brought into focus our developmental model in which joint expression of both Eomes and PLZF confers dual NK and ILC1 potential but expression of only Eomes results in NK commitment. This approach may be useful for trajectory inference in other complex multifurcating systems with transcriptionally similar terminal states.
In conclusion, here we clarified the lineage relationships between early innate cell precursors and showed that the NK cell-committed BM precursor expresses Eomes. Although questions remain about the relationships among the precursors of early innate lymphocytes, our study will facilitate subsequent efforts to gain a more granular understanding of innate lymphocyte development.
METHODS
Mice
All experiments and animal use procedures were conducted in compliance with the National Institutes of Health Guide for the Care and Use of Laboratory Animals and were approved by the Institutional Animal Care and Use Committee at the University of Chicago. The mice used in this study were housed in in positively pressurized, individually ventilated cage racks within specific pathogen-free facilities at the University of Chicago. B6.SJL-Ptprca Pepcb/Boy (CD45.1; stock no. 002014), B6.129X1-Gt(ROSA)26Sortm1(EYFP)Cos/J (stock no. 006148) were obtained from The Jackson Laboratory. C57BL/6NTac.Cg-Rag2tm1Fwa Il2rgtm1Wjl (stock no. 4111) mice were obtained from Taconic. Zbtb16 +18/32Δ/Δ, PLZFGFPCre, RORcThy1.1, Tcf7mCherry mice were generated as previously described5, 18, 47. Zbtb16hCD4 mice were generated via CRISPR/Cas9-mediated insertion of IRES-truncated human CD4 cassette into the 3’UTR region of Zbtb16 locus. EomesGFP mice were provided by Dr. T. Walzer (Université Claude Bernard Lyon 1, France). C57BL/6J mice were maintained in-house. Mice were 4–10 weeks of age when analyzed and were compared to sex-matched littermate controls. Fetus were analyzed at E14.5.
Preparation of cell suspensions
Femur, tibia, and ilium bones were harvested, cut open and crushed. BM cells were then passed through a 70-μm cell strainer and resuspended in FACS buffer. Spleens were prepared by passing through a 70-μm cell strainer and resuspending in FACS buffer. Adult livers were harvested, passed through a 70-μm cell strainer, and the fat was removed with centrifugation in 0.45% Percoll (Millipore-Sigma). Adult lungs were perfused with PBS, cut into pieces, digested at 37 °C in RPMI medium (HyClone) supplemented with 650 U/mL Collagenase A (Roche) and 0.01% DNase (Millipore-Sigma), filtered with 70-μm cell strainer, and centrifuged in 0.45% Percoll. RBCs in liver, spleen and lung cells were removed with 1× RBC lysis buffer (ThermoFisher).
Adoptive transfer
400–800 BM precursors of interest were sorted using FACSAria Fusion (BD Biosciences) to >95% purity, resuspended into PBS containing 10% heat-inactivated FCS, and washed with PBS before injection. Cell suspensions were aspirated with a syringe and injected retro-orbitally into 6–10-week-old sub-lethally irradiated (450 rad) CD45.2 Rag2−/−IL2rγ−/− mice. Recipient mice were euthanized and analyzed 2 weeks post-transfer.
For competitive transfer experiment, 500 CD45.1/45.2 EomeshiNKneg cells sorted from 3–5 mice were mixed with equal number of CD45.2/45.2 BM precursors sorted from 3–5 sex-matched mice and injected into CD45.2 Rag2−/−IL2rg−/− mice. For PLZF fatemapping experiment, ~30 × 10^3 YFP−Lin−Sca-1+cKit+ (LSK) cells from PLZFGFPCre/+ROSA26fl-STOP-fl-YFP/+ mice were sorted and injected retro-orbitally into lethally irradiated (1,000 rad) CD45.1 recipients. Progeny were analyzed 5 weeks after the transfers.
Flow cytometry
Single-cell suspensions were incubated with BD FcBlock for 10 min on ice before staining of antibodies. BM lineage positive cells were stained with 1:200 diltuions of APC-cy7 conjugated antibodies against CD3ε (145–2C11), CD4 (GK1.5), CD8α (53–6.7), TCRβ (H57–597), TCRγδ (GL3), CD19 (1D3), B220 (RA3–6B2), GR-1 (RB6–8C5), CD11c (N418), CD25 (PC61) and Ter119 (TER-119) on ice for 30 min, followed by 30 minutes incubation with anti-Cy7 microbeads (Miltenyi Biotec). Lineage+ Bead-bound cells were depleted from the sample with autoMACS (Miltenyi Biotec) using depletion-sensitive program. Zombie yellow Fixable Viability Dye (BioLegend) or LIVE/DEAD Fixable Near-IR (Invitrogen) was used to exclude dead cells. The following fluorochrome-conjugated antibodies were used for analysis: α4β7 (DATK32, 1:200 dilution), CD11b (M1/70, 1:200 dilution), CD11c (N418, 1:200 dilution), CD45.1 (A20, 1:200 dilution), CD45.2 (104, 1:400 dilution), CD90.1(OX-1, 1:300 dilution), CD90.2 (53–2.1, 1:300 dilution), CD127 (A7R34, 1:50 dilution), ICOS (C398.4A, 1:200 dilution), PD-1 (29F.1A12, 1:200 dilution), hCD4 (RPA-T4, 1:200 dilution), Sca-1(D7, 1:200 dilution), cKit (2B8, 1:200 dilution), NK1.1 (PK136, 1:100 dilution), NKp46 (29A1.4, 1:100 dilution), DX5 (DX5, 1:100 dilution), CD49a (Ha31/8, 1:200 dilution), CD122 (TM-β1, 1:200 dilution), CD200r (OX-110, 1:200 dilution), CD244 (m2B4, 1:200 dilution), TRAIL (N2B2, 1:200 dilution), CD69 (H1.2F3, 1:200 dilution), KLRG1 (2F1, 1:200 dilution), NKG2A/C/E (20D5, 1:50 dilution), NKG2D (CX5, 1:200 dilution), Ly49H (3D10, 1:200 dilution), Ly49C/I/F/H (14B11, 1:200 dilution), SELL (MEL-14, 1:200 dilution), Eomes (Dna11mag, 1:200 dilution), T-bet (4B10, 1:100 dilution), IFNg (XMG1.2, 1:100 dilution), TNF (MP6-XT22, 1:200 dilution), GM-CSF (MP1–22E9, 1:100 dilution), Perforin (S16009B, 1:400 dilution), GranzymeB (QA16A02, 1:200 dilution), and CD107a (1D4B, 1:1000 dilution), mCD1d-PBS-S7 (36599, 1:200 dilution). Samples were analyzed on a five-laser Cytek Aurora (Cytek) with Cytek SpectroFlo v3.1. For cells sorting, amples were processed on a 70-μm nozzle carrying FACSAria Fusion (BD Biosciences) or Bigfoot (Invitrogen) with BD FACSDiva v8.0.1. Intracellular staining was performed using the Foxp3 Transcription Factor Staining Buffer Kit (ThermoFisher) for transcription factor staining or Cyto-Fast Fix/Perm Buffer Set (BioLegend) for intracellular cytokine staining, according to the manufacturer’s instructions. BD FlowJo v10.8.1 (TreeStar) was used for analysis. For clustering, compensated files were concatenated, transformation, followed by dimensionality reduction with UMAP algorithm. Unsupervised clustering was calculated, visualized and analyzed with FlowSOM and Cluster Explorer functions in FlowJo.
OP9 and OP9-DL1 stromal cell culture
OP9 cells were acquired from ATCC (CRL-2749), maintained in Opti-MEM supplemented with GlutaMAX (Gibco) containing heat-inactivated 10% FBS, 1% penicillin-streptomycin (Gibco), and 60 μM 2-mercaptoethanol (Millipore-Sigma) in a 37°C incubator (ThermoFisher) with 5% CO2. OP9 cells were plated at a density of 5000/15,000 cells per well in a 96/48-well plate, allowed to grow overnight, and then irradiated at 1500 rad to prevent overgrowth. 50–100 (bulk culture) BM precursors of interest were sorted and seeded on top of OP9 cells. For single cell culture, BM precursors of interest were directly sorted into 96 well plate. Cultured cells were analyzed up to 7 days later in the presence of murine stem cell factor (SCF, 25 ng/ml; BioLegend), IL-7 (25 ng/ml; BioLegend), and IL-2 (25 ng/ml; BioLegend).
Isolation and in vitro stimulation of liver group 1 ILCs
Group 1 ILCs in the liver were stained with APC-cy7 anti-NK1.1 and anti-cy7 microbeads (Miltenyi Biotec), and enriched by double positive selection. Enriched group 1 ILCs were resuspended in RPMI medium 1640 (HyClone) containing 10% FCS (Atlanta Biologicals), stimulated with phorbol 12-myristate 13-acetate (PMA; 20 ng/mL) and ionomycin (5 μg/mL) for 4 h at 37 °C in the presence of 1μg/ml GolgiStop (BD) and 1μg/ml GolgiPlug (BD). Samples were stained for surface markers, fixed and permeabilized by using the Cytofix/Cytoperm kit (BD), and followed by intracellular cytokine stainings.
B16F10 melanoma cultures and tumor model
B16F10 line was a gift from Dr. Thomas F. Gajewski (University of Chicago, IL) and were maintained in Dulbecco’s Modified Eagle’s Medium with 10% FCS and penicillin-streptomycin (Gibco). Tumor cells were detached using 0.05% Trypsin-EDTA (Gibco) and washed twice in complete medium before injection. 5 × 10^4 cells in PBS were transferred via retro-orbitally injection. Lungs were harvested 12 days after intravenous administration, fixed and decolorized in Fekete’s solution (3% formaldehyde, 4% glacial acetic acid, 58% ethanol). Numbers of metastatic foci/nodules in the right lung were quantified under a microscope.
Tumor co-culture
YAC1 cells were obtained from ATCC (TIB-160) and maintained in RPMI medium 1640 (HyClone) supplemented with 10% FCS (Atlanta Biologicals) and penicillin-streptomycin (Gibco). Mice were intraperitonealy injected with 200 μg polyinosinic:polycytidylic acid (P1530; Sigma) or PBS control. 24 h later, spleen cells from primed mice were stained with biotin-conjugated antibodies against CD3, TCRβ, TCRγδ, CD19, B220, GR1, CD11c, Ter119, washed, and then incubated with anti-biotin microbeads (Miltenyi Biotec). Spleen NK cells were enriched by negative selection sensitive mode with AutoMACs, and then cultured with CellTrace Blue (Invitrogen)-labeled YAC1 cells at 1:1 effector to target (E:T) ratios for 4 hours at 37°C in the presence of anti-CD107a. For target killing experiment, NK1.1+ cells in the cultured were counted by flow cytometry and cocultued with CellTrace Blue-labeled YAC1 cells at 1:1 E:T ratios for 4 hours at 37°C. Cell death was measured by flow cytometry using 7-aad (Invitrogen) incorporation.
Single-cell RNA-sequencing
Tcf7-mCherry+ precursors and NK1.1+ mature cells were sorted from Tcf7mCherry/+EomesGFP/+Zbtb16hCD4/+RorcThy1.1/+ mice BM and pooled. For sample pooling, Tcf7-mCherry+ precursors, EomeshiNKneg cells and NK cells/ILC1s were sorted separately and mixed to get a final ratio of 15:3:2, respectively. GEMs were generated by the Chromium Controller (10X Genomics). GEM RT Incubation, Post GEM-RT Cleanup, cDNA amplification, and Gene Expression Library Construction were performed as described in the Single Cell 3’ Reagent Kits User Guide v3.1 RevD (10X Genomics). Library construction for three samples corresponding to 3 single cell captures containing pooled cells from from three sets of mice (n=11, n=12, n=12, total=35) were preformed simultaneously. Prior to sequencing, the three single-cell libraries were quantified using the KAPA Library Quantification Kit for Illumina Platforms (Roche, 501965234) and pooled in an equimolar ratio. Libraries were sequenced 100 base pair paired-end (R1: 28 cycles, i7: 10 cycles, i5:10 cycles R2: 90 cycles) on an Illumina NovaSeq 6000.
scRNA-seq data processing and quality control filtering
Sample-specific matrices of spliced transcript counts were obtained using cellranger count (10X Genomics CellRanger 6.1.2)48. Further filtering was performed using the R programming language (version 4.3.1). Quality control filtering steps were then performed to reduce potential doublets, empty droplets, and mitochondrially stressed cells. Specifically, outlying cells on the sample-specific distribution of percent mitochondrial RNA per cell were eliminated, which removed about 20% of each sample (2,811 out of 13,760, 1,817 out of 10,717, and 3,645 out of 18,256 cells for samples 1, 2, and 3, respectively; a cell was removed if over 10% of its detected transcripts were mitochondrial). Outlying cells in the sample-specific joint distribution of the log of the number of unique genes detected per cell and the log of the number of transcripts detected per cell were also removed. About 5% of each sample (760 out of 13,760, 470 out of 10,717, and 737 out of 18,256 cells respectively for samples 1, 2, and 3) was removed in this step, with the majority of outlying cells presenting as possible empty droplets due to unexpectedly low numbers of transcripts and unique genes. Few potential doublets were removed due to a lack of clear outlying cells with especially high total counts and number of unique genes. To further account for potential doublets, the three samples were merged and two cycles of normalization, dimensionality reduction, and clustering were performed (detailed below). In each cycle, clusters with particularly high or low count and feature distributions were identified as additional potential doublets or empty droplets and filtered out of the dataset. These cycles removed a total of 249 possible doublets and 1,980 possible empty droplets at approximately equal proportion from each sample, leaving 31,774 cells for downstream analysis. Notably, few doublets were detected, even with these additional steps. We concluded that if doublets were still present, they were unlikely to drive strong cluster-specific differences, and we cautiously proceeded with analysis.
In the next cycle of preliminary analysis on the combined data (Extended Data Fig. 2a,b), we identified clusters of cells with especially high expression of T cell receptor and VDJ recombination-related genes (annotated “Cd3 0”, “Cd3 1”; comprising 4,140 and 2,668 cells out of 31,774 total cells, or 13% and 8.4% of the dataset, respectively) and genes likely expressed only in other hematopoietic lineages (annotated “unclassified 0”, “unclassified 1”, “unclassified 2”; comprising of 721, 395, and 296 cells, or 2.3%, 1.2%, and 0.9% of the dataset). These clusters were removed from downstream analysis. We also noticed clusters expressing proliferation-associated genes (annotated “ILC2P prolif.”, “type 1 prolif.”, and “other prolif.”; comprising 761, 320, and 1,707 cells, or 2.4%, 1.0%, and 5.4% of the dataset) which generally included cells with higher number of counts and features, possibly explaining the lack of detectable doublets in earlier filtering stages (Extended Data Fig. 2c,d). While it is common practice to try to mitigate the effects of cell proliferation on single-cell data by statistically modeling and removing such effects49, 50, 51, we avoided this route out of concern for potentially misinterpreting results and their downstream impact on the lineage analysis. Hence, we removed these clusters and focused on decoding the differentiation trajectories among the non-proliferating cells. A fifth analysis cycle identified a small number of remaining proliferating cells (244 cells, corresponding to 1.2% of the dataset) that were also removed, resulting in a final number of 19,961 cells for downstream analysis.
To once again reduce the possibility that doublets were majorly contributing to variation in the dataset, we visualized the total number of transcript counts and number of unique transcipts in the final analysis and observed no clear population with abnormally high counts or unique transcripts (Extended Data Fig. 2e,f).
scRNA-seq normalization, integration, dimensionality reduction, and clustering
Sample-specific count matrices were merged and normalized together using the SCTransform function from the R package Seurat (version 5.0.1)52. Next, principal component analysis (PCA) was performed on the mean-scaled Pearson residuals from the SCTransform fit (RunPCA, Seurat). Principal components (PCs) 1 and 2 were plotted to check that no small set of cells or sample-specific differences were contributing to the majority of the variance, and PC eigenvalues were visualized in an elbow plot to determine the top number of PCs to use for downstream analysis. For the final analysis (Figs. 1–3, 7; Extended Data Figs. 2, 3, 6, 7), the top 17 PCs were selected. A k-nearest neighbor graph, Louvain clustering, and UMAP embedding were then computed with Seurat. Ten nearest neighbors were used for these calculations, based on several transitional populations identified in the data (EILP to sEILP2, ILCP to intermediate ILC, Eomes+ progenitor to NK, and cells on the boundary between Eomes+ progenitor and ILC1) that were not well characterized by the higher default parameter values. Several different clustering resolutions were also applied for each analysis cycle, and clustering resolution for subsequent analysis downstream was selected based on how well the clusters characterized gene expression profile patterns in a differential expression analysis (details below), with a preference toward lower resolution (lower number of clusters) to avoid overfitting. Numbers of transcripts and of unique genes detected per cell were visualized on a log scale using the UMAP and cluster classifications to determine whether any clusters were likely to mostly consist of doublets or empty droplets. Additionally, sample-specific cells were visualized on the UMAP to coarsely identify sample-specific effects. Initial cycles of analysis revealed no substantial sample-specific effects relative to the effects of other sources of variation, but in the final analysis cycle, some sample-specific differences were observed, particularly in the ILCP cluster. Thus, Harmony (version 1.2.0)53 was run on the top 50 PCs to integrate the samples and reduce sample-specific variation. Then an elbow plot was constructed from Harmony dimension eigenvalues, and dimensions 1 through 17 were selected for a second round of UMAP, nearest neighbor, and clustering calculations. To determine the clusters for cell type annotation (Fig. 1), a global Louvain clustering resolution of 0.1 largely characterized the known gene expression profiles of relevant populations but combined into a single cluster the ILC1, Rorc APC, sEILP2, and intermediate ILC subpopulations described in the main text; hence, this cluster was then sub-clustered separately.
scRNA-seq differential expression analysis and cell type annotation
Differential expression analysis was performed for several clustering resolutions using a likelihood ratio test from the R package DESeq2 (version 1.42.0)54 with raw transcript counts “pseudo-bulked”, or aggregated, by each unique combination of sample and cluster labels55. For cluster annotation, genes were tested for differential expression in transcript counts aggregated across all cells from a particular cluster independently for each sample compared to transcript counts aggregated across all cells not in that particular cluster, again independently for each sample (Fig. 1b). For comparing a subset of populations, differential expression was similarly evaluated between aggregated counts across all cells in a given population and sample versus aggregated counts across all cells in each sample in other populations in the subset (Fig. 2a, Fig. 3e). P values were adjusted for multiple hypothesis testing using the Benjamini-Hochberg method. Genes included in dotplots were required to have an adjusted p value of less than 0.05 and an absolute log-fold change of at least 0.5, with the vast majority of included genes having an absolute log-fold change of greater than 1, for at least one population included in the plot (Fig. 1b, Fig. 2a, Fig. 3e; see Supplementary Table 1 for all differential expression tests performed).
scRNA-seq PAGA estimation
Prior to partition-based graph abstraction (PAGA)38 estimation, as suggested in the documentation, a 15-component diffusion map was created from the PCA-based 10-nearest neighbors graph of the scRNA-seq data with the tl.diffmap scanpy function56 (version 1.9.3) in Python (version 3.8.17). A k-nearest neighbors graph, again using 10 neighbors, was calculated from the diffusion components and then used to calculate the PAGA via the pp.neighbors and tl.paga functions from scanpy. The PAGA was visualized using a connectivity threshold more conservative than the default (0.02) to focus on the stronger estimated connectivities.
scRNA-seq RNA velocity analysis
Spliced and unspliced transcript counts were determined using the run10x command from velocyto (version 0.17.17)57. Topic modeling was then performed on all cells remaining after the final quality control filtration cycle (above) using the R package fastTopics (version 0.6–142)58, 59 on spliced and unspliced counts, as described in the TopicVelo publication40 (Extended Data Fig. 8a). A range of values were used for the topic number parameter; the final model used eleven topics, based on good topic coherence values40 and capture of the Eomes+ progenitor population. The lowest possible number of topics with good topic coherence (nine) was also considered, but these topics merged the Eomes+ progenitor topic (topic 7 out of 11) with a closely related Nfil3+ topic (topic 9 out of 11), which velocity analysis (below) indicated had vastly different dynamics.
Spliced and unspliced gene counts were normalized and smoothed across ten nearest neighbors using the filter_and_normalize and moments functions from Python (version 3.8) package scVelo (version 0.2.5)39. Global scVelo velocity, transition matrix estimates, and streamline visualizations were then calculated using the velocity and velocity_embedding_stream functions from the scVelo package.
Next, we used the “least extreme” differential expression analysis method in fastTopics60 to determine topic-specific genes, selected as those genes with a mean posterior log-fold change greater in absolute value than 0.5 and a local false sign rate of less than 10−30 (Supplementary Table 3). These thresholds were chosen conservatively to improve signal and resulted in a few hundred topic-specific genes for most topics.
We used the final topic model for RNA velocity and transition matrix estimation with TopicVelo40. Topic-specific membership thresholds for velocity ranged from the 42.5th to the 77.5th percentile, depending on the topic and the set of cells used for RNA velocity estimation (Supplementary Table 4). The thresholds were determined by selecting percentiles that, across the top ten topic genes (those with the lowest local false sign rate), balanced minimizing two KL divergences: the KL divergence comparing the joint distribution of the spliced and unspliced expression of a gene in the cells above a given percentile threshold to the joint distribution of spliced and unspliced gene expression in all cells in the dataset, and the KL divergence of the joint distribution of the spliced and unspliced expression of a gene in the cells below a given percentile threshold compared to, again, the gene’s joint distribution of spliced and unspliced counts in all cells. This protocol is documented in depth in the TopicVelo manuscript40.
We present two RNA velocity and transition matrix estimations, one that is focused on progenitor transitions to NK and ILC1 (the “focused” analysis; Fig. 7d, Extended Data Fig. 7c), and one that globally evaluates dynamics in the dataset (the “global” analysis; Extended Data Fig. 7d).
For the global analysis, RNA velocity and transition matrix estimation was performed on all cells using all topics, with the exception of a broadly expressed topic featuring ribosomal genes (topic 3 of 11; Extended Data Fig. 8a). For this estimation, cells with a topic weight above the 97.5th percentile for a topic were considered in the steady state of that topic.
For the focused analysis, we first aimed to isolate a set of cells including those in the EILP and ILCP clusters that could potentially express Eomes, PLZF, and PD1 at the protein level, and those in clusters directly relevant for NK and ILC1 commitment (i.e., Eomes+ progenitor, NK, ILC1, Rorc APC, and intermediate ILC clusters). To this end, we performed fine-grained Louvain clustering with a resolution of 1. Fine-grained clusters were included in the focused analysis if many of the cells in the cluster expressed all three of Eomes, Zbtb16, and Pdcd1, or if they were a subset of the coarse clusters discussed above (Eomes+ cells, NK, ILC1, Rorc APC, and intermediate ILC). To ensure representative velocity estimation, cells were also removed if the sum of the cell’s topic weights in all topics included in the model was less than 0.1.
Focused RNA velocity analysis was then performed using topics 5, 6, 7, and 8, which characterized the ILCP, ILC, Eomes+ cells, and NK programs of interest, as well as topic 1, which described a cell cycle program that appeared important for Eomes+ and ILC2P terminal lineage commitment. This cell cycle program was notably distinct from the proliferation programs described above in that it often appeared as a separate topic and, to the best of our knowledge, did not as strongly influence clustering of otherwise transcriptionally distinct populations in the same way. However, given the distribution of the cell cycle topic on the UMAP embedding, with cells with higher topic weights appearing farther away from the central progenitor populations (Extended Data Fig. 8a), we speculated that it influenced the embedding enough that it would be important to include in velocity analysis to achieve representative streamlines. Due to lower cell number in the subset used for the focused analysis (9,798 cells, compared to the full dataset of 19,961), to maintain a reasonable number of cells for steady state estimation, the topic steady state membership threshold was lowered to the 95th percentile for all topics. The focused topic-specific transition matrices and their streamline visualizations were consistent with those in the focused and global integrated transition matrices, with the distinct gene programs displaying expected dynamics (Extended Data Fig. 8b; e.g., the Eomes+ progenitor topic flows away from the central EILP and ILCP clusters).
Cytokine receptor expression analysis
The KEGG pathway “Cytokine-cytokine receptor interaction” (mmu04060)61 was used to determine which cytokine receptor transcripts were expressed in EILP. Specifically, the genes in the pathway were downloaded using the getGenesets function from the EnrichmentBrowser package (version 2.32.0) in R62. A gene was considered expressed in the EILP cluster if greater than 10% of the cells in the cluster expressed it. Cytokines (as opposed to their receptors) were manually removed from the resulting gene list (Supplementary Table 2).
Statistics and reproducibility
All experimental findings were reliably reproduced with at least three biologically independent replicates for all experiments (except for cytokine release test which was performed only once). No statistical method was used to predetermine sample size. The number of replicates performed was determined based on those of previous related studies5, 16, 17, 36.No animals or samples were excluded from the analysis. No randomization method was used. Data collection and analysis were not performed blind to the conditions of the experiments. All controls and perturbations were performed on sex-matched littermates. All experimental and bioinformatic processing for control and perturbation groups was performed identically, together and in parallel for each replicate. All statistical tests performed were nonparametric. Data distribution was assumed to be normal, but this was not formally tested. Student’s t-test, multiple t-tests controlling for false discovery rate, and two-way ANOVA with Tukey’s multiple comparisons correction were performed in GraphPad Prism 8.
Extended Data
Extended Data Fig. 1. Gating strategies for BM precursors.
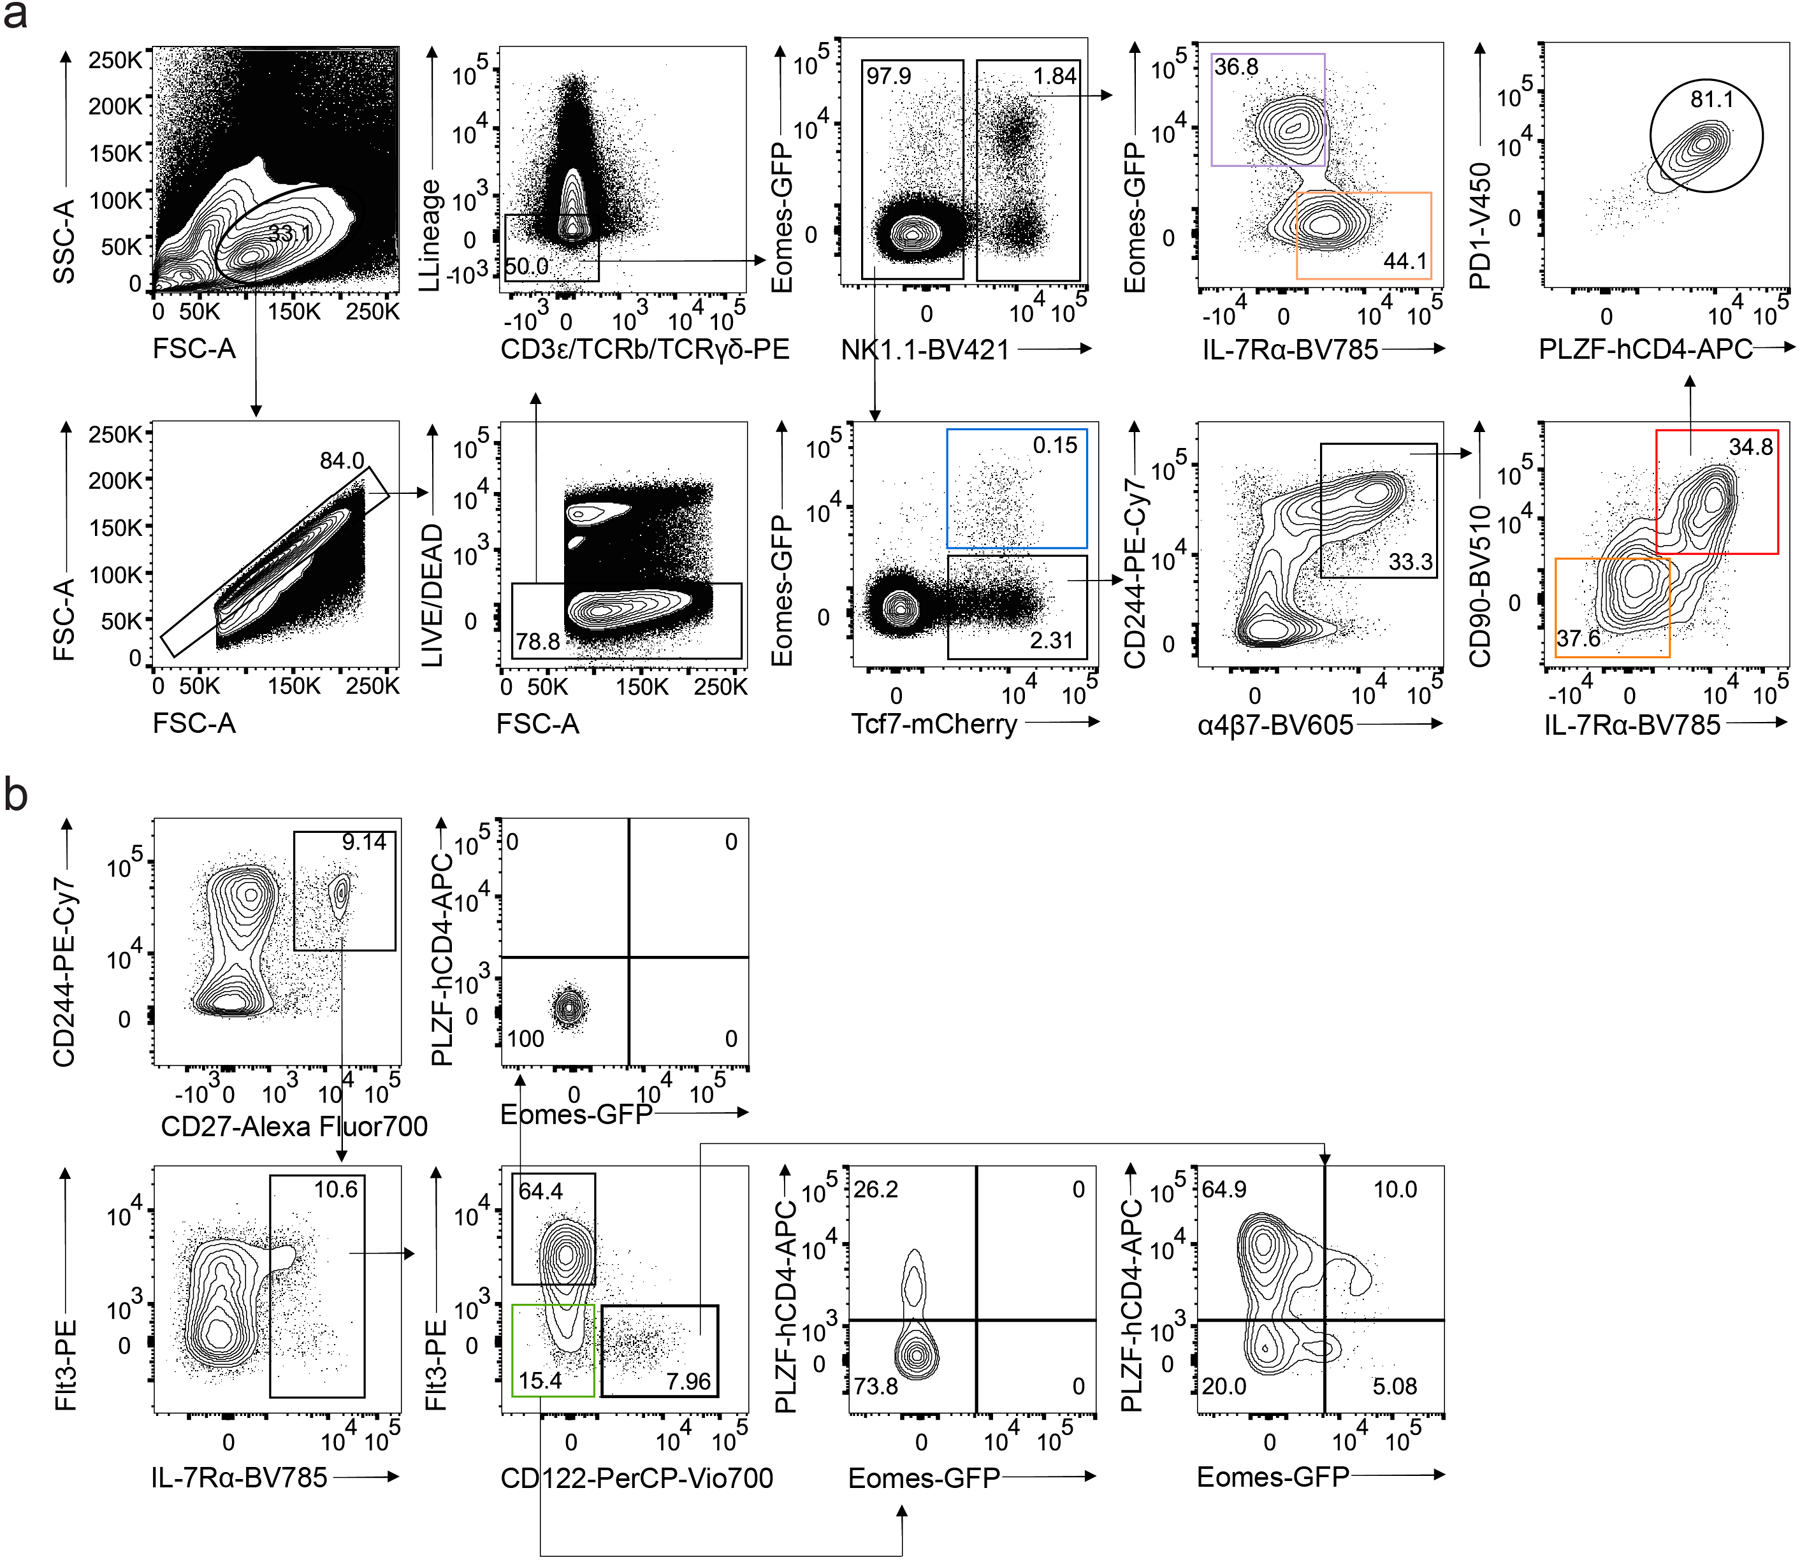
a, Gating strategy used for identifying NK1.1+Eomes-GFP+IL-7Rα− NK cells, NK1.1+Eomes-GFP−IL-7Rα+ ILC1s, NK1.1−Eomes-GFP+Tcf7-mCherry+ EomeshiNKneg cells, Tcf7-mCherry+α4β7+CD244+IL-7Rα−CD90− EILPs, and Tcf7-mCherry+α4β7+CD244+IL-7Rα+CD90+PD1+ ILCPs among CD4−CD8−CD3ε−TCRβ−TCRγδ−CD19−B220−Gr1−CD11c−CD25−Ter119−(Lin−) cells isolated from the BM of Tcf7mCherry/+EomesGFP/+Zbtb16hCD4/+RorcThy1.1/+ mouse by flow cytometry. b, Gating strategy used for identifying CD244+CD27+IL-7Rα+Flt3– preNKP and CD244+CD27+IL-7Rα+Flt3–CD122+ rNKP among CD4−CD8−CD3ε−TCRβ−TCRγδ−CD19−B220−Gr1−CD11c−CD25−Ter119−(Lin−) cells isolated from the BM of Tcf7mCherry/+EomesGFP/+Zbtb16hCD4/+RorcThy1.1/+ mouse by flow cytometry as in a.
Extended Data Fig. 2. scRNA-seq annotation and data filtering.
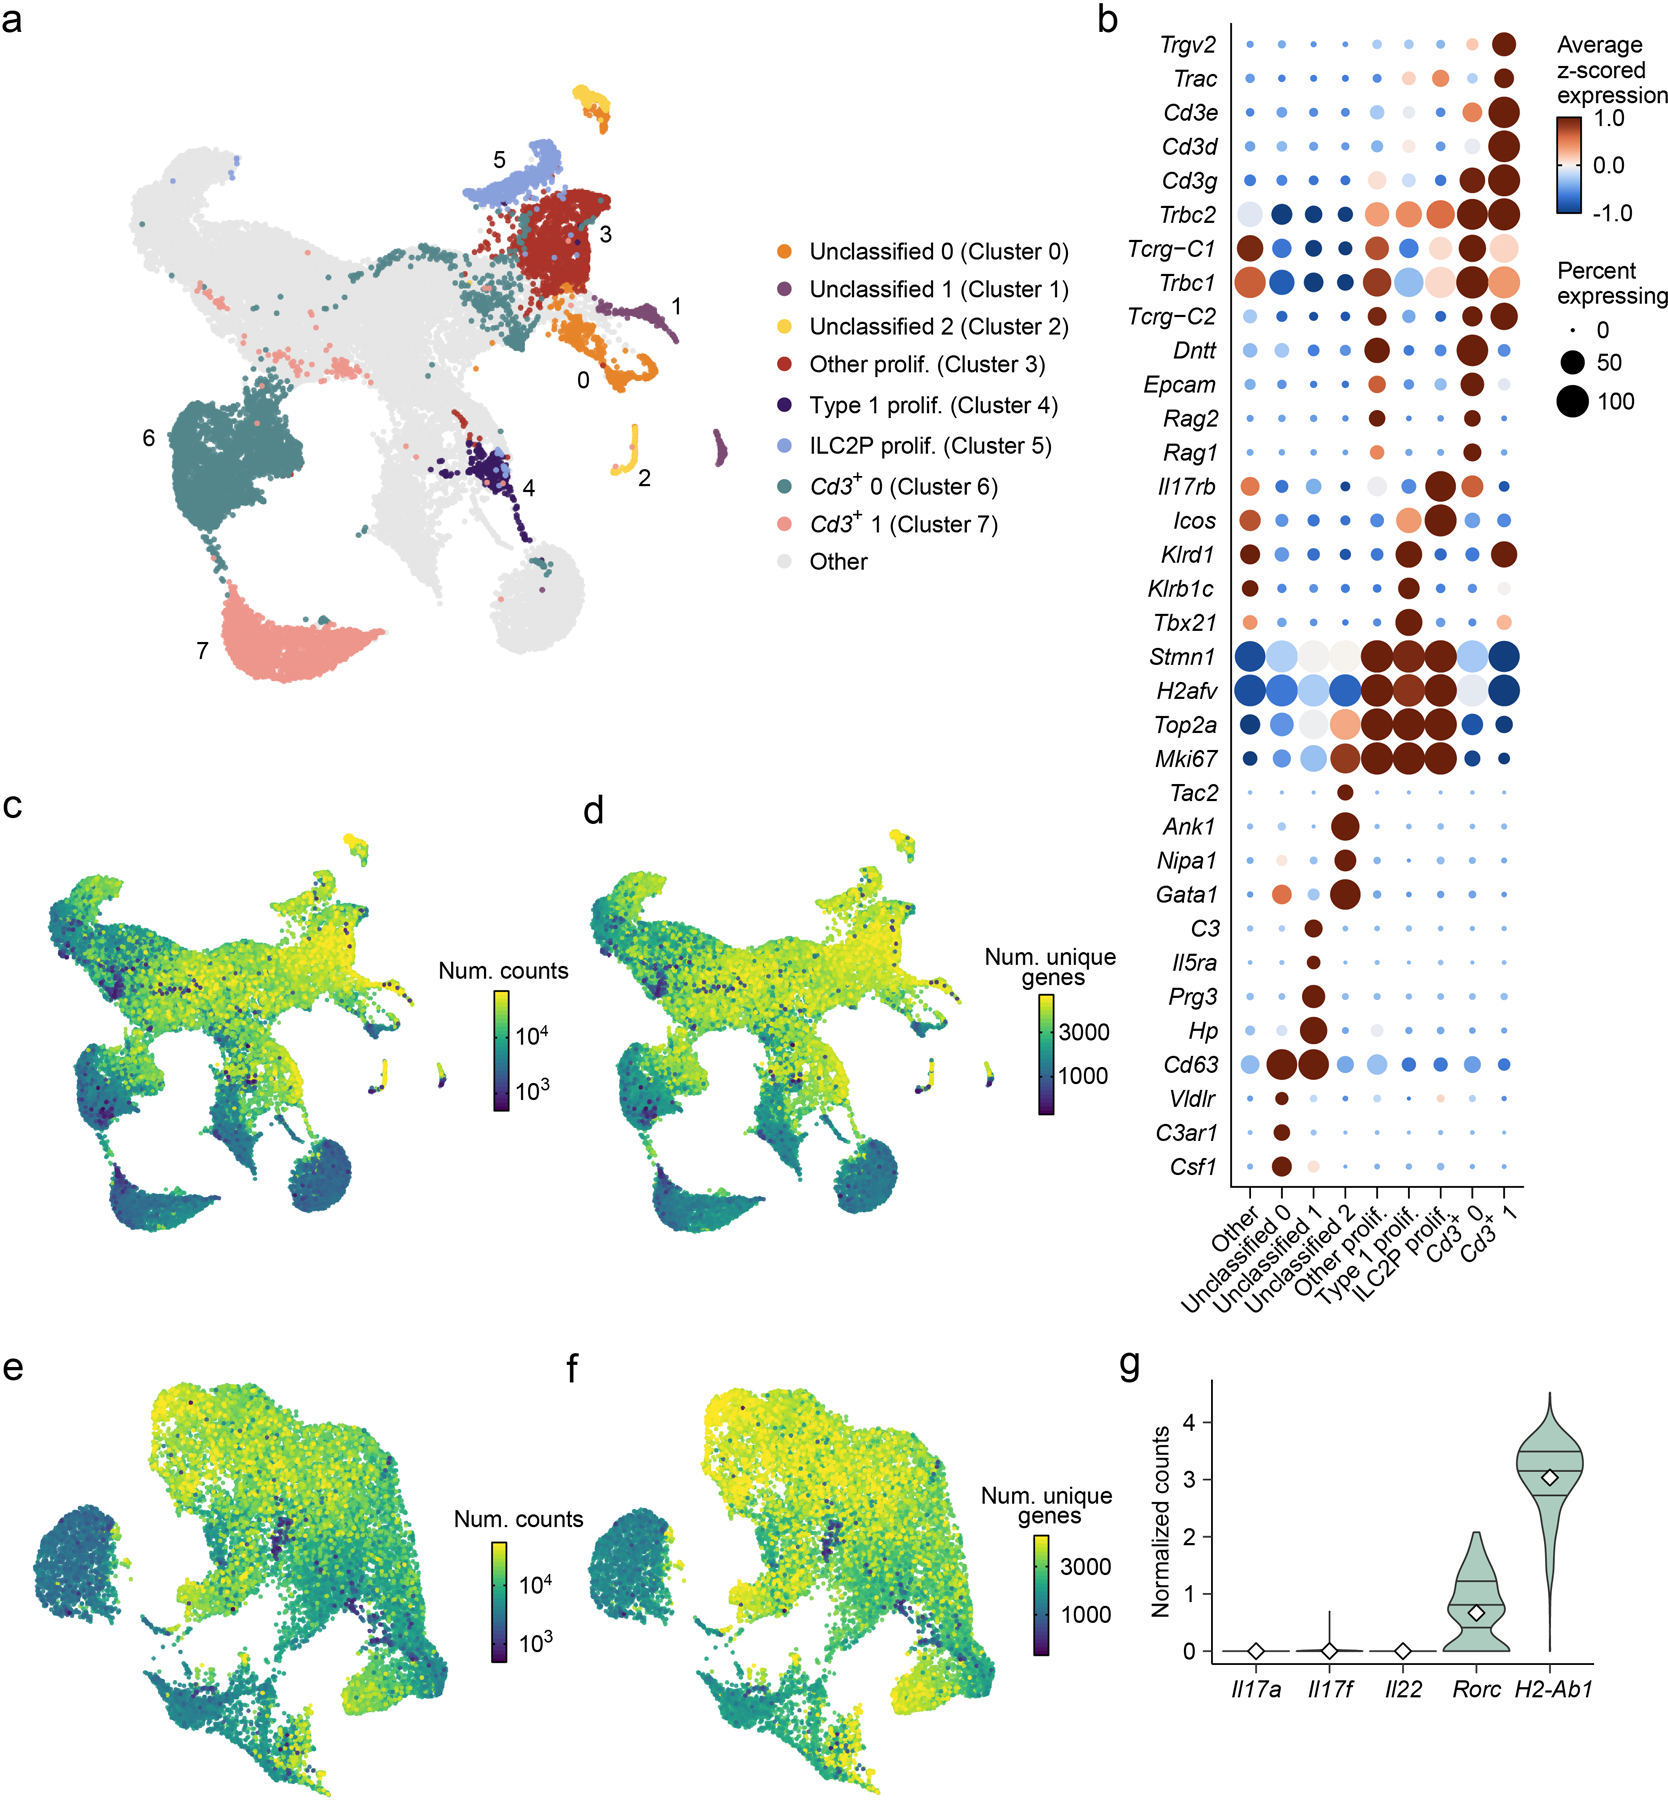
a, UMAP embedding of scRNA-seq data shows a combined total of 31,774 cells from the BM of 35 mice, with cells annotated by cluster (color, index number) if the cluster was removed prior to downstream analysis, and colored gray otherwise, i.e., if the cells were maintained for downstream analysis (e.g., Figs. 1–3, 7). b, Dot plot shows expression (dot color, size, as in Fig. 1b) of genes differentially expressed in annotated clusters (x axis) compared to all other clusters (“Other”) in the dataset. FDR-adjusted P < 0.05; abs. log2FC > 0.5. c, d, UMAP embedding as in a colored by the log10 of the total number of unique molecular identifiers (UMIs), indicating unique transcript molecules €, and by the log10 of the total number of unique genes encoded by the transcripts detected (d). e, f, UMAP embedding of filtered scRNA-seq data (as in Fig. 1a) colored by the log10 of the total number of unique molecular identifiers (UMIs), indicating unique transcript molecules €, and by the log10 of the total number of unique genes encoded by the transcripts detected (f). Points in c-f, corresponding to cells, are plotted in ascending order of their deviation from the median color value, such that the extreme values are displayed at the forefront. g, Violin plots show log of size-normalized expression (Methods) of curated genes in the Rorc+ APC cluster (Fig. 1a). Horizontal lines in violins denote the 25th percentile, median, and 75th percentile of normalized expression, while white diamonds denote the mean.
Extended Data Fig. 3. preNKP, rNKP, and aceNKP markers do not identify a transcriptionally distinct population in scRNA-seq data.
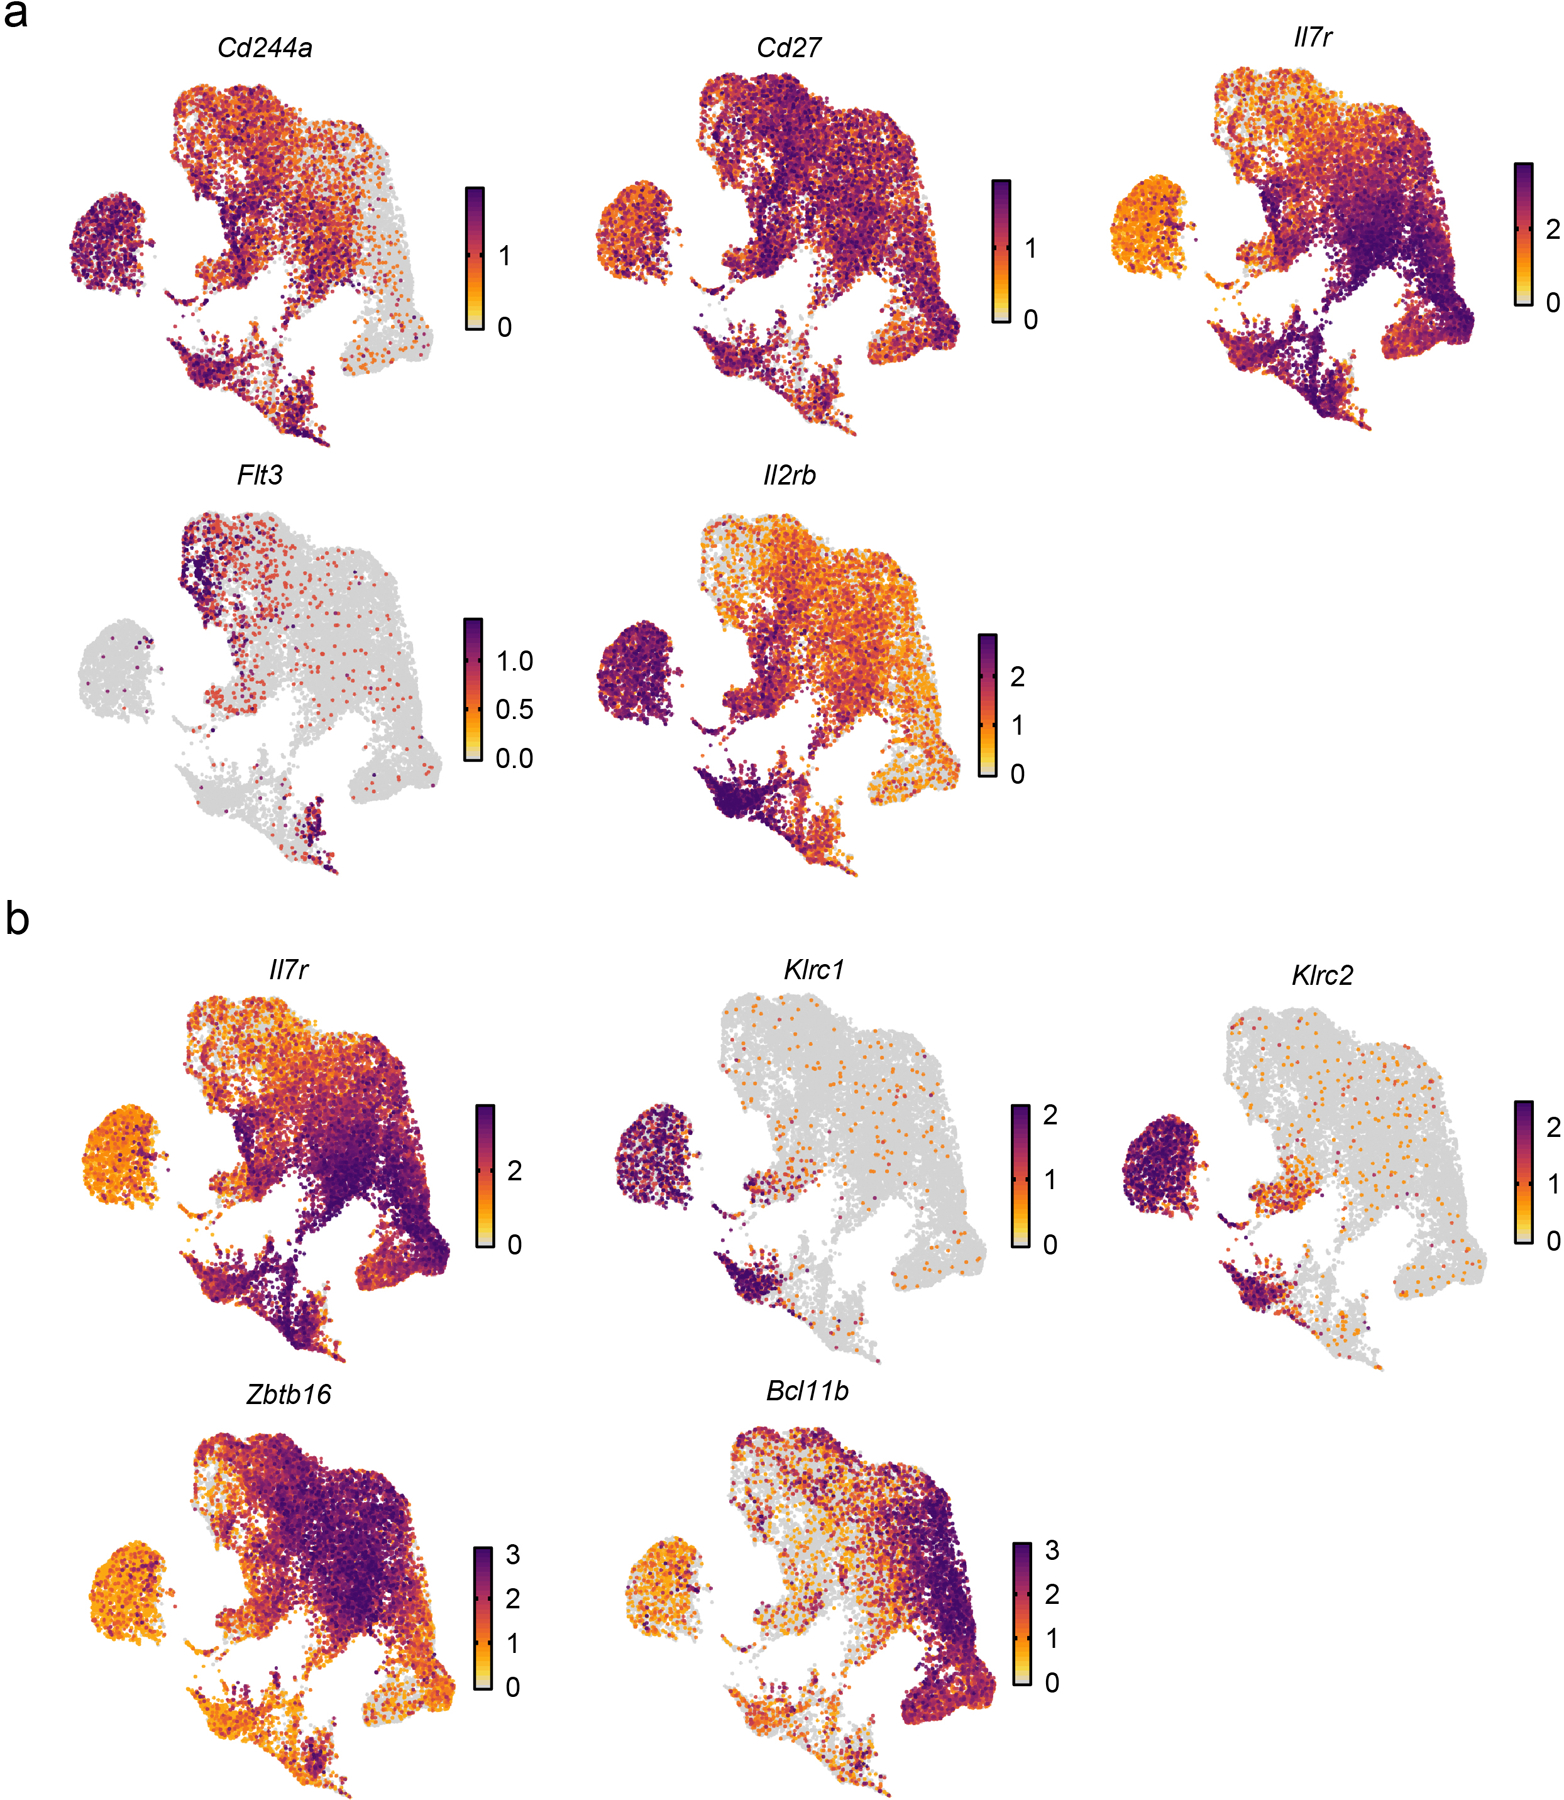
a,b, UMAP embeddings (as in Fig. 1a), with cells colored by normalized expression of pre-NKP and rNKP markers (a), and aceNKP markers (b).
Extended Data Fig. 4. EomeshiNKneg develop independently of PLZF.
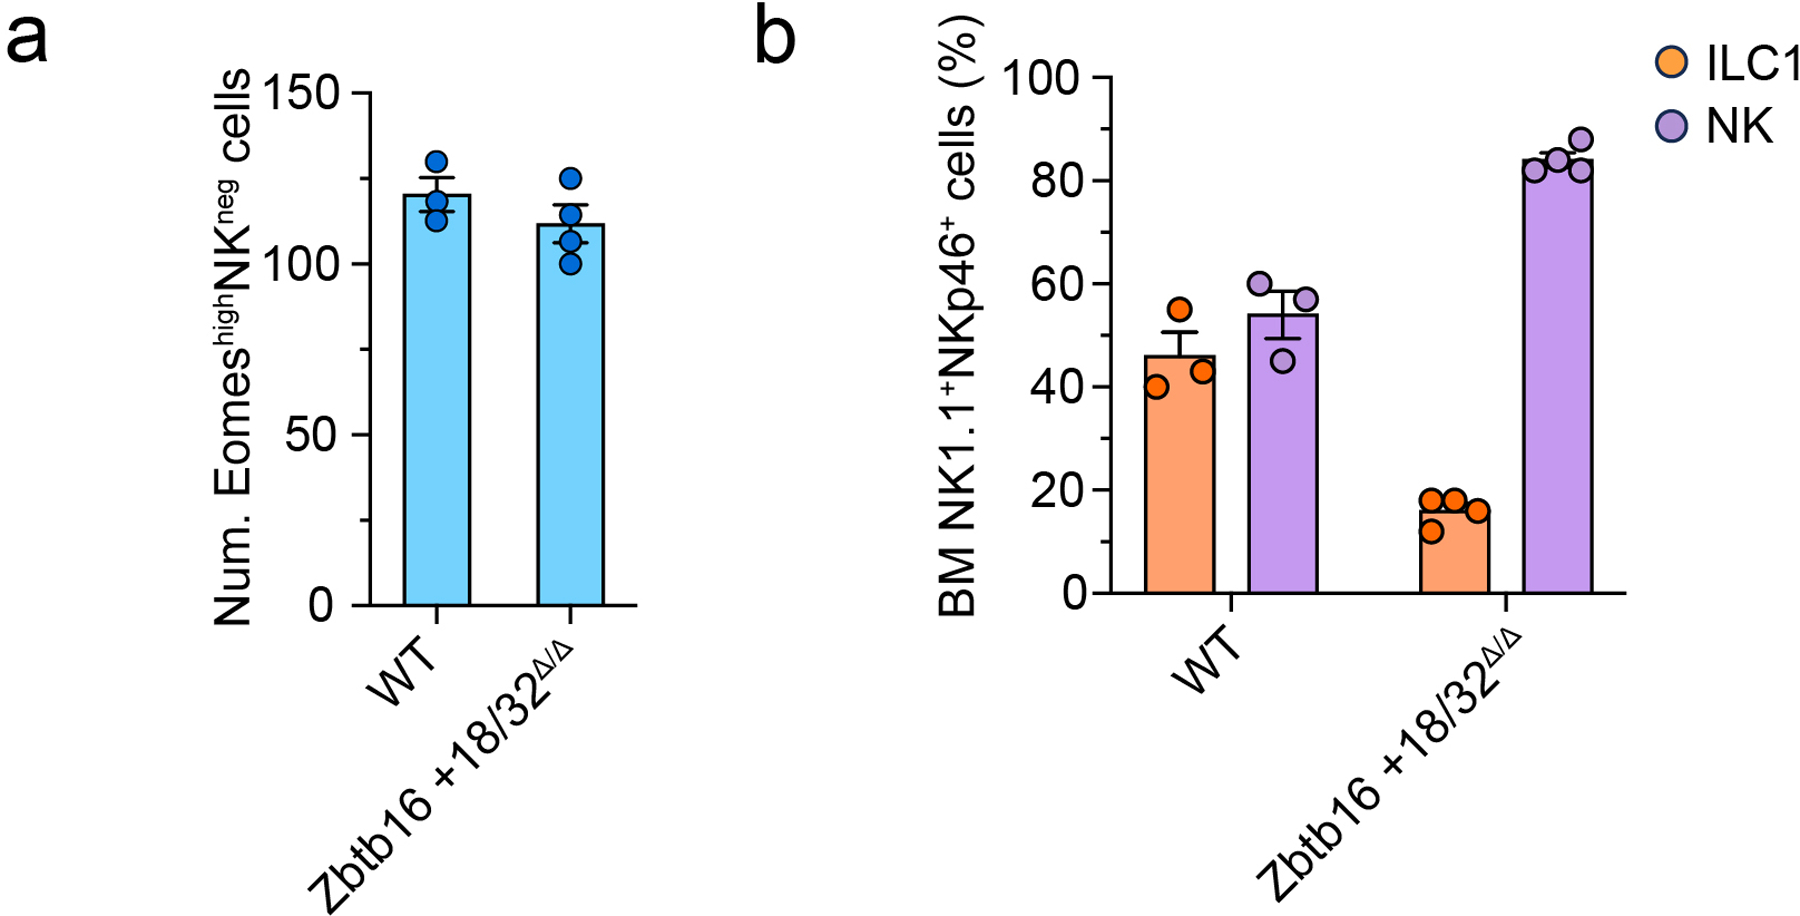
a, Quantification of EomeshiNKneg cells in the BM of WT (n=3) and Zbtb16 +18/32Δ/Δ (n=4) mice. Data are representative of two independent experiments. Data represent mean ± s.e.m. b, Bar graph showing the relative abundance of BM Eomes+NK1.1+DX5+ NK cells and Eomes−NK1.1+DX5−IL-7Rα+ ILC1s in WT (n=3) and Zbtb16 +18/32Δ/Δ (n=4) mice. Data are representative of two independent experiments. Data represent mean ± s.e.m.
Extended Data Fig. 5. NK cells emerge post-natally.
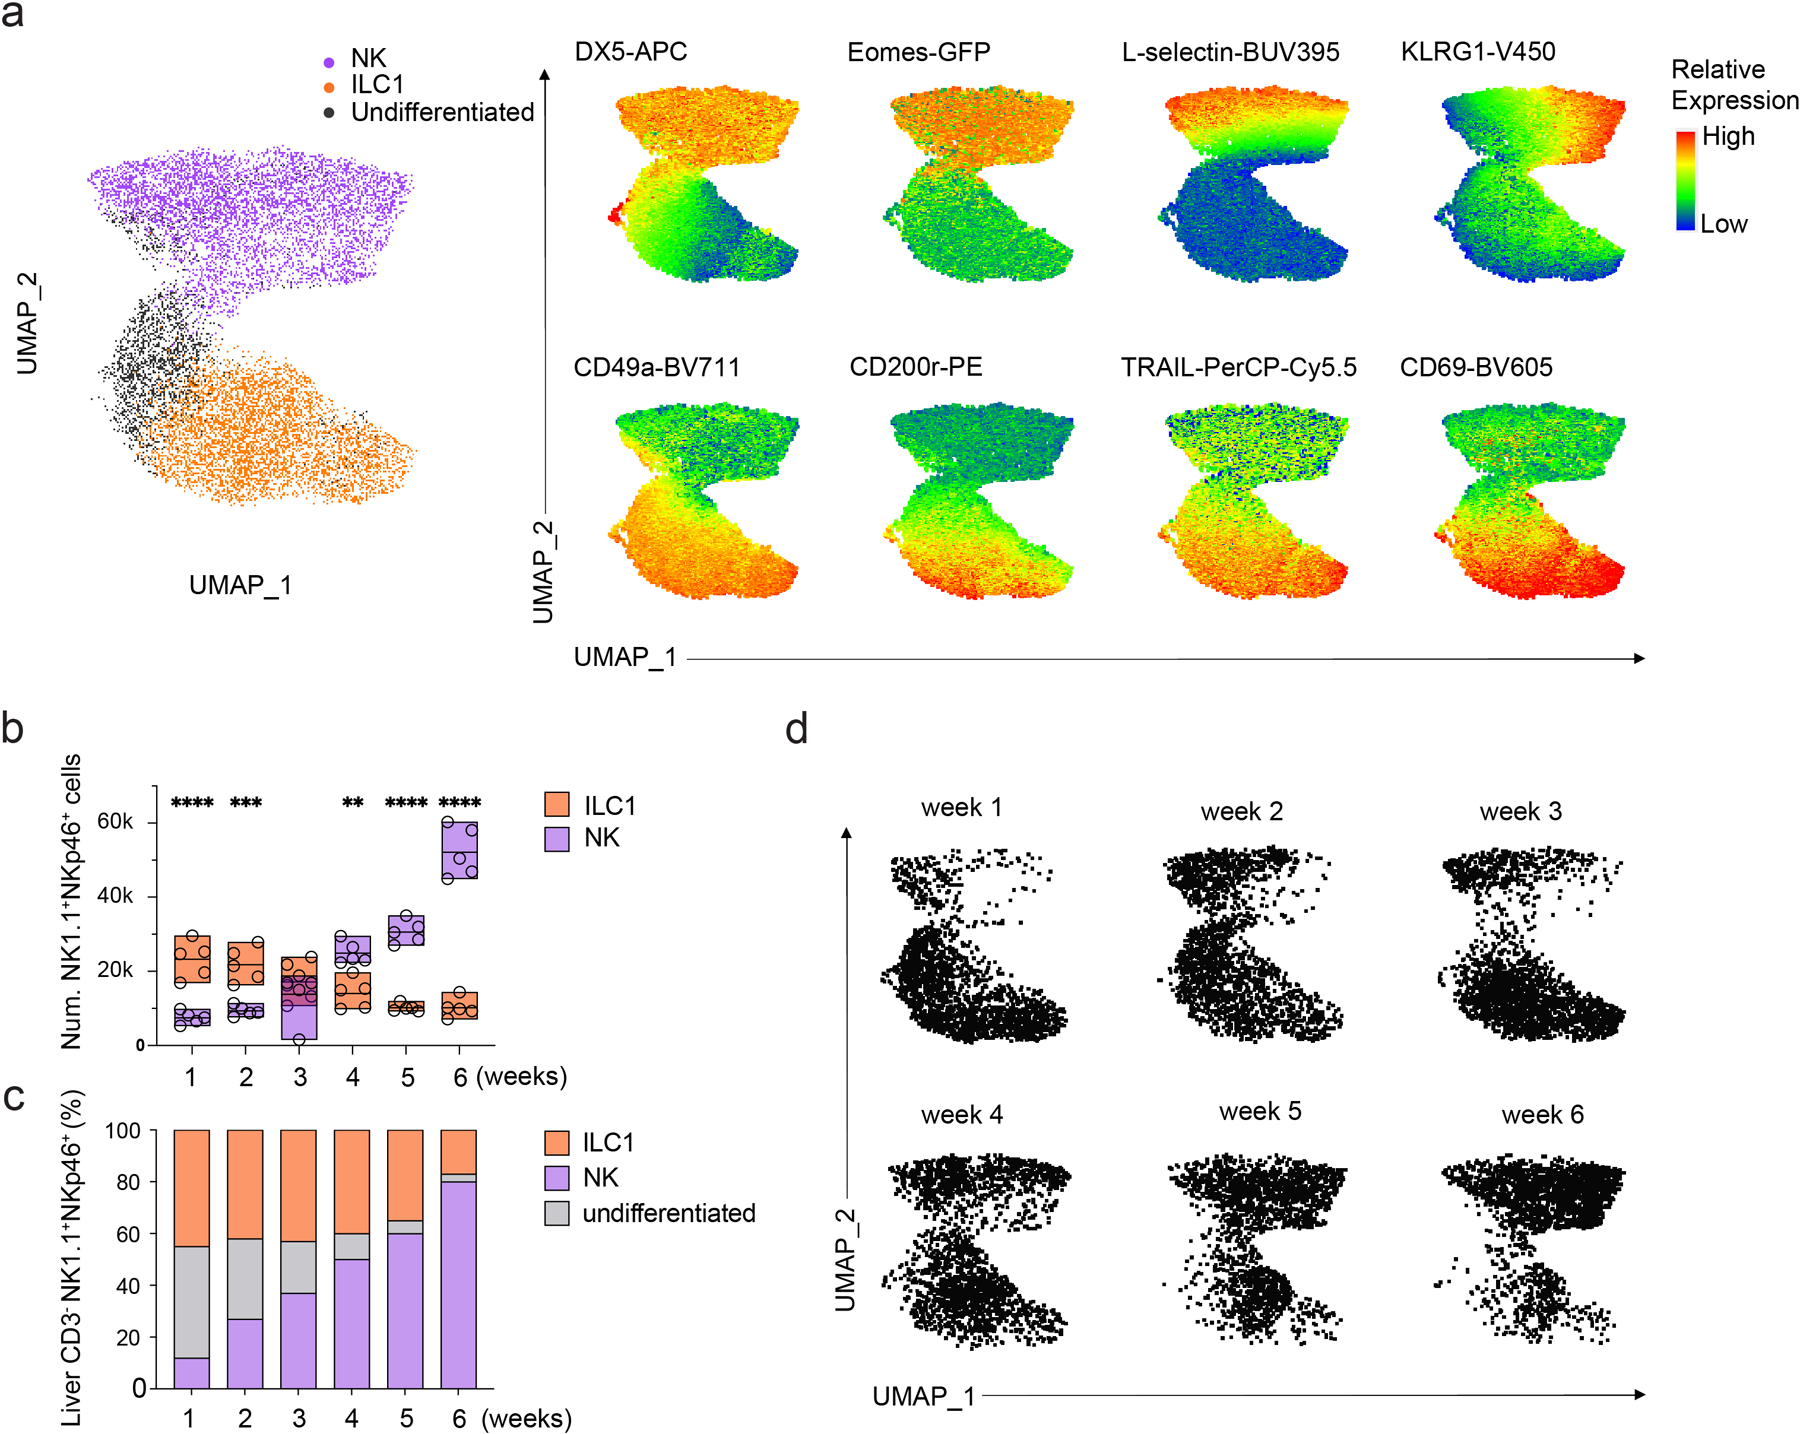
, UMAP clustering of high dimensional flow cytometry data and corresponding heatmap displaying relative expression DX5, L-selection, Eomes, KLRG1, CD49a, TRAIL, CD69 and CD200r among CD45+CD3ε−NK1.1+NKp46+ liver lymphocytes from 1–6 week-old mice. b, bar graph showing the number of DX5+CD49a− NK cells (n=5) or DX5−CD49a+ ILC1s (n=5) among CD45+CD3ε−NK1.1+NKp46+ liver lymphocytes of 1–6 week-old mice. Data are representative of three independent experiments. Data represent mean ± s.e.m. **P<0.01, ***P<0.001, ****P < 0.0001. c, bar graph showing the frequency of DX5+CD49a− NK cells (n=4), DX5−CD49a+ ILC1s (n=4) and DX5loCD49a+ undifferentiated cells (n=4) among CD45+CD3ε−NK1.1+NKp46+ liver lymphocytes from 1–6 week-old mice. Data are representative of two independent experiments. Data represent mean. d, UMAP clustering of high dimensional flow cytometry data showing the composition of DX5+CD49a− NK cells and DX5−CD49a+ ILC1s among CD45+CD3ε−NK1.1+NKp46+ liver lymphocytes from 1–6 week-old mice.
Extended Data Fig 6. Instability of Eomes and DX5 in vitro.
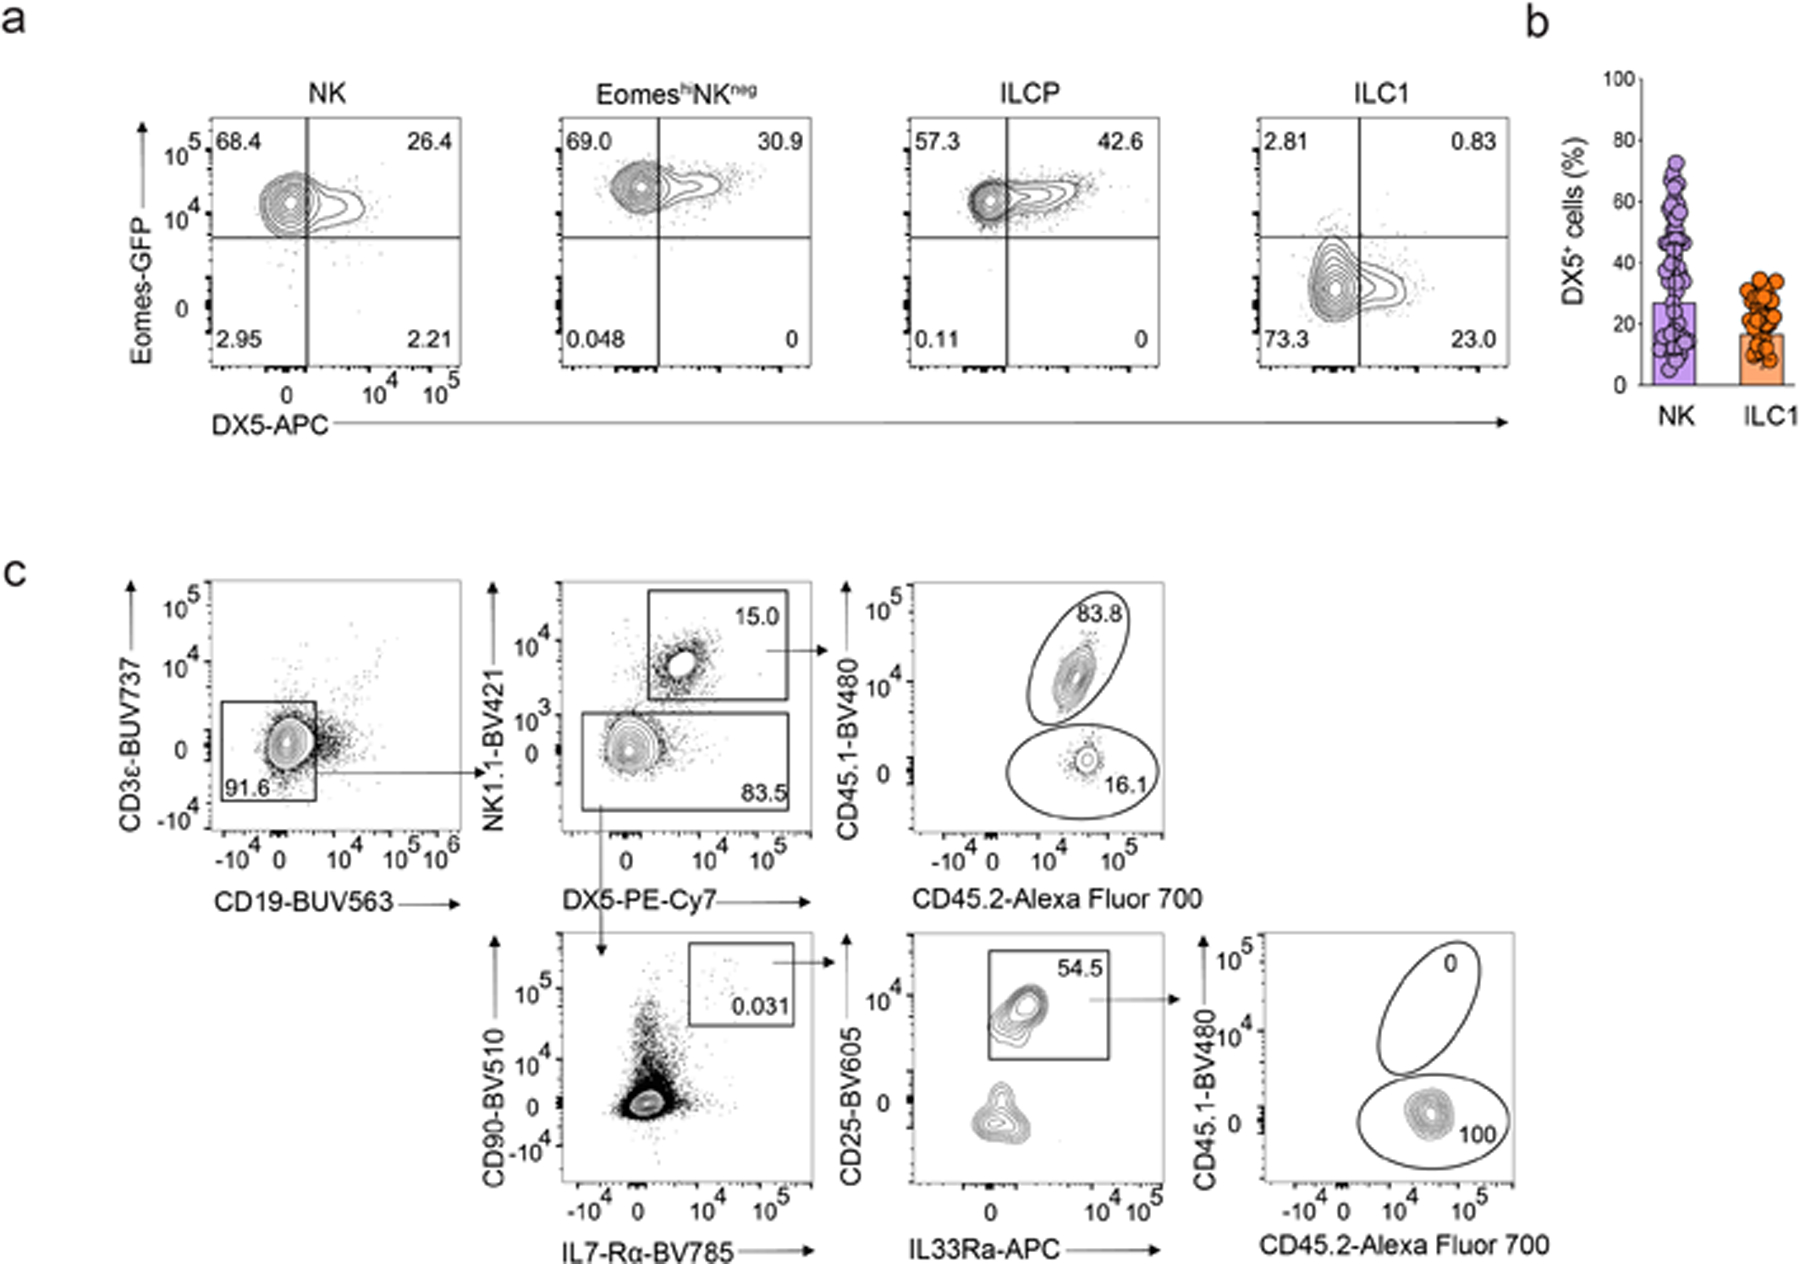
a, Representative flow cytormetry plot expression of Eomes-GFP and DX5 on Eomes-GFP−NK1.1+IL-7Rα+ ILC1s, α4β7+CD244+IL-7Rα+CD90+PD1+ ILCPs, EomeshiNKneg cells or Eomes-GFP+NK1.1+ NK cells on day 7 of co-culture with OP9 cells with IL2, IL7 and SCF. b, Bar graph showing DX5 expression on single NK cell (n=49) and single ILC1 (n=30) on day 7 of co-culture with OP9 cells with IL2, IL7 and SCF. Data represent mean ± s.e.m. c, Representative flow cytometry plot showing the reconstitution of CD3ε−CD19−NK1.1+ NK cells (top) and NK1.1−CD90+IL-7Rα+CD25+IL-33Rα+ ILC2s (bottom) in the lung of CD45.2/CD45.2 Rag2−/−IL2rg−/− mice at week 2 post-intravenous transfer of equal mixes of CD45.1/CD45.2 EomeshiNKneg cells and CD45.2/CD45.2 Tcf7-mCherry+α4β7+CD244+IL-7Rα+CD90+PD1+ ILCPs.
Extended Data Fig. 7. Comparison of scRNA-seq trajectory inference results.
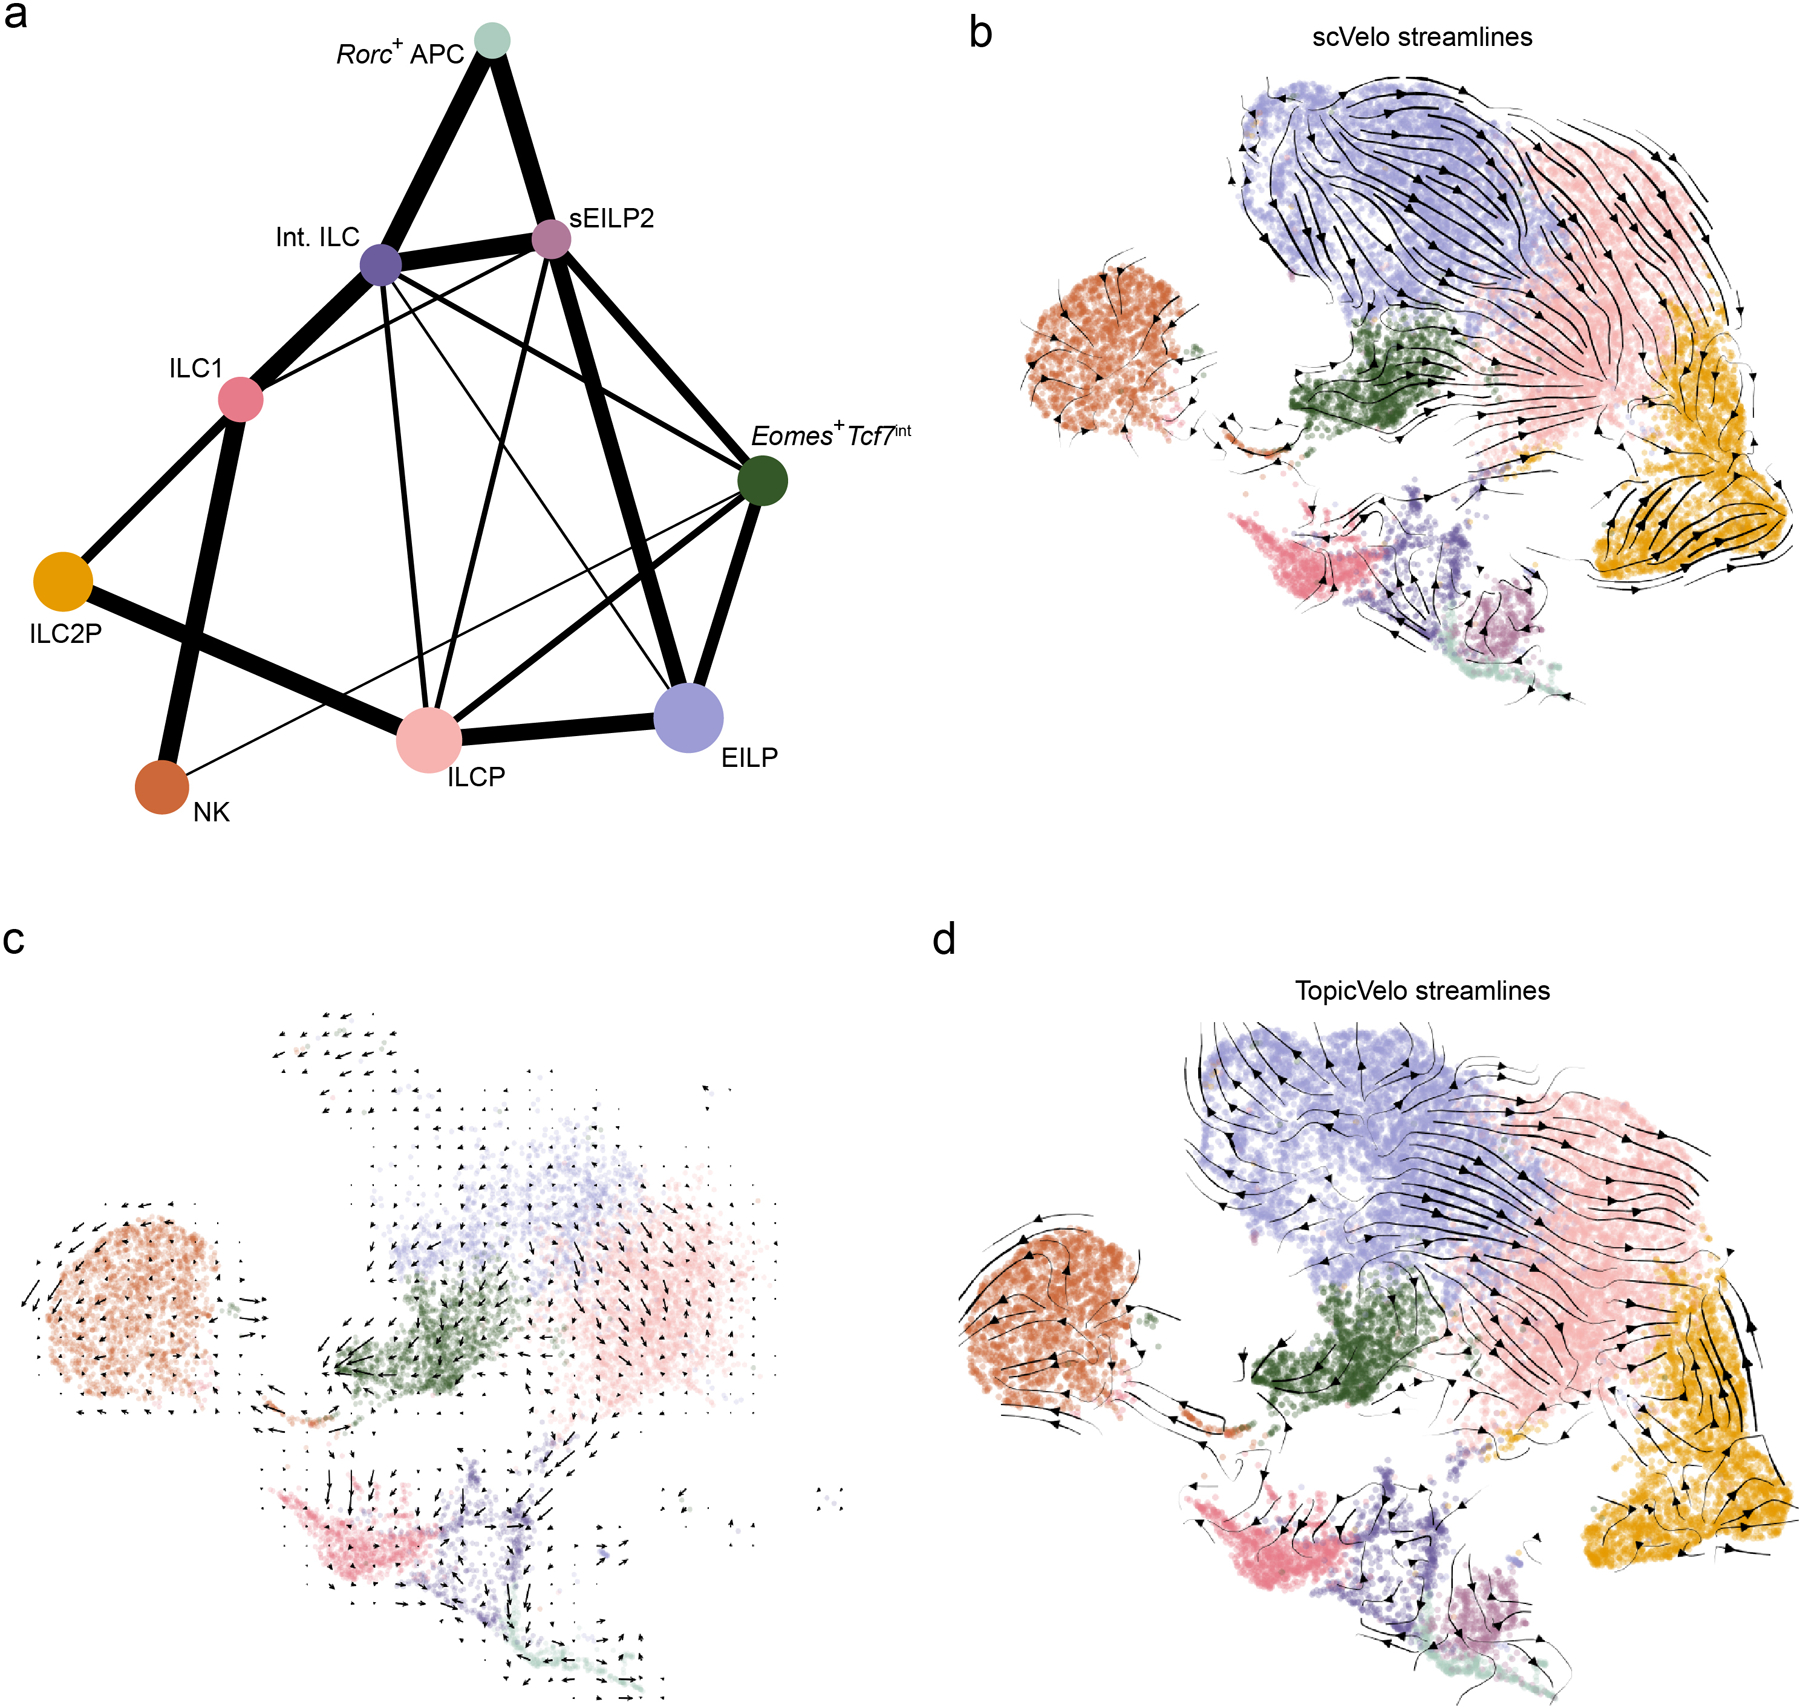
a, PAGA graph shows degree of connectivity (line weight) between clusters (dots) from scRNA-seq data (Fig. 1). Thicker lines represent a stronger connection, while dot size scales with number of cells in cluster. b, UMAP embedding (colored by cluster, as in Fig. 1a) shows RNA velocity streamlines (arrows), indicating cellular state transitions inferred by scVelo from all cells (Methods). c, UMAP embedding (as in Fig. 7d), shows an overlaid grid of average RNA velocity vectors (arrows), as an alternative view of the streamline visualization of inferred cellular state transitions in Fig. 7d. d, UMAP embedding shows RNA velocity streamlines (as in b) indicating cellular state transitions inferred by TopicVelo from all cells (Methods).
Extended Data Fig. 8. Topic-specific cell weights and streamlines from TopicVelo analysis.
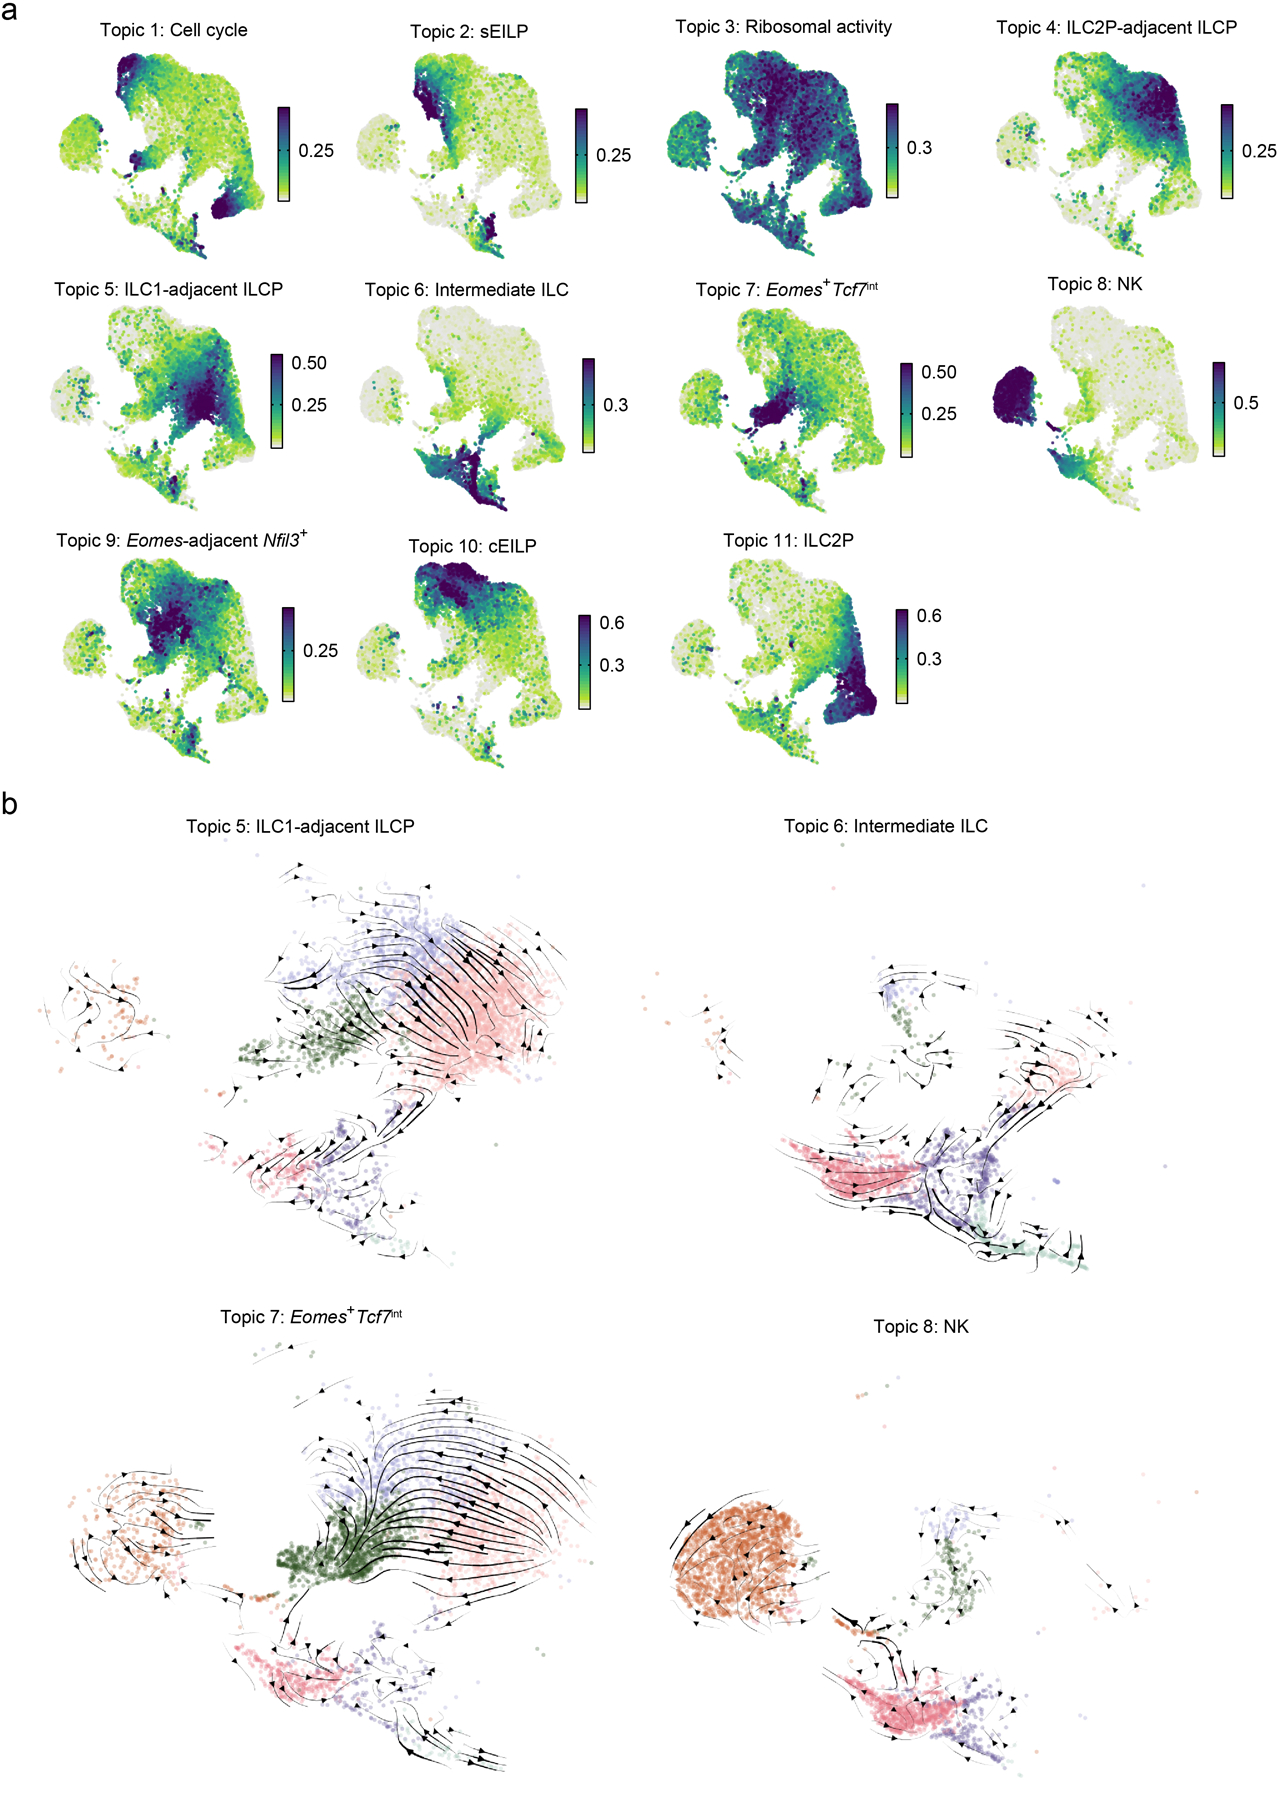
a, UMAP embeddings (as in Fig. 1a) of cells, colored by their weight for each of 11 “topics”, or gene programs, inferred (without supervision or prior knowledge) via a probabilistic topic modeling analysis. Titles indicate post hoc topic annotations, determined by literature-based associations with the genes differentially expressed in each topic (Methods, Supplementary Table 3). b, Close-ups of the UMAP embedding (colored by cluster, as in Fig. 1a) show RNA velocity streamlines (arrows) for curated topic-specific cellular state transitions (titles), inferred by TopicVelo from topic-specific cells (displayed in each close-up) and genes, and then integrated to compute the NK/ILC1-focused transition matrix (Fig. 7d, Extended Data Fig. 6c, Methods).
Extended Data Fig 9. Eomes expression marks the loss of ILC2/3 potential.
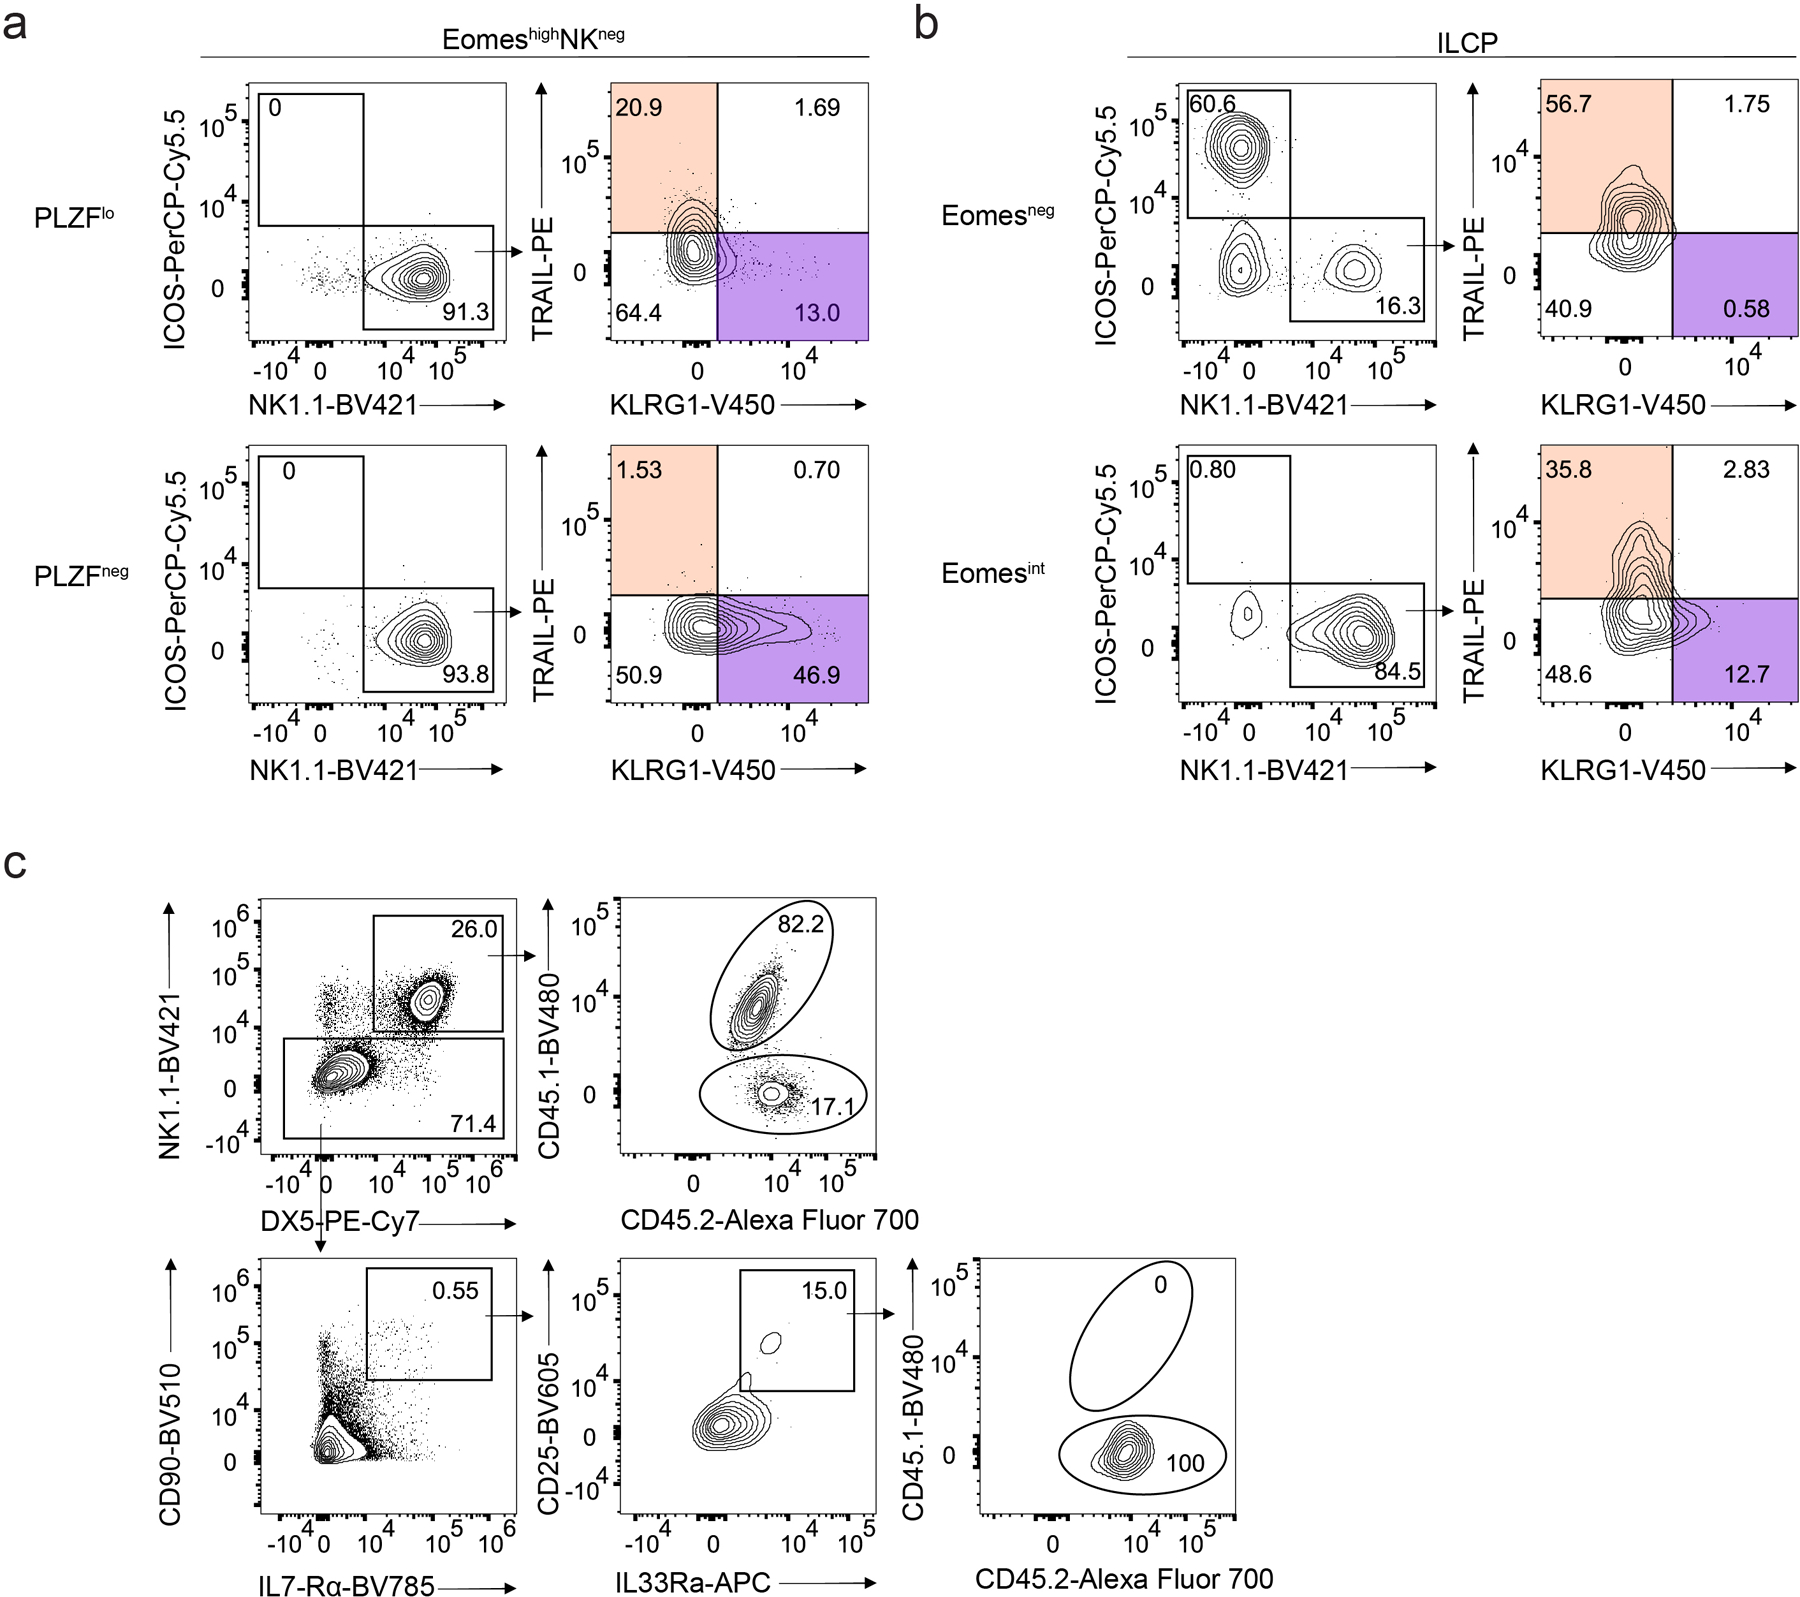
a, Representative flow cytometry plots showing PLZFneg and PLZFlo EomeshiNKneg cell-derived NK1.1–ICOS+ ILC2/ILC3s, NK1.1+ICOS–TRAIL+KLRG1– ILC1-like cells and NK1.1+ICOS–TRAIL–KLRG1+ NK-like cells on day 7 of co-culture with OP9 cells with IL-2, IL-7 and SCF. b, Representative flow cytometry plots showing Eomesneg and Eomesint ILCP cell-derived NK1.1–ICOS+ ILC2/ILC3s, NK1.1+ICOS–TRAIL+KLRG1– ILC1-like cells and NK1.1+ICOS–TRAIL–KLRG1+ NK-like cells on day 7 of co-culture with OP9 cells with IL-2, IL-7 and SCF. c, Representative flow cytometry plot showing the reconstitution of CD3ε−CD19−NK1.1+ NK cells (top) and NK1.1−CD90+IL-7Rα+CD25+IL-33Rα+ ILC2s (bottom) in the lung of CD45.2/CD45.2 Rag2−/−γc−/− mice at week 2 post-intravenous transfer of equal mixes of CD45.1/CD45.2 PLZFloEomeshiNKneg cells and CD45.2/CD45.2 Tcf7-mCherry+α4β7+CD244+IL-7Rα+CD90+PD1+ ILCPs.
Extended Data Fig 10. Model of innate lymphocyte development from BM precursors.
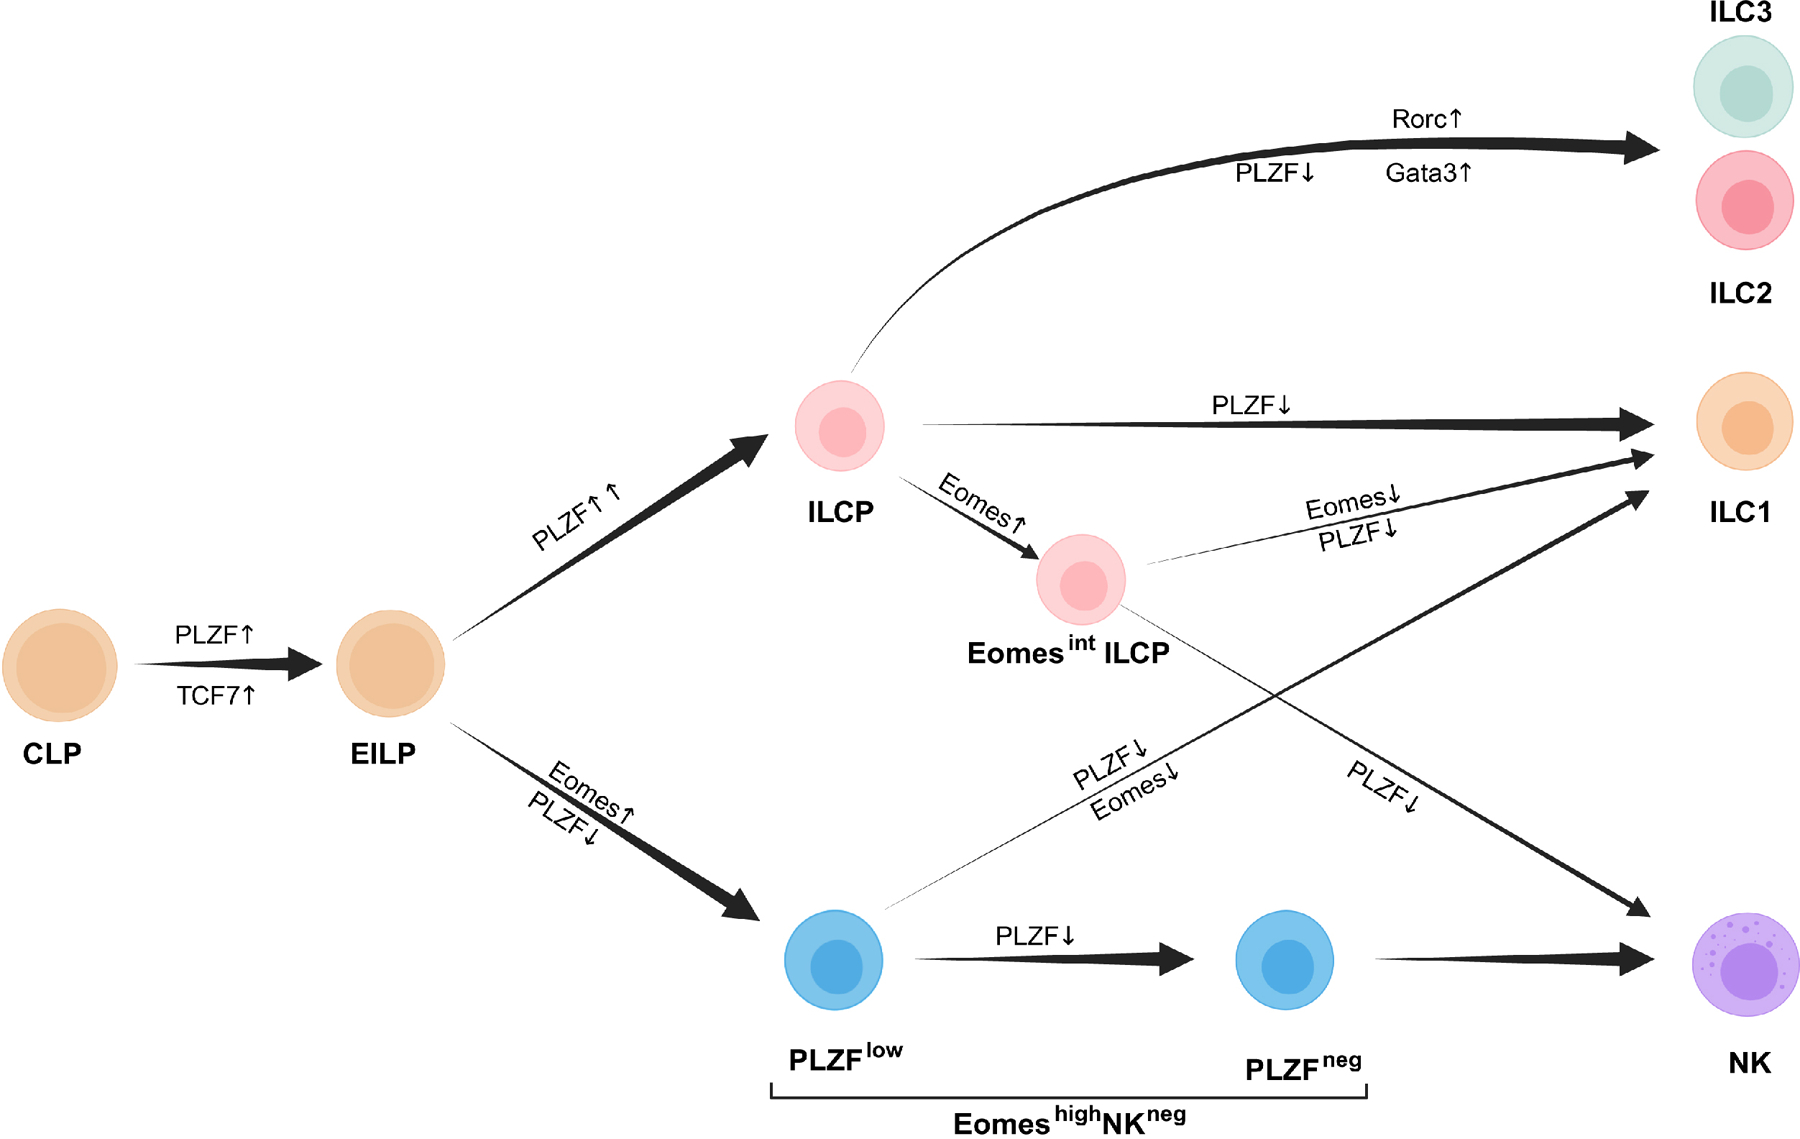
Downstream of CLP, Tcf7-expressing EILP gains the expression of an intermediate level of PLZF and develop into helper ILCs and NK cells. A fraction of EILPs upregulate Eomes expression to become NK/ILC1-restricted PLZFloEomeshiNKneg cells which can either further downregulate PLZF on the way to become NK cells or can lose both PLZF and Eomes expression to become ILC1s. Alternatively, a fraction of PLZFint EILPs can further upregulate PLZF to become ILCPs. These ILCPs can generate all ILC lineages. However, a small subset of ILCPs upregulate Eomes, lose ILC2/3 potential, and can generate NK cells or ILC1s. Created with BioRender.com.
Supplementary Material
Supplementary Table 4. Topic-specific cell membership thresholds used for TopicVelo. Percentile thresholds for the topic cell weights, which are used to estimate membership in a given topic (Methods), are displayed for both the focused (Fig. 7d) and global (Extended Data Fig. 6d) TopicVelo analyses. A cell’s topic weight must be above the percentile threshold for the cell to be considered a member in the topic.
Supplementary Table 2. Cytokine receptor transcripts expressed in EILP. Gene names indicate transcripts from the KEGG pathway “Cytokine-cytokine receptor interaction” that are expressed in more than 10% of cells in the Cd24a+ EILP cluster from the scRNA-seq data (Fig. 1a, Methods).
Supplementary Table 3. Topic-specific differentially expressed genes in topic model used for TopicVelo. Results of statistical tests estimating whether a gene’s topic weight was distinctive in a given topic (sheet name) relative to other topics in the model (Methods), including probability estimates that account for multiple hypotheses (“lfsr” column, representing local false sign rate).
Supplementary Table 1. Cluster-specific differentially expressed genes in filtered single-cell RNA-sequencing analysis. Results of “pseudo-bulk” differential expression tests using DESeq2, including P-values adjusting for multiple comparisons (“padj” column) (Methods). Sheet names indicate the comparisons tested.
ACKNOWLEDGEMENTS
We thank M. Olson and C. Ciszewski for cell sorting, and the University of Chicago Functional Genomics Facility for RNA sequencing support. B.D.M was supported by NIH grant T32 DK007074-47, and H.D.A. was supported by the National Science Foundation Graduate Research Fellowship Program under Grant No. 2140001. This study was supported by NIH grants 5R37-AI038339-27, 5R01-AI144094 to A.B., and the Digestive Diseases Research Core Center C-IID P30 DK42086 at the University of Chicago to B.J. and A.B. The funders had no role in study design, data collection and analysis, decision to publish or preparation of the manuscript. This work is dedicated to Albert Bendelac who passed away during manuscript preparation.
Footnotes
Competing Interests
The authors declare no competing interests.
Code availability
The R and Python code used to generate the scRNA-seq analyses and figures in this study have been deposited in a Zenodo repository with DOI 10.5281/zenodo.10892070.
Data availability
Transcriptomic datasets generated during the current study have been uploaded to the GEO repository with accession number GSE256395. Materials generated during the current study will be freely available and requests should be addressed to corresponding author Benjamin McDonald (Benjamin.mcdonald@uchicagomedicine.org).
REFERENCES
- 1.Vivier E et al. Innate or adaptive immunity? The example of natural killer cells. Science 331, 44–49 (2011). [DOI] [PMC free article] [PubMed] [Google Scholar]
- 2.Vivier E et al. Innate Lymphoid Cells: 10 Years On. Cell 174, 1054–1066 (2018). [DOI] [PubMed] [Google Scholar]
- 3.Colonna M Innate Lymphoid Cells: Diversity, Plasticity, and Unique Functions in Immunity. Immunity 48, 1104–1117 (2018). [DOI] [PMC free article] [PubMed] [Google Scholar]
- 4.Cortez VS & Colonna M Diversity and function of group 1 innate lymphoid cells. Immunol Lett 179, 19–24 (2016). [DOI] [PMC free article] [PubMed] [Google Scholar]
- 5.Constantinides MG, McDonald BD, Verhoef PA & Bendelac A A committed precursor to innate lymphoid cells. Nature 508, 397–401 (2014). [DOI] [PMC free article] [PubMed] [Google Scholar]
- 6.Weizman OE et al. ILC1 Confer Early Host Protection at Initial Sites of Viral Infection. Cell 171, 795–808 e712 (2017). [DOI] [PMC free article] [PubMed] [Google Scholar]
- 7.Klose CSN et al. Differentiation of type 1 ILCs from a common progenitor to all helper-like innate lymphoid cell lineages. Cell 157, 340–356 (2014). [DOI] [PubMed] [Google Scholar]
- 8.McFarland AP et al. Multi-tissue single-cell analysis deconstructs the complex programs of mouse natural killer and type 1 innate lymphoid cells in tissues and circulation. Immunity 54, 1320–1337 e1324 (2021). [DOI] [PMC free article] [PubMed] [Google Scholar]
- 9.Flommersfeld S et al. Fate mapping of single NK cells identifies a type 1 innate lymphoid-like lineage that bridges innate and adaptive recognition of viral infection. Immunity 54, 2288–2304 e2287 (2021). [DOI] [PMC free article] [PubMed] [Google Scholar]
- 10.Nixon BG et al. Cytotoxic granzyme C-expressing ILC1s contribute to antitumor immunity and neonatal autoimmunity. Sci Immunol 7, eabi8642 (2022). [DOI] [PMC free article] [PubMed] [Google Scholar]
- 11.Cortez VS et al. Transforming Growth Factor-beta Signaling Guides the Differentiation of Innate Lymphoid Cells in Salivary Glands. Immunity 44, 1127–1139 (2016). [DOI] [PMC free article] [PubMed] [Google Scholar]
- 12.Friedrich C et al. Effector differentiation downstream of lineage commitment in ILC1s is driven by Hobit across tissues. Nat Immunol 22, 1256–1267 (2021). [DOI] [PMC free article] [PubMed] [Google Scholar]
- 13.Parikh BA et al. Control of Viral Infection by Natural Killer Cell Inhibitory Receptors. Cell Rep 32, 107969 (2020). [DOI] [PMC free article] [PubMed] [Google Scholar]
- 14.Yang Q et al. TCF-1 upregulation identifies early innate lymphoid progenitors in the bone marrow. Nat Immunol 16, 1044–1050 (2015). [DOI] [PMC free article] [PubMed] [Google Scholar]
- 15.Yu X et al. The basic leucine zipper transcription factor NFIL3 directs the development of a common innate lymphoid cell precursor. Elife 3 (2014). [DOI] [PMC free article] [PubMed] [Google Scholar]
- 16.Xu W et al. An Id2(RFP)-Reporter Mouse Redefines Innate Lymphoid Cell Precursor Potentials. Immunity 50, 1054–1068 e1053 (2019). [DOI] [PMC free article] [PubMed] [Google Scholar]
- 17.Walker JA et al. Polychromic Reporter Mice Reveal Unappreciated Innate Lymphoid Cell Progenitor Heterogeneity and Elusive ILC3 Progenitors in Bone Marrow. Immunity 51, 104–118 e107 (2019). [DOI] [PMC free article] [PubMed] [Google Scholar]
- 18.Kasal DN & Bendelac A Multi-transcription factor reporter mice delineate early precursors to the ILC and LTi lineages. J Exp Med 218 (2021). [DOI] [PMC free article] [PubMed] [Google Scholar]
- 19.Zhang J et al. Sequential actions of EOMES and T-BET promote stepwise maturation of natural killer cells. Nature Communications 12 (2021). [DOI] [PMC free article] [PubMed] [Google Scholar]
- 20.Gordon SM et al. The transcription factors T-bet and Eomes control key checkpoints of natural killer cell maturation. Immunity 36, 55–67 (2012). [DOI] [PMC free article] [PubMed] [Google Scholar]
- 21.Townsend MJ et al. T-bet regulates the terminal maturation and homeostasis of NK and Valpha14i NKT cells. Immunity 20, 477–494 (2004). [DOI] [PubMed] [Google Scholar]
- 22.Yang C et al. Single-cell transcriptome reveals the novel role of T-bet in suppressing the immature NK gene signature. Elife 9 (2020). [DOI] [PMC free article] [PubMed] [Google Scholar]
- 23.Yoshida H et al. The cis-Regulatory Atlas of the Mouse Immune System. Cell 176, 897–912 e820 (2019). [DOI] [PMC free article] [PubMed] [Google Scholar]
- 24.Daussy C et al. T-bet and Eomes instruct the development of two distinct natural killer cell lineages in the liver and in the bone marrow. J Exp Med 211, 563–577 (2014). [DOI] [PMC free article] [PubMed] [Google Scholar]
- 25.Pikovskaya O et al. Cutting Edge: Eomesodermin Is Sufficient To Direct Type 1 Innate Lymphocyte Development into the Conventional NK Lineage. J Immunol 196, 1449–1454 (2016). [DOI] [PMC free article] [PubMed] [Google Scholar]
- 26.Harly C et al. The transcription factor TCF-1 enforces commitment to the innate lymphoid cell lineage. Nat Immunol 20, 1150–1160 (2019). [DOI] [PMC free article] [PubMed] [Google Scholar]
- 27.Ishizuka IE et al. Single-cell analysis defines the divergence between the innate lymphoid cell lineage and lymphoid tissue-inducer cell lineage. Nat Immunol 17, 269–276 (2016). [DOI] [PMC free article] [PubMed] [Google Scholar]
- 28.Seillet C et al. Deciphering the Innate Lymphoid Cell Transcriptional Program. Cell Rep 17, 436–447 (2016). [DOI] [PubMed] [Google Scholar]
- 29.Yu Y et al. Single-cell RNA-seq identifies a PD-1(hi) ILC progenitor and defines its development pathway. Nature 539, 102–106 (2016). [DOI] [PubMed] [Google Scholar]
- 30.Akagbosu B et al. Novel antigen-presenting cell imparts T(reg)-dependent tolerance to gut microbiota. Nature 610, 752–760 (2022). [DOI] [PMC free article] [PubMed] [Google Scholar]
- 31.Kedmi R et al. A RORgammat(+) cell instructs gut microbiota-specific T(reg) cell differentiation. Nature 610, 737–743 (2022). [DOI] [PMC free article] [PubMed] [Google Scholar]
- 32.Lyu M et al. ILC3s select microbiota-specific regulatory T cells to establish tolerance in the gut. Nature 610, 744–751 (2022). [DOI] [PMC free article] [PubMed] [Google Scholar]
- 33.Wagner JA et al. Stage-Specific Requirement for Eomes in Mature NK Cell Homeostasis and Cytotoxicity. Cell Rep 31, 107720 (2020). [DOI] [PMC free article] [PubMed] [Google Scholar]
- 34.Fathman JW et al. Identification of the earliest natural killer cell-committed progenitor in murine bone marrow. Blood 118, 5439–5447 (2011). [DOI] [PMC free article] [PubMed] [Google Scholar]
- 35.Constantinides MG et al. PLZF expression maps the early stages of ILC1 lineage development. Proc Natl Acad Sci U S A 112, 5123–5128 (2015). [DOI] [PMC free article] [PubMed] [Google Scholar]
- 36.Rodriguez-Rodriguez N et al. Identification of aceNKPs, a committed common progenitor population of the ILC1 and NK cell continuum. Proc Natl Acad Sci U S A 119, e2203454119 (2022). [DOI] [PMC free article] [PubMed] [Google Scholar]
- 37.Sparano C et al. Embryonic and neonatal waves generate distinct populations of hepatic ILC1s. Sci Immunol 7, eabo6641 (2022). [DOI] [PubMed] [Google Scholar]
- 38.Wolf FA et al. PAGA: graph abstraction reconciles clustering with trajectory inference through a topology preserving map of single cells. Genome Biol 20, 59 (2019). [DOI] [PMC free article] [PubMed] [Google Scholar]
- 39.Bergen V, Lange M, Peidli S, Wolf FA & Theis FJ Generalizing RNA velocity to transient cell states through dynamical modeling. Nat Biotechnol 38, 1408–1414 (2020). [DOI] [PubMed] [Google Scholar]
- 40.Gao CF, Vaikuntanathan S & Riesenfeld SJ Dissection and Integration of Bursty Transcriptional Dynamics for Complex Systems. Proc Natl Acad Sci U S A. 121 (18) e2306901121 (2024). [DOI] [PMC free article] [PubMed] [Google Scholar]
- 41.Ichise H et al. Functional visualization of NK cell-mediated killing of metastatic single tumor cells. Elife 11 (2022). [DOI] [PMC free article] [PubMed] [Google Scholar]
- 42.Freeman AJ et al. Natural Killer Cells Suppress T Cell-Associated Tumor Immune Evasion. Cell Rep 28, 2784–2794 e2785 (2019). [DOI] [PubMed] [Google Scholar]
- 43.Gao Y et al. Tumor immunoevasion by the conversion of effector NK cells into type 1 innate lymphoid cells. Nat Immunol 18, 1004–1015 (2017). [DOI] [PubMed] [Google Scholar]
- 44.Shimizu K et al. Eomes transcription factor is required for the development and differentiation of invariant NKT cells. Commun Biol 2, 150 (2019). [DOI] [PMC free article] [PubMed] [Google Scholar]
- 45.Cortez VS et al. SMAD4 impedes the conversion of NK cells into ILC1-like cells by curtailing non-canonical TGF-beta signaling. Nat Immunol 18, 995–1003 (2017). [DOI] [PMC free article] [PubMed] [Google Scholar]
- 46.Viel S et al. TGF-beta inhibits the activation and functions of NK cells by repressing the mTOR pathway. Sci Signal 9, ra19 (2016). [DOI] [PubMed] [Google Scholar]
- 47.Mao AP, Ishizuka IE, Kasal DN, Mandal M & Bendelac A A shared Runx1-bound Zbtb16 enhancer directs innate and innate-like lymphoid lineage development. Nat Commun 8, 863 (2017). [DOI] [PMC free article] [PubMed] [Google Scholar]
- 48.Zheng GX et al. Massively parallel digital transcriptional profiling of single cells. Nat Commun 8, 14049 (2017). [DOI] [PMC free article] [PubMed] [Google Scholar]
- 49.Buettner F et al. Computational analysis of cell-to-cell heterogeneity in single-cell RNA-sequencing data reveals hidden subpopulations of cells. Nat Biotechnol 33, 155–160 (2015). [DOI] [PubMed] [Google Scholar]
- 50.Charrout M, Reinders MJT & Mahfouz A Untangling biological factors influencing trajectory inference from single cell data. NAR Genom Bioinform 2, lqaa053 (2020). [DOI] [PMC free article] [PubMed] [Google Scholar]
- 51.Luecken MD & Theis FJ Current best practices in single-cell RNA-seq analysis: a tutorial. Mol Syst Biol 15, e8746 (2019). [DOI] [PMC free article] [PubMed] [Google Scholar]
- 52.Hao Y et al. Dictionary learning for integrative, multimodal and scalable single-cell analysis. Nat Biotechnol 42, 293–304 (2024). [DOI] [PMC free article] [PubMed] [Google Scholar]
- 53.Korsunsky I et al. Fast, sensitive and accurate integration of single-cell data with Harmony. Nat Methods 16, 1289–1296 (2019). [DOI] [PMC free article] [PubMed] [Google Scholar]
- 54.Love MI, Huber W & Anders S Moderated estimation of fold change and dispersion for RNA-seq data with DESeq2. Genome Biol 15, 550 (2014). [DOI] [PMC free article] [PubMed] [Google Scholar]
- 55.Squair JW et al. Confronting false discoveries in single-cell differential expression. Nat Commun 12, 5692 (2021). [DOI] [PMC free article] [PubMed] [Google Scholar]
- 56.Wolf FA, Angerer P & Theis FJ SCANPY: large-scale single-cell gene expression data analysis. Genome Biol 19, 15 (2018). [DOI] [PMC free article] [PubMed] [Google Scholar]
- 57.La Manno G et al. RNA velocity of single cells. Nature 560, 494–498 (2018). [DOI] [PMC free article] [PubMed] [Google Scholar]
- 58.Dey KK, Hsiao CJ & Stephens M Visualizing the structure of RNA-seq expression data using grade of membership models. PLoS Genet 13, e1006599 (2017). [DOI] [PMC free article] [PubMed] [Google Scholar]
- 59.Carbonetto P, Sarkar A, Wang Z & Stephens M Non-negative matrix factorization algorithms greatly improve topic model fits. arXiv (2022). [Google Scholar]
- 60.Carbonetto P et al. GoM DE: interpreting structure in sequence count data with differential expression analysis allowing for grades of membership. bioRxiv (2023). [DOI] [PMC free article] [PubMed] [Google Scholar]
- 61.Kanehisa M, Furumichi M, Sato Y, Kawashima M & Ishiguro-Watanabe M KEGG for taxonomy-based analysis of pathways and genomes. Nucleic Acids Res 51, D587–D592 (2023). [DOI] [PMC free article] [PubMed] [Google Scholar]
- 62.Geistlinger L, Csaba G & Zimmer R Bioconductor’s EnrichmentBrowser: seamless navigation through combined results of set- & network-based enrichment analysis. BMC Bioinformatics 17, 45 (2016). [DOI] [PMC free article] [PubMed] [Google Scholar]
Associated Data
This section collects any data citations, data availability statements, or supplementary materials included in this article.
Supplementary Materials
Supplementary Table 4. Topic-specific cell membership thresholds used for TopicVelo. Percentile thresholds for the topic cell weights, which are used to estimate membership in a given topic (Methods), are displayed for both the focused (Fig. 7d) and global (Extended Data Fig. 6d) TopicVelo analyses. A cell’s topic weight must be above the percentile threshold for the cell to be considered a member in the topic.
Supplementary Table 2. Cytokine receptor transcripts expressed in EILP. Gene names indicate transcripts from the KEGG pathway “Cytokine-cytokine receptor interaction” that are expressed in more than 10% of cells in the Cd24a+ EILP cluster from the scRNA-seq data (Fig. 1a, Methods).
Supplementary Table 3. Topic-specific differentially expressed genes in topic model used for TopicVelo. Results of statistical tests estimating whether a gene’s topic weight was distinctive in a given topic (sheet name) relative to other topics in the model (Methods), including probability estimates that account for multiple hypotheses (“lfsr” column, representing local false sign rate).
Supplementary Table 1. Cluster-specific differentially expressed genes in filtered single-cell RNA-sequencing analysis. Results of “pseudo-bulk” differential expression tests using DESeq2, including P-values adjusting for multiple comparisons (“padj” column) (Methods). Sheet names indicate the comparisons tested.
Data Availability Statement
Transcriptomic datasets generated during the current study have been uploaded to the GEO repository with accession number GSE256395. Materials generated during the current study will be freely available and requests should be addressed to corresponding author Benjamin McDonald (Benjamin.mcdonald@uchicagomedicine.org).


