Abstract
Cartilage MRI-based T1rho and T2 compositional measurements have been developed to characterize cartilage matrix quality and diagnose cartilage damage before irreversible defects are found, allowing intervention at an early, potentially reversible disease stage. Over the last 2 decades, this technology was investigated in numerous studies, was validated using specimen studies, arthroscopy, and longitudinal studies documented its ability to predict progression of degenerative disease and radiographic osteoarthritis (OA). While T1rho and T2 measurements have shown promise in early disease stages, several hurdles have been encountered to apply this technology clinically. These include: (i) challenges with cartilage segmentation, (ii) long image acquisition times, (iii) a lack of standardization of imaging, and (iv) an absence of reference databases and definitions of abnormal cut-off values. Progress has been made by developing deep-learning based automatic cartilage segmentation and faster imaging methods, enabling the feasibility of T1rho and T2 imaging for clinical and scientific trial applications. Also, the Radiological Society of North America (RSNA) Quantitative Imaging Biomarker Alliance mechanism was used to establish standardized profiles for compositional T1rho and T2 imaging and multi-center feasibility testing is work in progress. The last hurdles are the development of reference databases and establishing a definition of normal versus abnormal cartilage T1rho and T2 values. Finally, effective treatments for prevention and slowing progression of OA are required in order to establish T1rho and T2 as imaging biomarkers for initiating and monitoring therapies, analogous to the role of dual X-ray absorptiometry (DXA) bone mineral density measurements in the management of osteoporosis.
Keywords: cartilage, MRI, quantitative imaging, biomarkers, osteoarthritis
Introduction:
Osteoarthritis (OA) is a highly prevalent joint disease affecting over 500 million individuals globally, of whom more than 260 million have knee OA (1). Moreover, OA has demonstrated a significant increase in prevalence of 9.3% from 1990 to 2017 (2). Given our aging population and the increasing obesity epidemic, we are expecting these numbers to increase and lead to even higher rates of disability and health care costs (3). There are no effective disease-modifying treatments, and OA is managed by lifestyle modification and pain medication at earlier disease stages and joint replacement at more advanced disease stages. It has been recognized that routine OA management in a primary care setting is mostly reactive rather than proactive in identifying and treating patients in the early stages of the disease (4). Though there is the perception that there are no efficient treatments available (4), it is generally accepted that if detected at early stages interventional strategies are available that will help to slow the disease course and have positive effects on progression of structure and symptoms (5). This creates a window of opportunity that should engage physicians to diagnose OA at the earliest stages possible. However, to diagnose OA early, diagnostic techniques that identify at-risk patients at stages during which the disease is potentially reversible must become available.
MRI-based cartilage compositional imaging biomarkers have been developed to characterize cartilage quality before irreversible cartilage defects have occurred. They also provide quantitative, reproducible measurements and could potentially have a similar role as bone mineral density (BMD) measurements in the diagnosis of bone loss, prediction of fractures and overall management of osteoporosis. Over the last 2 decades, a number of MRI-based technologies have been investigated, which have been used to characterize different components of the cartilage matrix such as collagen, water content, and proteoglycans; these include T2, T2* and T1rho relaxation time measurements as well as delayed Gadolinium-enhanced MRI of cartilage (dGEMRIC), sodium imaging and Glycosaminoglycan (GAG) chemical exchange saturation transfer (gagCEST) (6, 7). To date, T2 and T1rho mapping have been investigated most extensively with a significant number of in vitro and in vivo studies. Studies have shown that T2 and T1rho mapping provide information on collagen integrity, water and proteoglycan content (8) and that these measures were able to predict radiographic OA and disease progression (9–11). dGEMRIC based methods have been used in multiple clinical studies and have been shown to reliably quantify proteoglycan content, but they require gadolinium (Gd) contrast administration (12, 13). Sodium imaging and gagCEST are promising technologies but are primarily dependent on ultra-high field strength and sophisticated software and hardware, which is challenging to implement in clinical practice (14, 15).
This review article will focus on T2 and T1rho mapping, which are to date the most widely applied technologies to study cartilage composition with most research data available from clinical studies. Specifically, this article will review what we have learned and will describe what is needed to apply these methods clinically and in a trial setting.
What have we learned?
Technical background:
T2 relaxation time, termed as spin-spin relaxation time, characterizes the rate of transverse magnetization decay, caused by the loss of phase coherence induced by a preceding radiofrequency pulse. It has been shown that in normal articular cartilage, T2 relaxation times are primarily dependent on water and the integrity of the collagen architecture of the extracellular matrix (6). Cartilage matrix degeneration is accompanied by increase in water content and deterioration of collagen architecture both of which results in increase of T2 relaxation times. A number of different sequences have been developed for measuring cartilage T2 within a clinically feasible acquisition time (as compared to single-echo spin-echo [SE] method which is considered to provide reference values albeit with a very long acquisition time), such as multi-echo SE (MESE), magnetization prepared imaging with non-selective Carr-Purcell-Meiboom-Gill (CPMG) refocusing trains followed by three-dimensional (3D) gradient echo (magnetization-prepared angle-modulated partitioned k-space spoiled gradient echo snapshots [3D-MAPSS]) or spin echo (variable refocusing flip angle schedules fast SE [3D vfl-FSE]) readouts, and T2 estimate with dual-, triple-, or multiple-echo steady-state (DESS/TESS/MESS) imaging (16, 17). However, discrepancies in T2 relaxation time quantitation between these sequences are found and these sequences cannot be used interchangeably to assess cartilage T2 (18). It should be noted that acquisition times are variable but overall quite long in the order of 6 to 11 minutes, which makes acceleration of these sequences an important priority in current research efforts.
T1rho relaxation time, defined as the spin lattice relaxation time in the rotating frame, characterizes the rate of transverse magnetization decay with application of spin-lock pulses along the direction of the transverse magnetization under the locking condition (the strength of locking pulses is much stronger than the local magnetic fields generated by, for example, magnetic moments of nuclei). It has been shown that in articular cartilage T1rho measures are significantly correlated with the proteoglycan concentration (6) by probing the interactions between motion-restricted water molecules with their local macromolecular environment. Damage to the cartilage matrix, accompanied by proteoglycan loss, will result in higher T1rho measurements (19). T1rho measures are normally implemented by magnetization preparation using spin-lock pulses, followed by 2D or 3D readout including gradient-echo (with constant or variable flip angles), spin-echo, or ultra-short echo acquisitions (16, 17). Among available 3D sequences, MAPSS T1rho sequence has been implemented at both 1.5T and 3T and on scanners from different manufactures (20). Similarly to T2 imaging, T1rho measures have been shown to be sequence dependent (16). Figure 1 provides on overview of factors that impact T1rho and T2 quantification.
Figure 1:
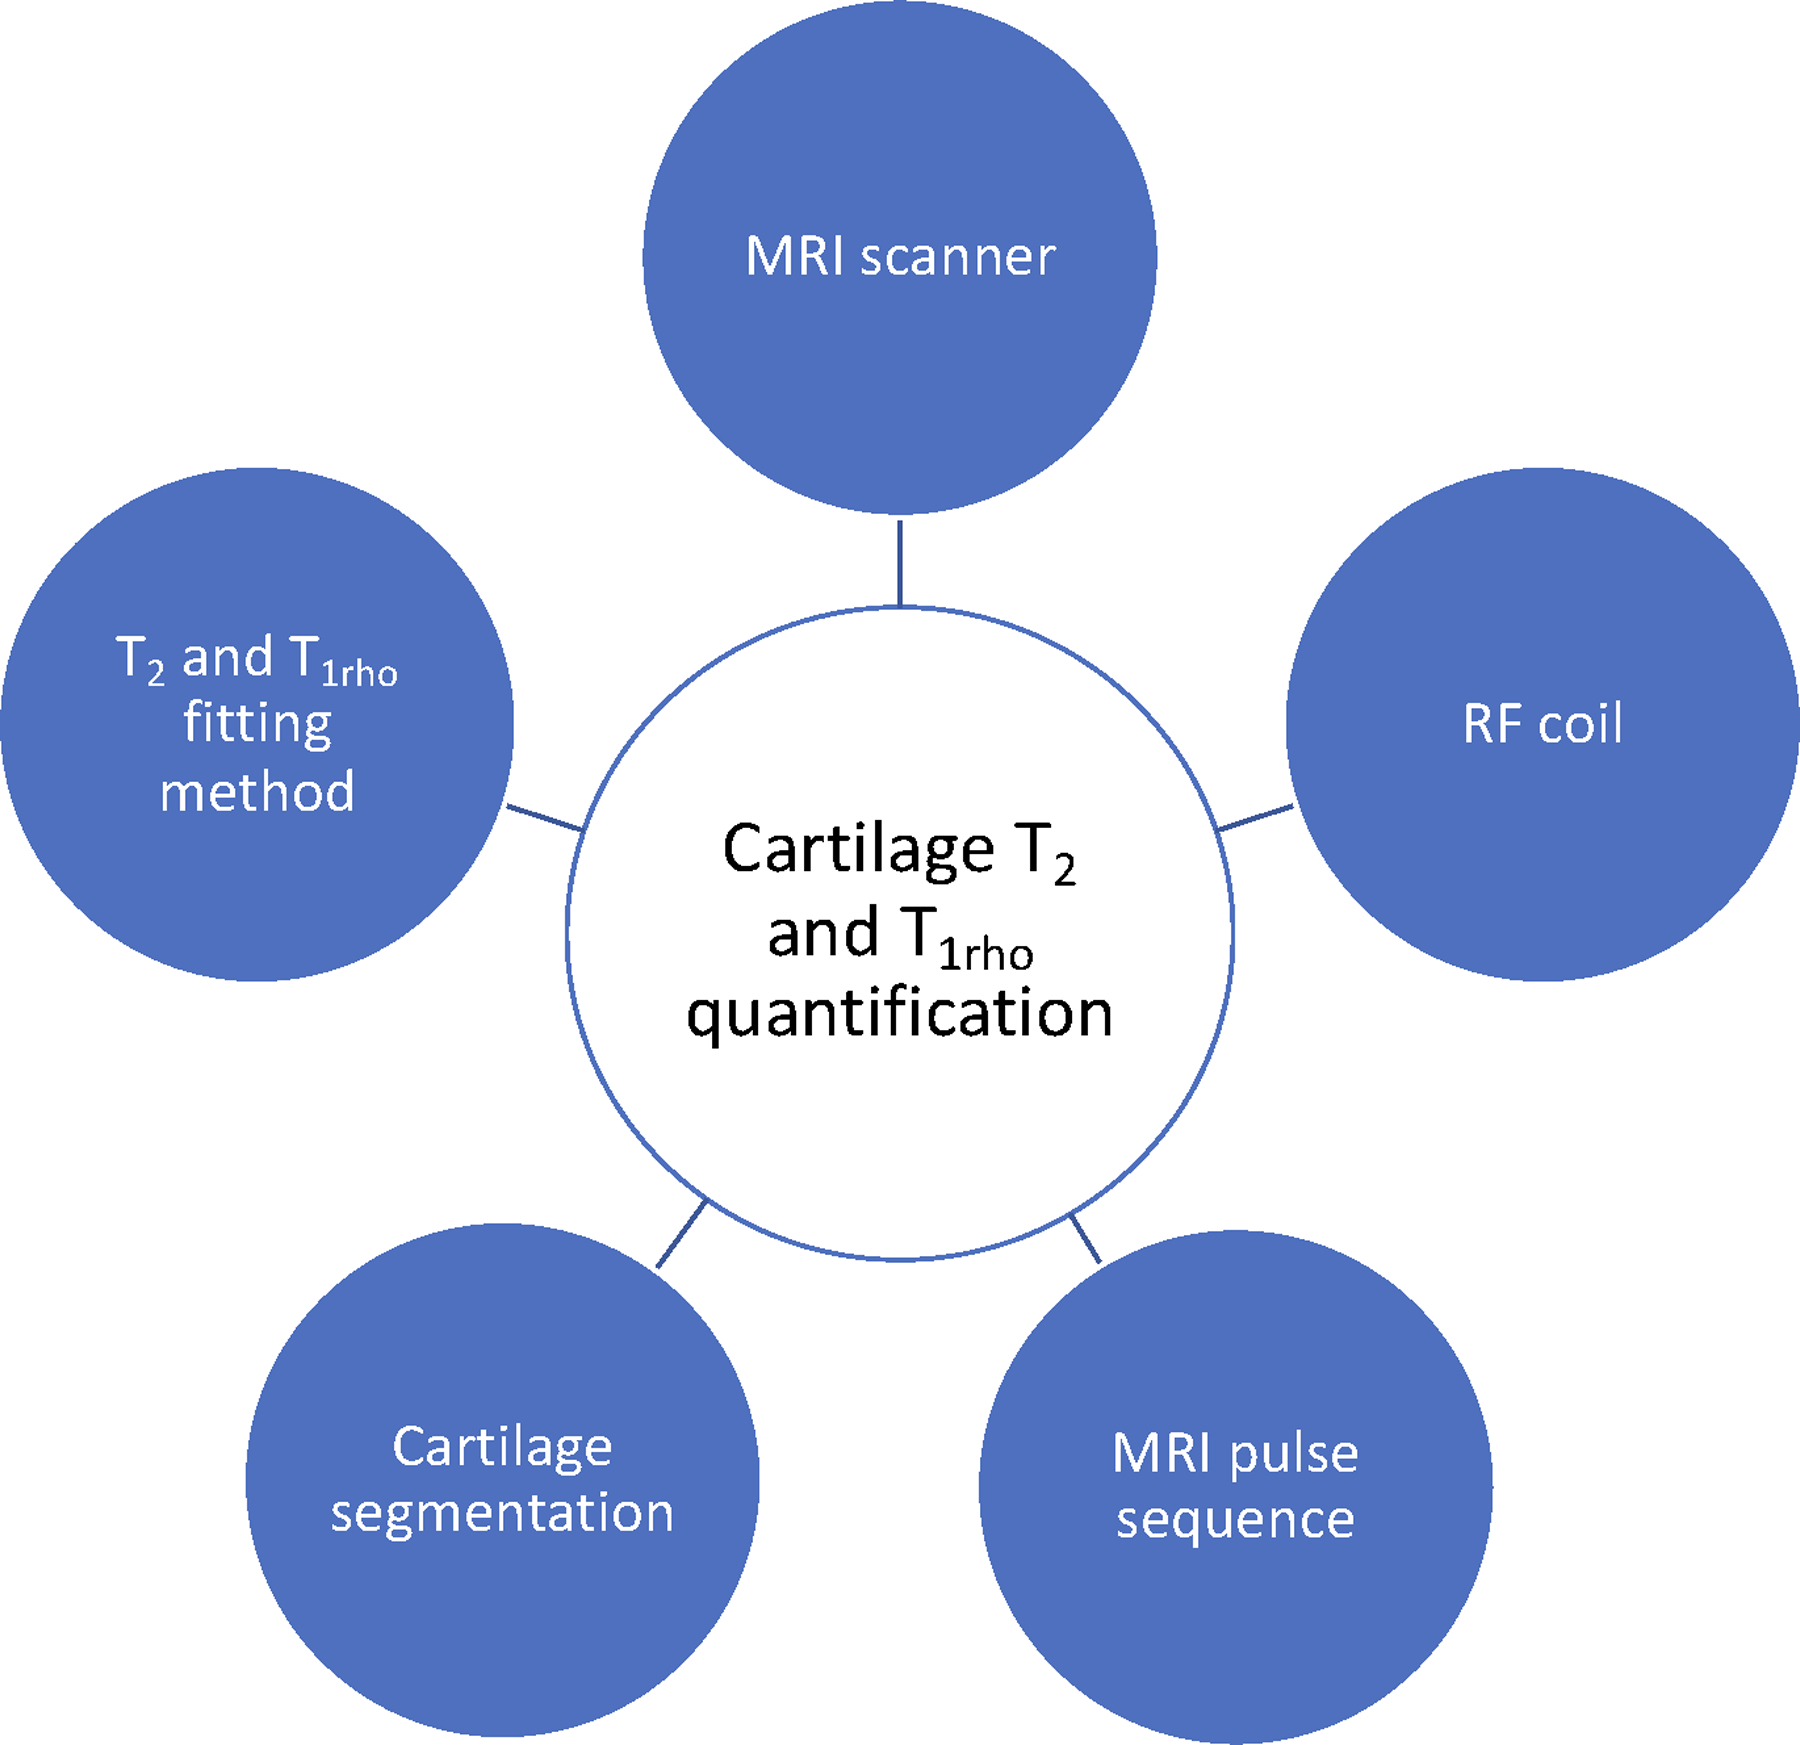
Factors that affect T2 and T1rho Quantification.
Validation:
Both T2 and T1rho mapping sequences have been validated in multiple studies and have demonstrated significant association with cartilage matrix composition as summarized in a recent systematic review (16). Different study designs investigated cartilage specimens (21, 22) and also used arthroscopy as a standard of reference (23, 24). Specimen studies found higher T2 values with increasing histological degeneration of cartilage using cadaveric specimens and specimens obtained from total knee replacements (21, 22). While specimen studies have inherent limitations such as potentially more advanced degenerative disease, they are also the only way to directly correlate quantitative MRI findings with histo-pathology. Soellner et al. correlated T2 values of cartilage obtained in patients who underwent arthroscopy with International Cartilage Repair Society (ICRS) defect scores. Focusing mostly on mild, particularly grade 1 and 2 cartilage lesions they found that T2 values increased with higher ICRS scores (23). Another study investigated the association of T2 values with cartilage defect severity (using ICRS scores) and indentation stiffness, which is a novel approach (24). These investigators found that T2 values were associated with degree of cartilage defect severity, but they did not see significant correlations between Young’s modulus derived from indentation and T2 values. Similar validation studies were performed for T1rho. Li et al (25) analyzed cartilage specimens obtained during total knee arthroplasty and scanned these at 3T. These investigators found that T1rho values in the cartilage specimens were moderately, yet significantly correlated with proteoglycan content (R=.45, P=.002) and T1rho values increased with higher histological Mankin scores (Figure 2). Similar results were obtained in a canine model of knee osteochondral injury where moderately strong correlations between T1rho values and cartilage proteoglycan concentrations were found (−0.38; p < 0.05), however, correlations were stronger between the T1rho values and histological assessment of cartilage using the Osteoarthritis Research Society International histologic scoring system for canine OA (r=0.58, p < 0.0001) (26). It should, however, also be noted that one study did not show significant correlations between T1rho values and cartilage sulphated glycosaminoglycan content (27).
Figure 2:
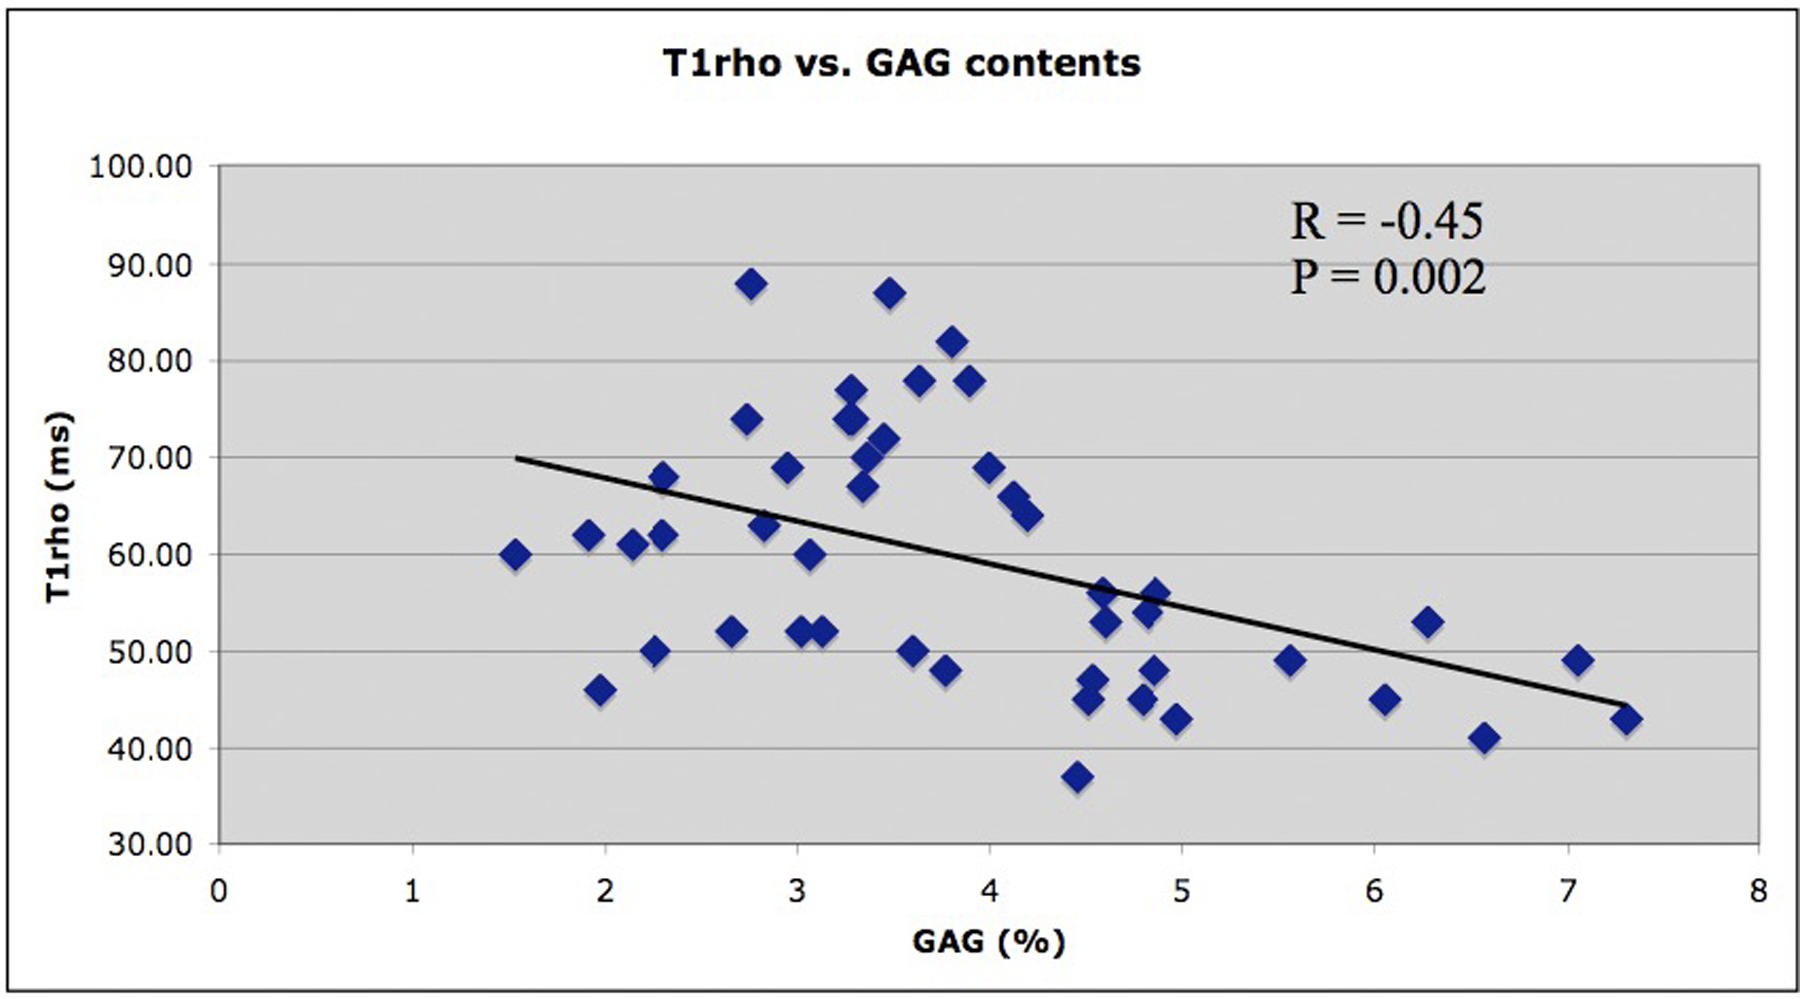
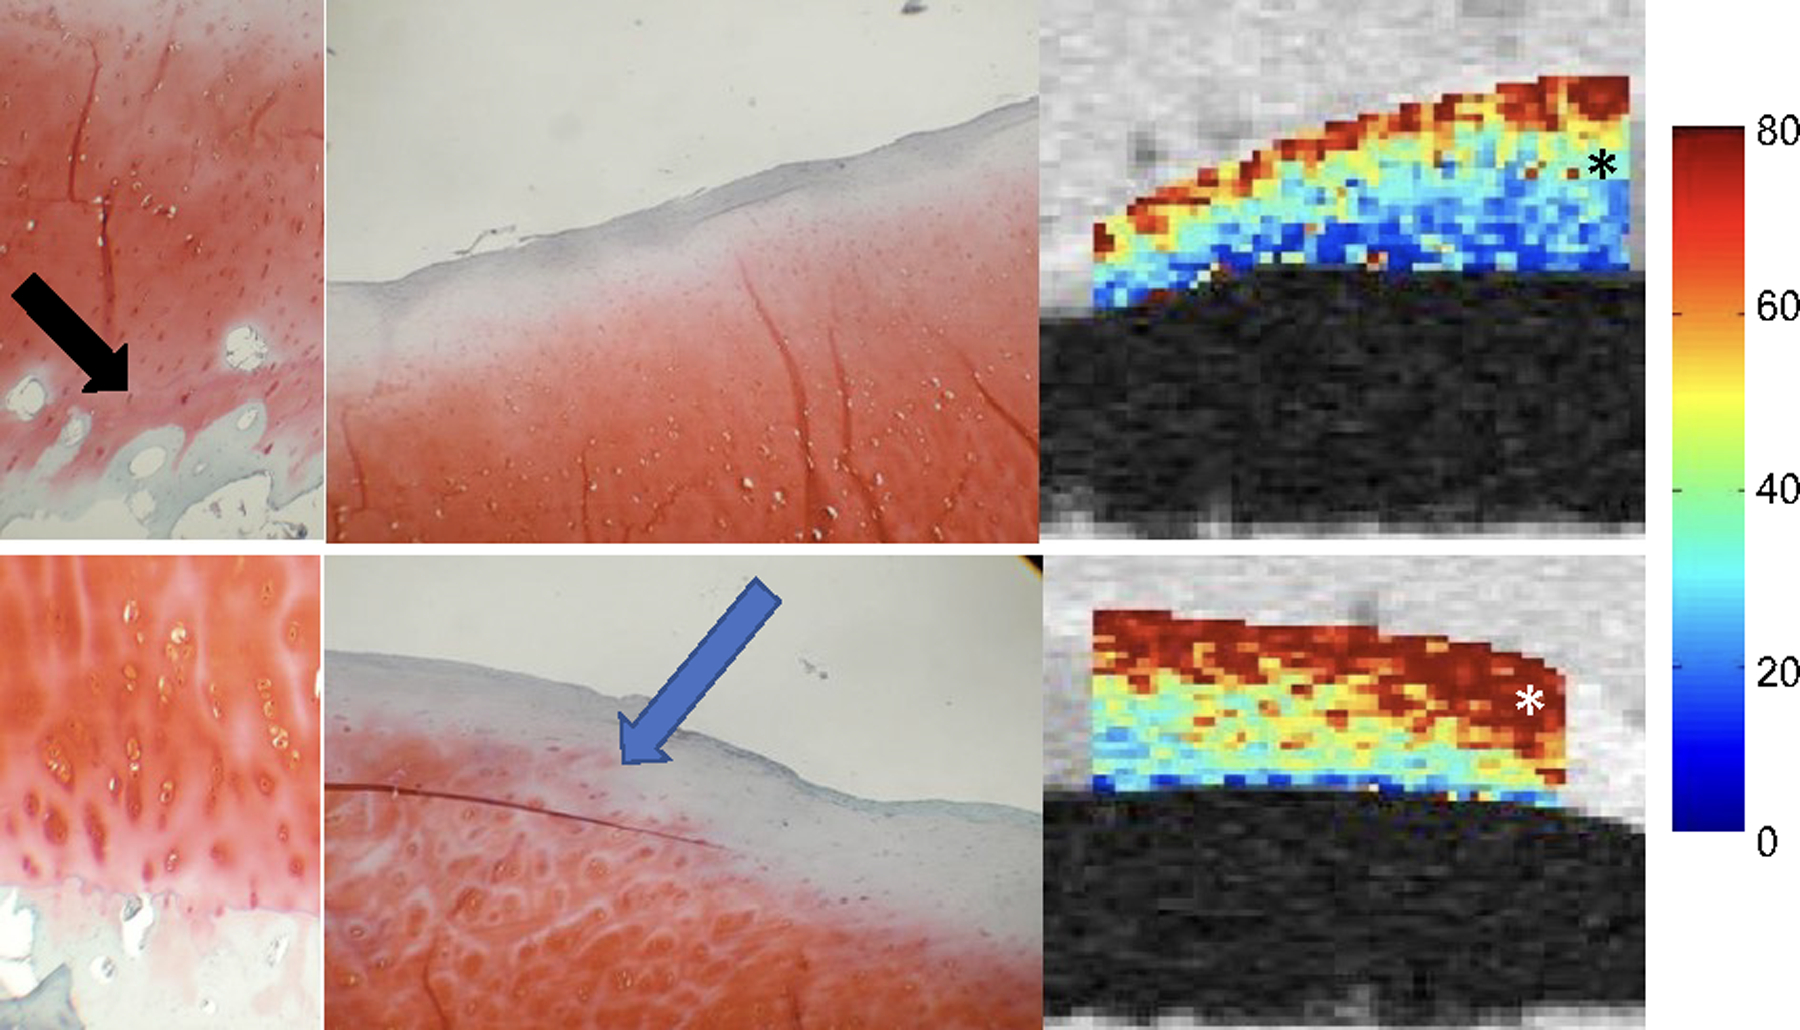
T1rho values were significantly correlated with proteoglycan content (a) and T1rho values increased with higher histological Mankin scores (b) (including loss of proteoglycan). In Figure 2b, the top row shows a section with a low overall Mankin score of 2, because of the presence of mild surface irregularities and the infiltration of blood vessel across the tidemark (left, black arrow). The Safranin-O staining shows no detectable loss (center), corresponding to a score of 0. The region has a relatively low T1ρ value of 50.6 ± 31.3 ms (right, black asterisk). The bottom row shows a section with a higher overall Mankin score of 5, due to surface irregularities, pannus, cell cloning, and loss of safranin-O staining (left). The Safranin-O score was 1 due to focal loss of Safranin-O staining (center, blue arrow). The region has a relatively high T1ρ value of 77.1 ± 35.8 ms (right, white asterisk). Data were collected using cartilage specimens harvested from patients who underwent total knee arthroplasty. Figures edited from reference (25) with permission.
Results of clinical studies:
Cartilage T2 and T1rho compositional measures have been shown to differentiate patients with and without osteoarthritis, and to provide information on disease burden (28–31). These measurements were also found to predict progressive degenerative disease, radiographic OA and pain development (10, 11, 32, 33, 34) (Figure 3) as well as monitor interventions such as weight loss and viscosupplementation (35–41). We have also learned that cartilage compositional biomarkers may have a more limited role in patients with more advanced disease (42). Moreover, it should be noted that studies have shown that cartilage compositional measures are correlated with clinical findings such as pain and function (28, 43–46).
Figure 3:
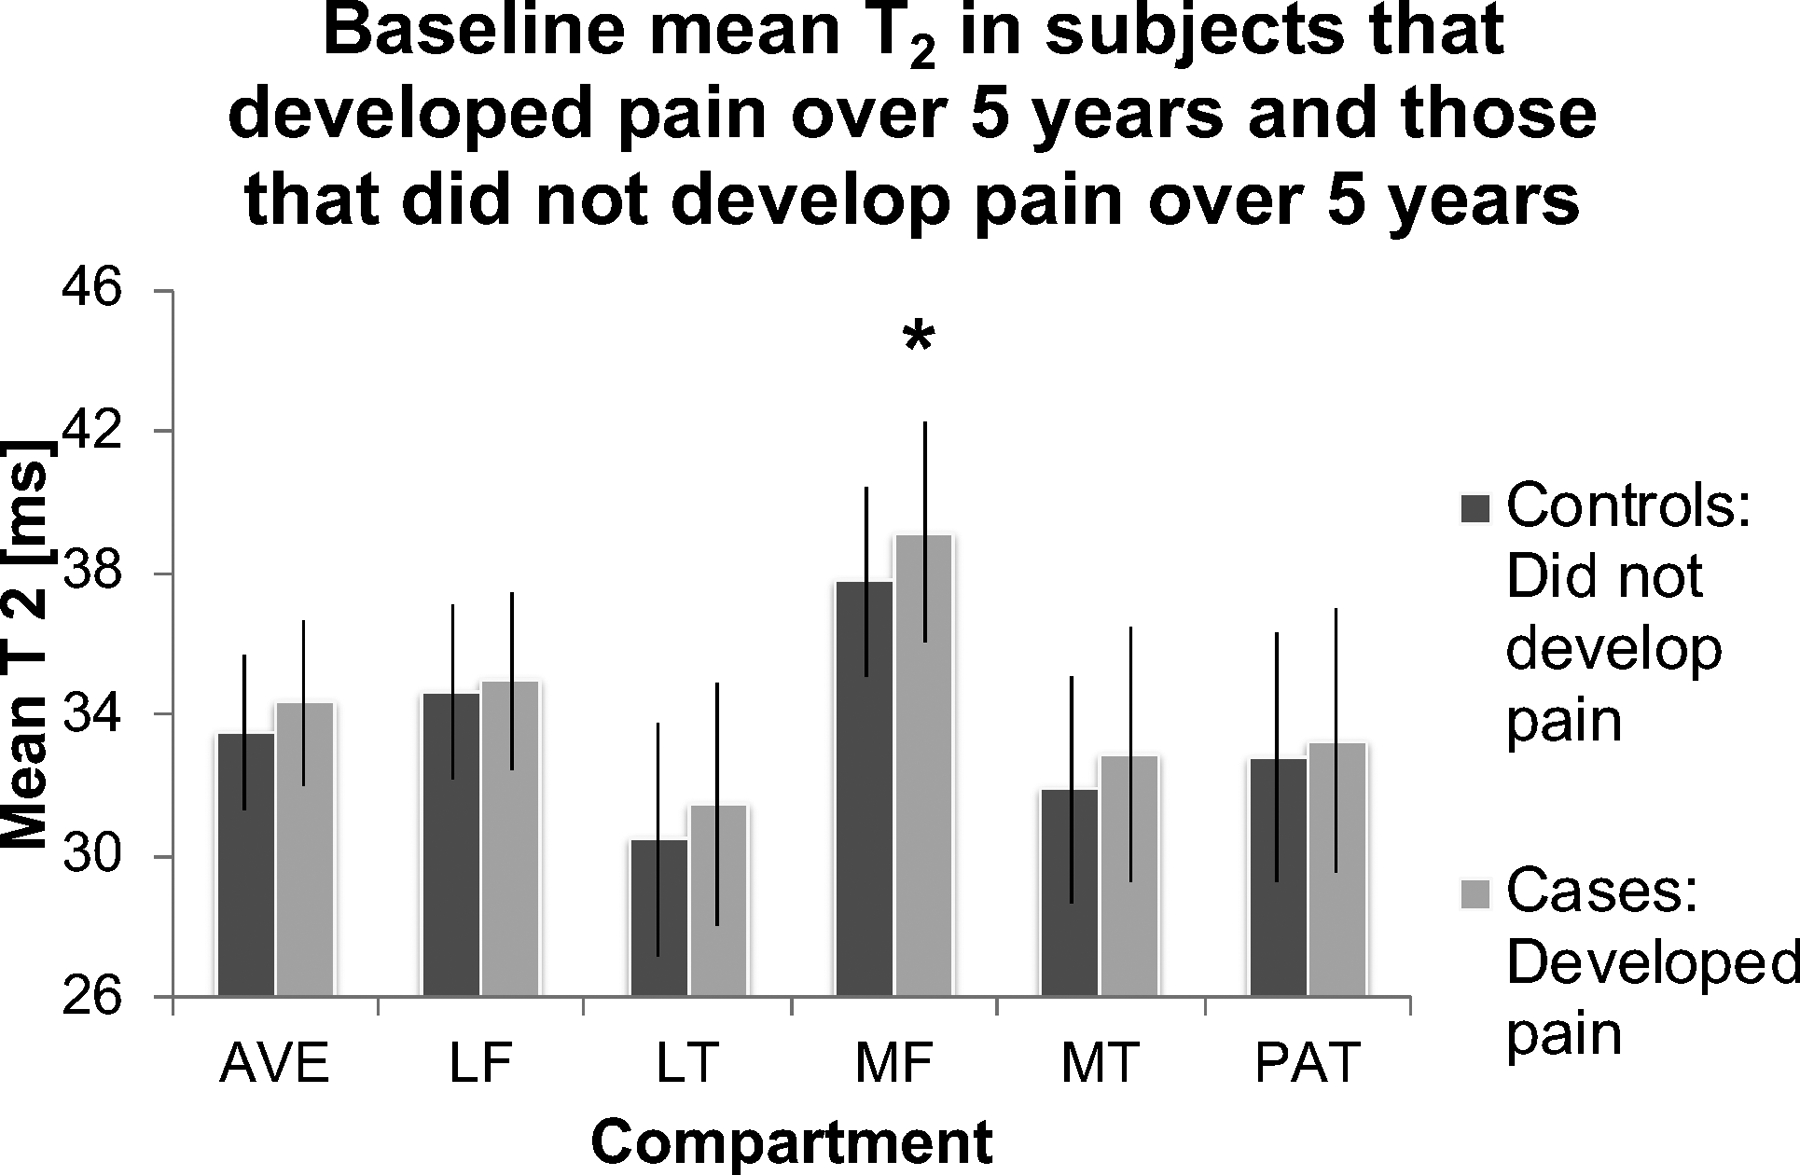
T2 measurements predict pain over 5 years, data from the OAI (34). Cases and controls were selected based on pain in the right knee. Controls were frequency-matched to cases based on age and gender: cases (n = 51), developed right knee pain over 5 years (WOMAC score = 0 at baseline; WOMAC pain score ≥ 0 at 3-year follow-up; WOMAC pain score > 2 at 5-year follow-up). Controls (n = 156), did not develop right knee pain over 5 years (WOMAC pain score = 0 at baseline; WOMAC pain score = 0 at 3 years follow-up; WOMAC pain score = 0 at 5-year follow-up). Cases had significantly elevated mean cartilage T2 in the medial femur compared to controls (OR per SD change= 1.69, p = 0.019, CI = 1.09–2.63), * indicates significant differences. All other compartments are P>0.05. AVE: average of all regions; LF: Lateral Femur; LT: Lateral Tibia; MF: Medial Femur; MT: Medial Tibia; PAT: Patella.
Most of the data published to date originates from the Osteoarthritis Initiative (OAI) cohort, as the MRI protocol included T2 mapping of more than 4000 individuals observed over 8 years. While it is acknowledged that over-reliance on a single cohort has inherent limitations, the OAI cohort has generated valuable cartilage quantitative MR imaging data setting the stage for additional studies and potentially also clinical application of this technology. One of the largest studies published to date used artificial intelligence based algorithms to automatically segment cartilage and calculate T2 values in 4796 unique individuals and 25,729 MRI studies in total (11). These investigators analyzed the performance of T2 values in predicting radiographic OA and total knee replacement. They found that individuals in the highest 25% quartile of tibio-femoral cartilage T2 measurements had a significantly higher likelihood for incident radiographic OA with odds ratios on the order 4.73–5.71 for 2-year incidence and 3.16–4.31 for 4-year incidence. Results for prediction of total knee replacement after 5 years were lower and only significant for medial femur T2 values (odds ratio = 1.32). Another study that should be highlighted investigated cartilage plates from knees which developed new-onset cartilage lesions over a 4-year period, comparing against cartilage plates from control knees at both the focal lesion and cartilage plate level (47). The authors showed that, at the local level, cartilage T2 values were significantly higher in case knees at 1 year prior to lesion onset, and at 2 years prior to onset at the plate level. In a similar study Apprich et al. reported that axial T2 mapping in patients with untreated early-stage patellar cartilage lesions could differentiate progressive patellar cartilage defects from those that did not progress (48). Another important study investigated participants from the OAI with radiographically normal knees but contralateral, atraumatic joint space narrowing (49). Comparing these knees with bilaterally normal knees these investigators found a significantly greater longitudinal increase in deep layer cartilage T2 relaxation times over 4 years. They concluded that radiographically normal knees with contralateral joint space narrowing may be a practical and feasible model for early OA, and that this model may be useful for clinical trials by testing the efficacy of structure-modifying therapeutic approaches in maintaining cartilage composition before the onset of more advanced degenerative joint disease (49).
What is required to apply these methods clinically and in a trial setting?
In order to apply cartilage compositional methods clinically and in clinical trials, a number of additional steps are required which include (i) automatic cartilage segmentation and analysis techniques, (ii) faster imaging techniques which allow accelerated imaging by maintaining reproducibility, (iii) standardization of the methodology across different MRI scanners and different vendors with high reproducibility and finally (iv) reference values and definition of normal and abnormal T2 and T1rho values (Figure 4).
Figure 4:
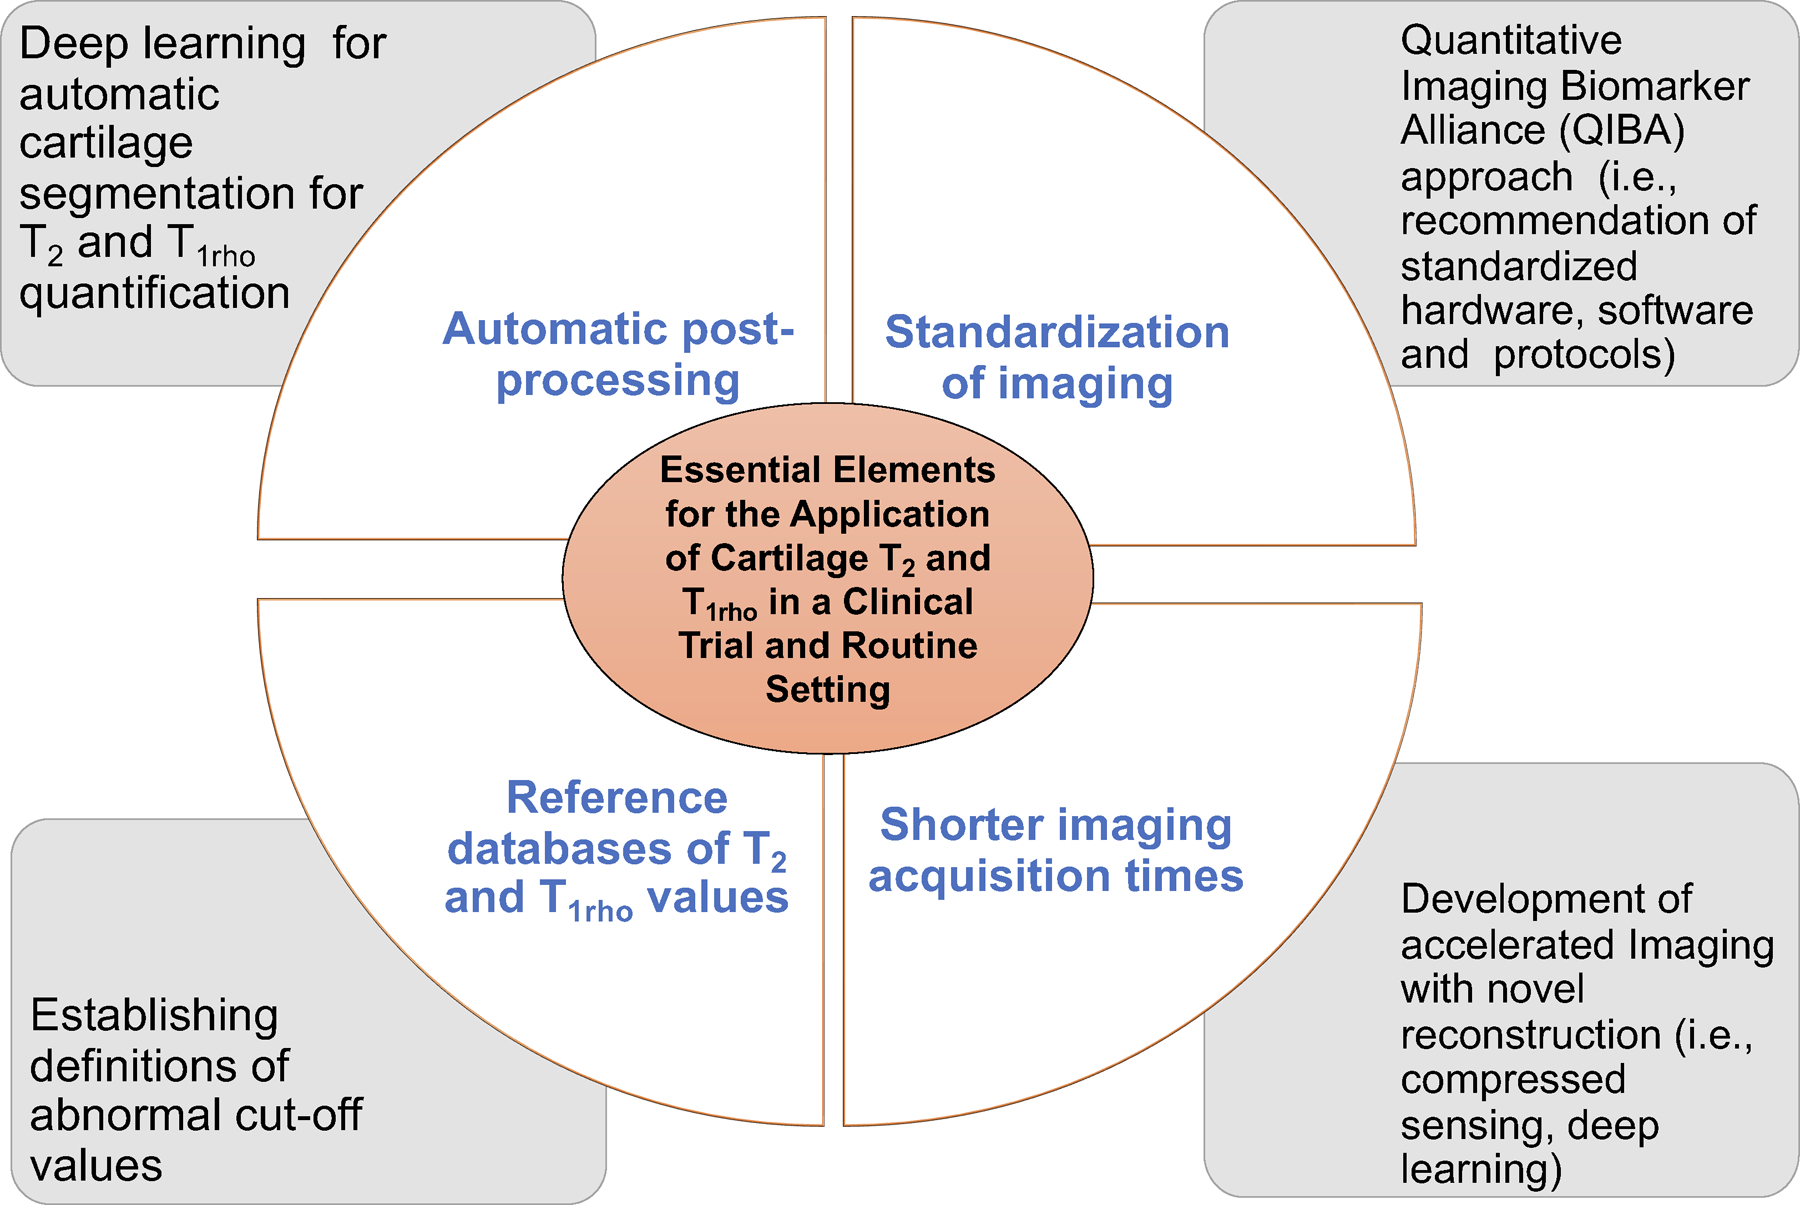
Challenges and potential solutions for the application of T2 and T1rho in a clinical and research trial setting.
(i) In the past, manual cartilage segmentation (requiring a minimum of 30 minutes to several hours per knee MRI) was needed to quantify cartilage composition; thus, analysis of large T2 or T1rho datasets and implementation in clinical practice was challenging. Recently, however, cartilage segmentation and analysis have been significantly improved by novel artificial intelligence-based cartilage segmentation and analysis tools. In a recent study, Razmjoo et al. used a machine learning based segmentation model for automatic cartilage segmentation of the entire OAI dataset and calculated T2 relaxation time values in 25,729 knee MRI studies (11). These researchers found that T2 values calculated with the machine learning model were comparable with those obtained by manual, semiautomatic cartilage segmentation. Other studies also demonstrated feasibility and good performance of machine-learning based cartilage segmentation in knee MRI datasets (50–54). Norman et al. used a deep learning model based on U-Net convolutional network architecture to perform automatic segmentation of 683 MR imaging studies and found a good performance using 3D Dual echo steady state (DESS) sequences with Dice similarity coefficients ranging from 0.770 to 0.878 for cartilage and 0.753 to 0.809 for the menisci (55). The Dice similarity coefficient is a statistical tool which measures the similarity between manual or semi-automatic segmentation of cartilage performed by a trained operator (ground truth) and deep learning-based segmentation with 1 being a perfect match and 0.8–0.9 generally considered as good and useful. Gatti et al. obtained similar results in knee MRIs with Dice coefficients ranging from 0.913 to 0.876 for different cartilage compartments with even better results for healthy cartilage on MRI (53). Finally, Gaj et al. developed conditional generative adversarial networks to improve segmentation performance of convolutional neural networks (52). Results from the “Knee MRI Segmentation Challenge” during the 2019 International Workshop on OA Imaging demonstrated that six different deep learning methods obtained mean Dice ranging from 0.8 to 0.9 for cartilage and meniscus using sagittal DESS images from the OAI cohort (50) (Figure 5).
Figure 5:
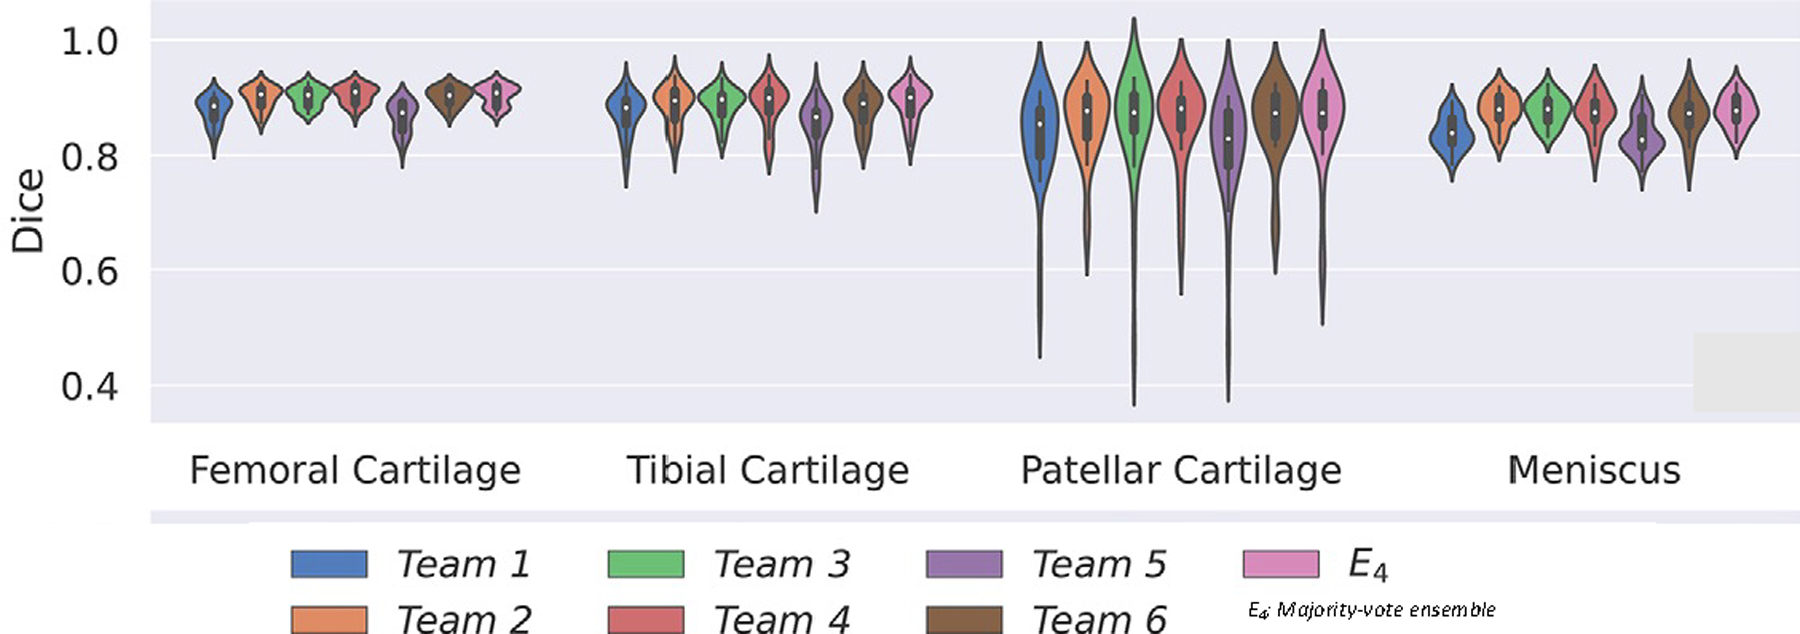
Example of knee cartilage and meniscal segmentation showing mean Dice coefficients of six deep learning methods from the 2019 International Workshop on OA Imaging knee MRI segmentation challenge. Different networks provided similar performance, with Dice coefficients ranging from 0.8–0.9, and voting ensembles did not exceed individual network performance. Figures edited from reference (50) with permission.
(ii) The development of cartilage compositional imaging techniques has also been challenged by long MRI acquisition times, which have in the past hampered the use of these techniques outside of research applications (56). However, recent developments have improved feasibility to use these techniques in a clinical environment by implementing fast acquisition techniques. Different technologies have been used which include parallel imaging, compressed sensing (CS), and deep learning-based reconstruction algorithms. The combination of parallel imaging and CS has been found helpful in reducing cartilage T1rho acquisition times using acceleration factors up to 8–10 (57–59). MR fingerprinting is a new method that allows simultaneous measurement of multiple tissue properties in a single time-efficient acquisition. Previous studies have shown that this technology can analyze multiple cartilage MR parameters such as T2 and T1rho at the knee simultaneously (60). Recently, researchers have also applied deep learning-based reconstruction techniques to accelerate acquisition of cartilage T2 and T1rho imaging (61). High acceleration factors (≥20) were achieved for both retrospective and prospective under-sampled data with high agreement to the reference maps (61), (Figure 6). It needs to be acknowledged that most of these fast imaging techniques are currently still under development and not yet part of clinical routine protocols.
Figure 6:
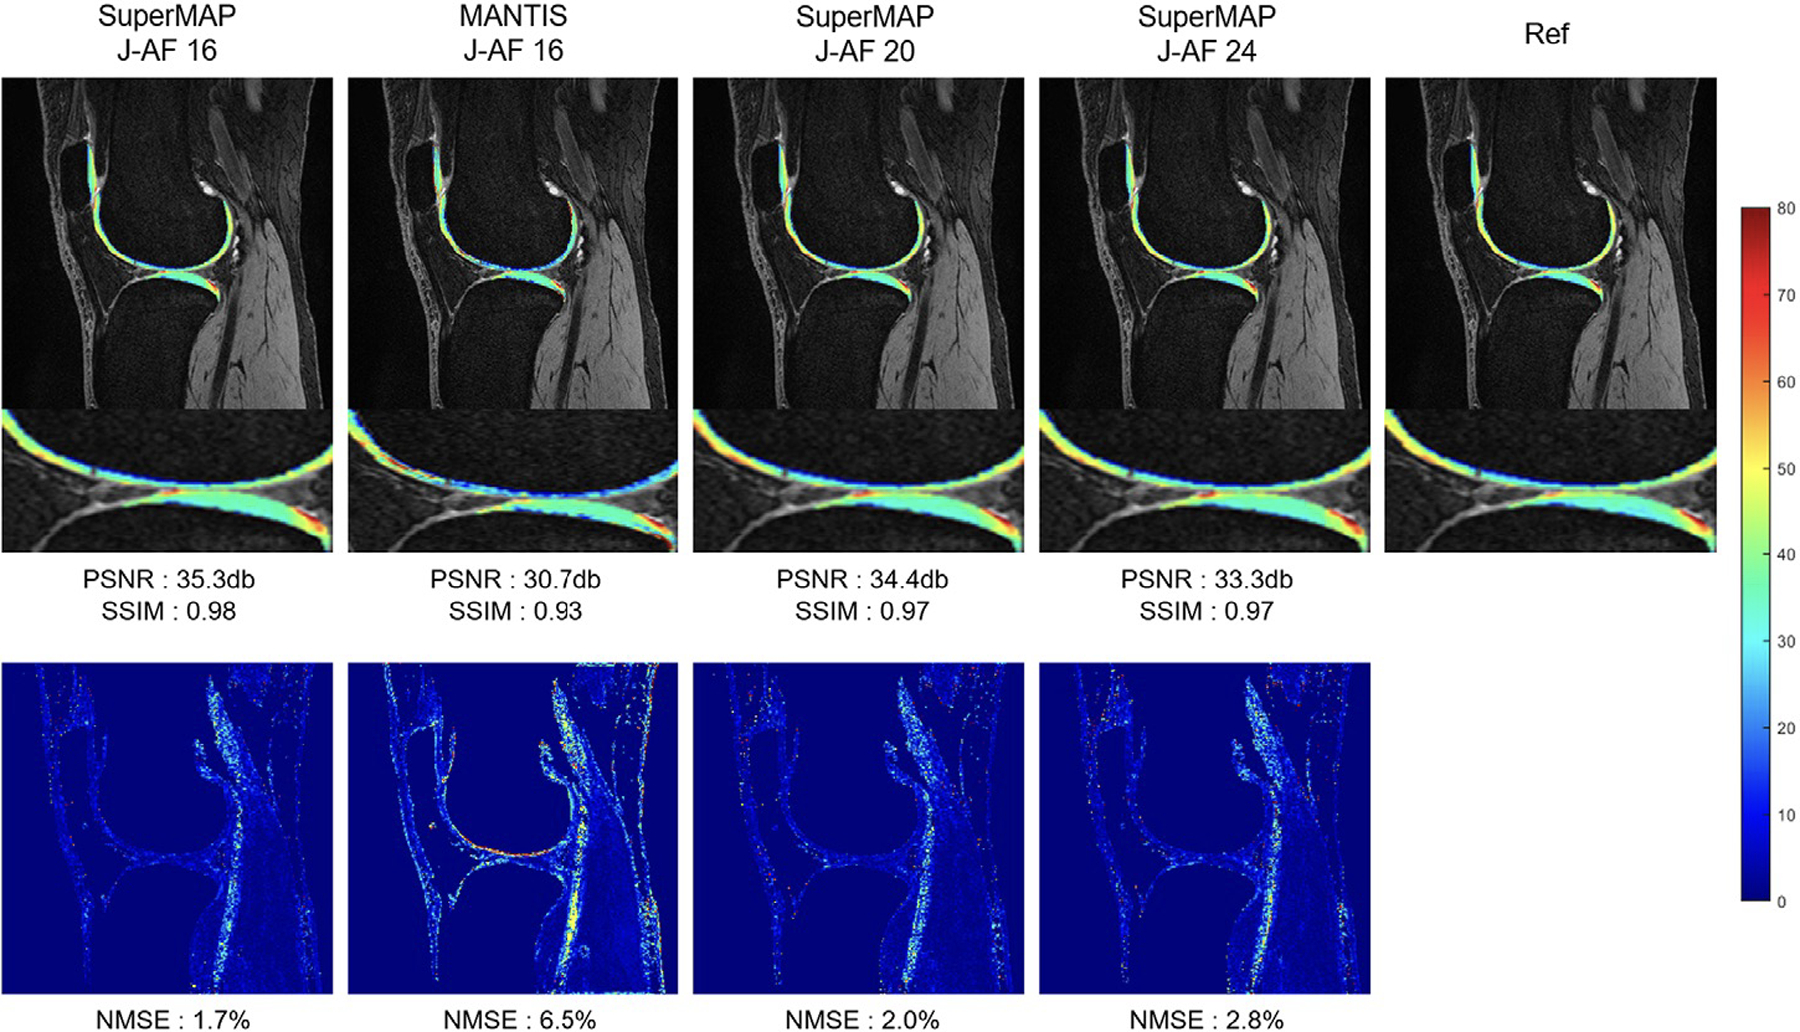
T1rho maps reconstructed using SuperMAP and MANTIS methods with down-sampled data (top) and corresponding error maps compared to the reference map generated with fully-sampled data (bottom). SuperMAP is a novel deep learning framework that directly converts a series of undersampled (both in k-space and in parameter dimension), parameter-weighted images (e.g. T1rho or T2-weighted images) into quantitative maps (e.g. T1rho or T2 maps), bypassing the conventional exponential fitting procedure. This network incorporates patch wise training with the entire image as the backward cycle (model-data) for consistency. Maps with joint acceleration factor (J-AF) of 16, 20 and 24 using SuperMAP are demonstrated, which provide more superior performance compared to maps reconstructed with MANTIS using J-AF 16. NMSE, normalized mean squared error; PSNR, peak signal to noise ratio; SSIM, structural similarity index. MANTIS: Model-Augmented Neural neTwork with Incoherent k-space Sampling (66). Figures edited from reference (61) with permission.
(iii) Having addressed the problem of automatic segmentation and shorter acquisition times, the next step is to standardize the methodology across different MRI scanners and different vendors with high reproducibility. Standardization of acquisition and sequences across different sites and vendors is critical to be able to compare cartilage compositional measurements, which is important for longitudinal studies with respect to demonstrating progression of disease or impact of interventional disease management. In order to achieve this goal, the Quantitative Imaging Biomarker Alliance (QIBA) approach was used. The QIBA was formed by the Radiological Society of North America to advance quantitative imaging in medicine. Biomarker committees including radiologists, researchers, healthcare and industry professionals were established to standardize imaging biomarkers by creating so-called profiles. One of these is the QIBA profile for MRI-based compositional imaging of knee cartilage which was highlighted and explained in a recent publication by the QIBA musculoskeletal biomarker committee (62). This profile specifically focuses on T2 and T1rho compositional imaging as these techniques are validated and clinically feasible using standard clinical (mostly 3T) MRI scanners. The profile gives clear recommendations on patient selection, handling and positioning, data acquisition including scan parameters, hardware and image reconstruction. It also includes recommendations for quality assurance and staff qualification. Using these criteria cartilage compositional imaging is standardized and reproducibility is improved. The profile also includes claims which are longitudinal and state that using profile parameters cartilage T2 and T1rho can be measured using 3T MRI with a within-subject coefficient of variation of 4%−5% using scanners of the same type and manufacturer. Multi-site studies are currently in progress to establish whether the profile is feasible and practical for use in a clinical and research environment. In addition, calibration phantoms are being developed to further improve standardization of measurements both longitudinally and across different sites (62). Preliminary studies have demonstrated promising results and confirmed the longitudinal claims (20, 63). Kim et al investigated a 3D MAPSS T2 and T1rho imaging sequence that was implemented at MRI systems from different manufacturers (20). These investigators examined both phantoms and volunteers and found intra-site coefficients of variation that ranged from 1.1% to 3.1% for T1rho and 1.8–3.3% for T2 in phantoms, and 1.6–3.9% for T1rho and 1.4–4.1% for T2 in volunteers. These results are consistent with the claims stated in the QIBA profile, but it should also be noted that coefficients of variation were higher between MRI scanners from different manufacturers. It should be noted that these coefficients of variation are slightly higher than those obtained for clinical DXA BMD measurements (1–3%) but still in an acceptable and useful range for a clinical imaging biomarker.
(iv) Another important requirement essential for establishing a cartilage compositional imaging biomarker is a reference database of T2 or T1rho values in healthy individuals based on demographics such as age, sex, and BMI ranges. Such a reference database could be used to quantify standardized scores of disease severity. However, this is challenging as a large number of individuals with normal cartilage need to be analyzed using standardized MR imaging methods. To date, imaging databases that provide this type of information are limited and the largest cohort with cartilage T2 compositional measurements is the OAI cohort. Selection criteria for such a database need to be rigorous and individuals across different age groups and genders need to be included. One of the largest reference databases published to date used 481 individuals from the OAI aged 45–65 years (64). To focus on relatively normal joints without or minor degenerative disease only individuals without radiographic OA (Kellgren-Lawrence (KL) grade 0 and 1) were included in this study and only if they had at least one cartilage compartment (selected from medial and lateral femur and tibia as well as patella) without cartilage defects defined as a Whole ORgan MRI Score (WORMS) of 0 or 1 (normal cartilage or cartilage with signal abnormality). From this database reference T2 values were calculated in percentiles for the different cartilage compartments divided according to gender, age and body mass index (BMI) (Table 1). The highest T2 values were found for the medial femur cartilage compartment and T2 values in this compartment were also significantly higher in women than in men. The association between age and cartilage T2 was limited by a small age range (from 45–65 years) and weak, positive associations were found, that were significant for medial femur and patellar cartilage compartments.
Table 1:
Reference values for cartilage T2 based on gender and BMI groups in the medial femur (left). The association between adjusted mean cartilage T2 and age in the medial femur (right). (Modified from (64).)

|
After establishing a reference database, it is also required to define cut-off values for T2 and T1rho values differentiating normal and abnormal values and ideally divide abnormal values according to disease severity; the latter could be based on prediction of knee joint structural degeneration. Ideally not absolute T1rho and T2 values should be used, which would limit comparison between values obtained with different sequences and MRI scanners, but relative measurements such as Z-scores, which are also used for bone mineral density (BMD). Using T2 Z-scores at baseline, Joseph et al. investigated the probability of progressive knee joint degeneration over 4 to 8 years (65). Using MRI data from 587 OAI participants they found that a one-unit increase in the baseline medial femur T2 Z-score was associated with cartilage worsening, joint space narrowing and increase in KL grades (Figure 7). Using medial femur T2 Z-scores from 2–4 they found a 70% increase in probability for progressive cartilage degeneration over 4 years. These Z-score cut-off values may be useful in the future to define normal and abnormal cartilage composition. They are also similar to those used for BMD measurements where in men younger than age 50 and pre-menopausal women a BMD value with a Z-score lower than 2 is defined as abnormal according to the official positions of the International Society for Clinical Densitometry (https://iscd.org/wp-content/uploads/2021/09/2019-Official-Positions-Adult-1.pdf). While these Z-scores were validated for T2 measurements using the MESE sequence with Siemens 3T scanners in the OAI (65), data are more limited for other sequences, manufacturers and specifically T1rho measurements. Larger scale studies are required to establish these reference databases and cut-off values for normal and abnormal cartilage compositional measurements, also using newer sequences that allow measurements of T2 and T1rho at the same time.
Figure 7:
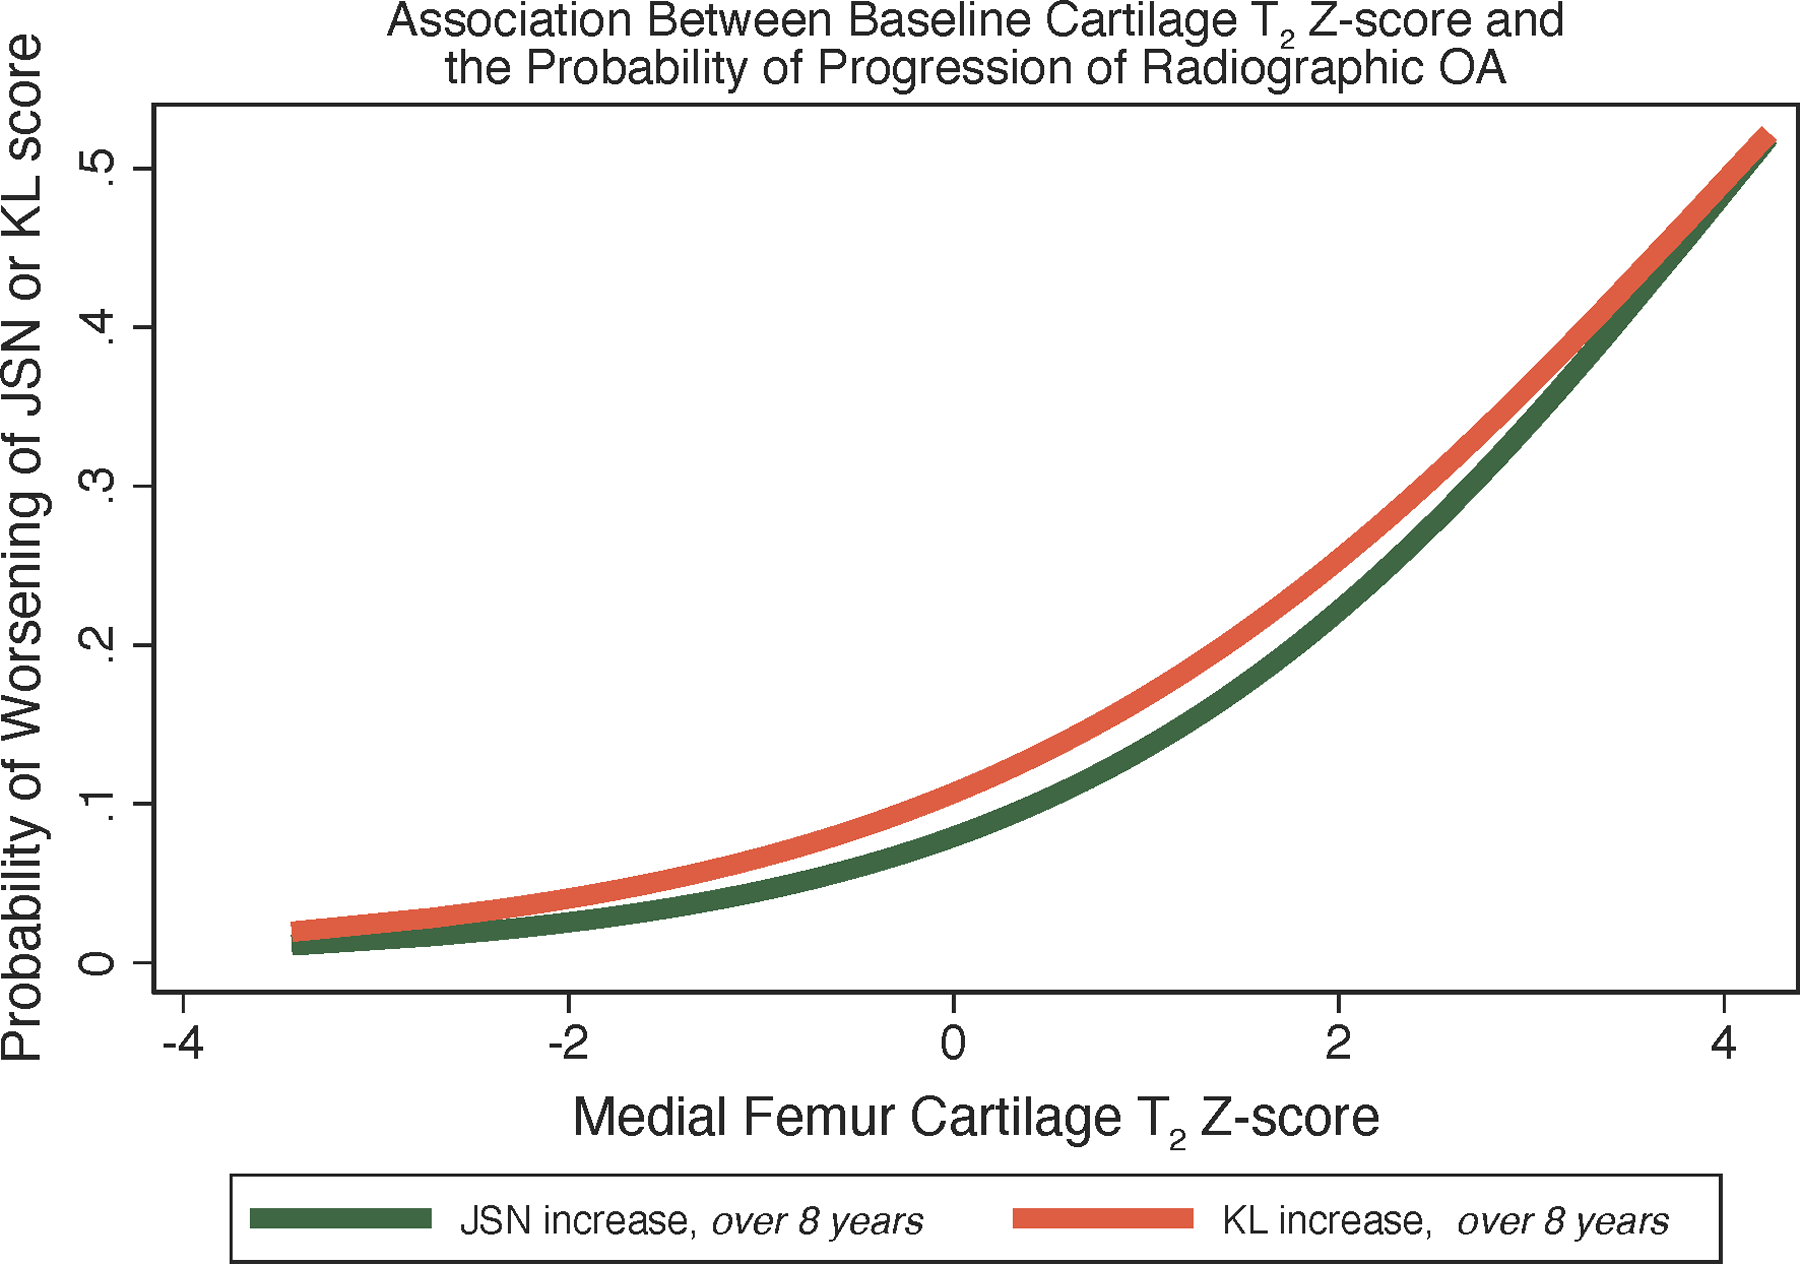
The predicted probability of worsening of KL score over 8 years (orange), and joint space narrowing (JSN) change over 8 years (green). Modeled values are based on logistic regression models with baseline cartilage T2 Z-score in the medial femur as a predictor. For both outcomes, the probability of incidence/progression increases as a function of cartilage T2 Z-score in the medial femur. (Modified from (65).) Calculation of T2 Z-score may help identify patients at risk for OA progression who would benefit from lifestyle intervention.
While image acquisition technologies have advanced, and deep learning-based segmentation of cartilage has come a long way, we acknowledge that technical standardization of compositional imaging and establishing reference databases with cut-off points of normal versus abnormal cartilage are still significant challenges which limit application of this technology in clinical trials and clinical practice. One additional major final hurdle to overcome is also finding a clinical need to justify an expensive test such as MRI to measure cartilage composition. The example of BMD in osteoporosis may serve again as a role model; with the introduction of effective pharmacotherapies to prevent osteoporotic fractures, DXA-based BMD measurements became a standard not only to decide on treatment but also to monitor pharmacotherapies. This clear impact on patient management is not as well defined in OA, where there are no effective disease-modifying drugs that would require an imaging test to initiate and monitor treatment. However, with the development of these pharmacotherapies, the need for clinical trials with shorter observation periods and finally their clinical application to identify patients that would benefit from these treatments there may be a need to make cartilage compositional imaging widely available.
Conclusion and Outlook
Previous studies have validated T2 and T1rho measurements for characterizing cartilage matrix composition and have shown that these measures can assess disease burden and predict radiographic OA. Moreover, cartilage T2 and T1rho compositional measures can identify cartilage matrix abnormalities before cartilage defects occur, when damage is still potentially reversible and T2 and T1rho can also monitor impact of interventions such as weight loss and viscosupplementation. Great progress has also been made in developing deep learning-based, fully automated cartilage segmentation and faster imaging techniques, which will facilitate availability of this technology at lower cost. Establishing standardized measurements with high reproducibility is currently work in progress through the RSNA QIBA mechanism, which has provided a profile including clinical indications, patient handling as well as image acquisition and analysis. Most progress has been made establishing compositional cartilage imaging at the knee, while imaging at the hip has been challenged by the thin cartilage and a more challenging acquisition. What we still need are reference databases allowing to differentiate normal and abnormal cartilage composition and effective disease-modifying drugs that will prevent incidence and progression of OA. Once these drugs are available cartilage T2 and T1rho compositional measures could help decide whether to initiate treatment and provide quantitative measurements to monitor treatment. Meanwhile, even in the absence of disease modifying drugs for OA, compositional MRI, with standardized and improved acquisition and post-processing technologies, may have clinical utility in specific patient cohorts, which include those undergoing cartilage repair and joint preserving surgery (e.g., high tibial osteotomy, unicompartmental knee arthroplasty).
Key Points:
T1rho and T2 cartilage measurements have been validated in characterizing cartilage degenerative change using histology and arthroscopy as a reference.
They have also been shown to predict progression of cartilage degeneration and incidence of radiographic OA.
Advances have been made to facilitate clinical and trial application of T1rho and T2 by improved standardization of imaging and by establishing deep learning-based automatic cartilage segmentation.
Effective treatments with disease-modifying OA specific drugs may establish T1rho and T2 cartilage compositional measurements as biomarkers to initiate and monitor treatment.
Funding:
XL is supported by NIH R01AR075422, R01AR077452 and the Arthritis Foundation. GBJ is supported by NIH R01AR078917. TML is supported by NIH R01AR078917 and R01AR007452.
Footnotes
Consent for publication: approved by all authors, note that Figures 2, 5, 6 and 7 were previously published and permission was obtained.
Conflict of Interest/Competing interests: The authors declare that there are no competing financial interests.
The manuscript has not been published before and was only submitted to Skeletal Radiology.
References:
- 1.Hunter DJ, March L, Chew M. Osteoarthritis in 2020 and beyond: a Lancet Commission. Lancet. 2020;396(10264):1711–2. [DOI] [PubMed] [Google Scholar]
- 2.Safiri S, Kolahi AA, Smith E, Hill C, Bettampadi D, Mansournia MA, et al. Global, regional and national burden of osteoarthritis 1990–2017: a systematic analysis of the Global Burden of Disease Study 2017. Ann Rheum Dis. 2020;79(6):819–28. [DOI] [PubMed] [Google Scholar]
- 3.Hiligsmann M, Cooper C, Arden N, Boers M, Branco JC, Luisa Brandi M, et al. Health economics in the field of osteoarthritis: an expert’s consensus paper from the European Society for Clinical and Economic Aspects of Osteoporosis and Osteoarthritis (ESCEO). Semin Arthritis Rheum. 2013;43(3):303–13. [DOI] [PubMed] [Google Scholar]
- 4.Mahmoudian A, Lohmander LS, Mobasheri A, Englund M, Luyten FP. Early-stage symptomatic osteoarthritis of the knee - time for action. Nature reviews Rheumatology. 2021;17(10):621–32. [DOI] [PubMed] [Google Scholar]
- 5.Roos EM, Arden NK. Strategies for the prevention of knee osteoarthritis. Nature reviews Rheumatology. 2016;12(2):92–101. [DOI] [PubMed] [Google Scholar]
- 6.Emanuel KS, Kellner LJ, Peters MJM, Haartmans MJJ, Hooijmans MT, Emans PJ. The relation between the biochemical composition of knee articular cartilage and quantitative MRI: a systematic review and meta-analysis. Osteoarthritis Cartilage. 2022;30(5):650–62. [DOI] [PubMed] [Google Scholar]
- 7.Nieminen MT, Casula V, Nissi MJ. Compositional MRI of articular cartilage - current status and the way forward. Osteoarthritis Cartilage. 2022;30(5):633–5. [DOI] [PubMed] [Google Scholar]
- 8.Link TM, Neumann J, Li X. Prestructural cartilage assessment using MRI. J Magn Reson Imaging. 2017;45(4):949–65. [DOI] [PubMed] [Google Scholar]
- 9.Liebl H, Joseph G, Nevitt MC, Singh N, Heilmeier U, Subburaj K, et al. Early T2 changes predict onset of radiographic knee osteoarthritis: data from the osteoarthritis initiative. Ann Rheum Dis. 2014. [DOI] [PMC free article] [PubMed] [Google Scholar]
- 10.Prasad AP, Nardo L, Schooler J, Joseph GB, Link TM. T(1)rho and T(2) relaxation times predict progression of knee osteoarthritis. Osteoarthritis Cartilage. 2013;21(1):69–76. [DOI] [PMC free article] [PubMed] [Google Scholar]
- 11.Razmjoo A, Caliva F, Lee J, Liu F, Joseph GB, Link TM, et al. T2 analysis of the entire osteoarthritis initiative dataset. J Orthop Res. 2021;39(1):74–85. [DOI] [PubMed] [Google Scholar]
- 12.Owman H, Ericsson YB, Englund M, Tiderius CJ, Tjornstrand J, Roos EM, et al. Association between delayed gadolinium-enhanced MRI of cartilage (dGEMRIC) and joint space narrowing and osteophytes: a cohort study in patients with partial meniscectomy with 11 years of follow-up. Osteoarthritis Cartilage. 2014;22(10):1537–41. [DOI] [PubMed] [Google Scholar]
- 13.Crema MD, Hunter DJ, Burstein D, Roemer FW, Li L, Eckstein F, et al. Association of changes in delayed gadolinium-enhanced MRI of cartilage (dGEMRIC) with changes in cartilage thickness in the medial tibiofemoral compartment of the knee: a 2 year follow-up study using 3.0 T MRI. Ann Rheum Dis. 2014;73(11):1935–41. [DOI] [PubMed] [Google Scholar]
- 14.Brinkhof S, Nizak R, Khlebnikov V, Prompers JJ, Klomp DWJ, Saris DBF. Detection of early cartilage damage: feasibility and potential of gagCEST imaging at 7T. Eur Radiol. 2018;28(7):2874–81. [DOI] [PMC free article] [PubMed] [Google Scholar]
- 15.Madelin G, Xia D, Brown R, Babb J, Chang G, Krasnokutsky S, et al. Longitudinal study of sodium MRI of articular cartilage in patients with knee osteoarthritis: initial experience with 16-month follow-up. Eur Radiol. 2018;28(1):133–42. [DOI] [PMC free article] [PubMed] [Google Scholar]
- 16.Eck BL, Yang M, Elias JJ, Winalski CS, Altahawi F, Subhas N, et al. Quantitative MRI for Evaluation of Musculoskeletal Disease: Cartilage and Muscle Composition, Joint Inflammation, and Biomechanics in Osteoarthritis. Invest Radiol. 2022. [DOI] [PMC free article] [PubMed] [Google Scholar]
- 17.Zijlstra F, Seevinck PR. Multiple-echo steady-state (MESS): Extending DESS for joint T2 mapping and chemical-shift corrected water-fat separation. Magn Reson Med. 2021;86(6):3156–65. [DOI] [PMC free article] [PubMed] [Google Scholar]
- 18.Matzat SJ, McWalter EJ, Kogan F, Chen W, Gold GE. T2 Relaxation time quantitation differs between pulse sequences in articular cartilage. J Magn Reson Imaging. 2015;42(1):105–13. [DOI] [PMC free article] [PubMed] [Google Scholar]
- 19.Li X, Majumdar S. Quantitative MRI of articular cartilage and its clinical applications. J Magn Reson Imaging. 2013;38(5):991–1008. [DOI] [PMC free article] [PubMed] [Google Scholar]
- 20.Kim J, Mamoto K, Lartey R, Xu K, Nakamura K, Shin W, et al. Multi-vendor multi-site T1rho and T2 quantification of knee cartilage. Osteoarthritis Cartilage. 2020;28(12):1539–50. [DOI] [PMC free article] [PubMed] [Google Scholar]
- 21.David-Vaudey E, Ghosh S, Ries M, Majumdar S. T2 relaxation time measurements in osteoarthritis. Magn Reson Imaging. 2004;22(5):673–82. [DOI] [PubMed] [Google Scholar]
- 22.Regatte RR, Akella SV, Lonner JH, Kneeland JB, Reddy R. T1rho relaxation mapping in human osteoarthritis (OA) cartilage: comparison of T1rho with T2. J Magn Reson Imaging. 2006;23(4):547–53. [DOI] [PubMed] [Google Scholar]
- 23.Soellner ST, Goldmann A, Muelheims D, Welsch GH, Pachowsky ML. Intraoperative validation of quantitative T2 mapping in patients with articular cartilage lesions of the knee. Osteoarthritis Cartilage. 2017;25(11):1841–9. [DOI] [PubMed] [Google Scholar]
- 24.Svard T, Lakovaara M, Pakarinen H, Haapea M, Kiviranta I, Lammentausta E, et al. Quantitative MRI of Human Cartilage In Vivo: Relationships with Arthroscopic Indentation Stiffness and Defect Severity. Cartilage. 2018;9(1):46–54. [DOI] [PMC free article] [PubMed] [Google Scholar]
- 25.Li X, Cheng J, Lin K, Saadat E, Bolbos RI, Jobke B, et al. Quantitative MRI using T1rho and T2 in human osteoarthritic cartilage specimens: correlation with biochemical measurements and histology. Magn Reson Imaging. 2011;29(3):324–34. [DOI] [PMC free article] [PubMed] [Google Scholar]
- 26.Franklin SP, Stoker AM, Lin ASP, Pownder SL, Burke EE, Bozynski CC, et al. T1rho, T2 mapping, and EPIC-microCT Imaging in a Canine Model of Knee Osteochondral Injury. J Orthop Res. 2020;38(2):368–77. [DOI] [PubMed] [Google Scholar]
- 27.van Tiel J, Kotek G, Reijman M, Bos PK, Bron EE, Klein S, et al. Is T1rho Mapping an Alternative to Delayed Gadolinium-enhanced MR Imaging of Cartilage in the Assessment of Sulphated Glycosaminoglycan Content in Human Osteoarthritic Knees? An in Vivo Validation Study. Radiology. 2016;279(2):523–31. [DOI] [PubMed] [Google Scholar]
- 28.Baum T, Joseph GB, Arulanandan A, Nardo L, Virayavanich W, Carballido-Gamio J, et al. Association of magnetic resonance imaging-based knee cartilage T2 measurements and focal knee lesions with knee pain: data from the Osteoarthritis Initiative. Arthritis Care Res (Hoboken). 2012;64(2):248–55. [DOI] [PMC free article] [PubMed] [Google Scholar]
- 29.Dunn TC, Lu Y, Jin H, Ries MD, Majumdar S. T2 relaxation time of cartilage at MR imaging: comparison with severity of knee osteoarthritis. Radiology. 2004;232(2):592–8. [DOI] [PMC free article] [PubMed] [Google Scholar]
- 30.Joseph GB, Baum T, Alizai H, Carballido-Gamio J, Nardo L, Virayavanich W, et al. Baseline mean and heterogeneity of MR cartilage T2 are associated with morphologic degeneration of cartilage, meniscus, and bone marrow over 3 years--data from the Osteoarthritis Initiative. Osteoarthritis Cartilage. 2012;20(7):727–35. [DOI] [PMC free article] [PubMed] [Google Scholar]
- 31.Mosher TJ, Dardzinski BJ. Cartilage MRI T2 relaxation time mapping: overview and applications. Semin Musculoskelet Radiol. 2004;8(4):355–68. [DOI] [PubMed] [Google Scholar]
- 32.Gallo MC, Wyatt C, Pedoia V, Kumar D, Lee S, Nardo L, et al. T1rho and T2 relaxation times are associated with progression of hip osteoarthritis. Osteoarthritis Cartilage. 2016;24(8):1399–407. [DOI] [PMC free article] [PubMed] [Google Scholar]
- 33.Liebl H, Joseph G, Nevitt MC, Singh N, Heilmeier U, Subburaj K, et al. Early T2 changes predict onset of radiographic knee osteoarthritis: data from the osteoarthritis initiative. Ann Rheum Dis. 2015;74(7):1353–9. [DOI] [PMC free article] [PubMed] [Google Scholar]
- 34.Joseph G, Baum T, Alizai H, Nardo L, Virayavanich W, Lynch J, et al. , editors. Joseph GB, Baum T, Alizai H, Nardo L, Virayavanich W, Lynch JA, Nevitt MC, McCulloch CE, Link TM. Elevated Cartilage T2 and Increased Severity of Cartilage Defects at Baseline are Associated with the Development of Knee Pain over 5 Years. 16th World Congress on Osteoarthritis; 2013; Philadelphia, Pennsylvania. [Google Scholar]
- 35.Baum T, Joseph GB, Nardo L, Virayavanich W, Arulanandan A, Alizai H, et al. MRI-based knee cartilage T2 measurements and focal knee lesions correlate with BMI - 36 month follow-up data from the Osteoarthritis initiative. Arthritis Care Res (Hoboken). 2012. [DOI] [PMC free article] [PubMed] [Google Scholar]
- 36.Baum T, Stehling C, Joseph GB, Carballido-Gamio J, Schwaiger BJ, Muller-Hocker C, et al. Changes in knee cartilage T2 values over 24 months in subjects with and without risk factors for knee osteoarthritis and their association with focal knee lesions at baseline: data from the osteoarthritis initiative. J Magn Reson Imaging. 2012;35(2):370–8. [DOI] [PMC free article] [PubMed] [Google Scholar]
- 37.Lin W, Alizai H, Joseph GB, Srikhum W, Nevitt MC, Lynch JA, et al. Physical activity in relation to knee cartilage T2 progression measured with 3 T MRI over a period of 4 years: data from the Osteoarthritis Initiative. Osteoarthritis Cartilage. 2013;21(10):1558–66. [DOI] [PMC free article] [PubMed] [Google Scholar]
- 38.Serebrakian AT, Poulos T, Liebl H, Joseph GB, Lai A, Nevitt MC, et al. Weight loss over 48 months is associated with reduced progression of cartilage T2 relaxation time values: data from the osteoarthritis initiative. J Magn Reson Imaging. 2015;41(5):1272–80. [DOI] [PMC free article] [PubMed] [Google Scholar]
- 39.Stehling C, Luke A, Stahl R, Baum T, Joseph G, Pan J, et al. Meniscal T1rho and T2 measured with 3.0T MRI increases directly after running a marathon. Skeletal Radiol. 2011;40(6):725–35. [DOI] [PMC free article] [PubMed] [Google Scholar]
- 40.Gersing AS, Solka M, Joseph GB, Schwaiger BJ, Heilmeier U, Feuerriegel G, et al. Progression of cartilage degeneration and clinical symptoms in obese and overweight individuals is dependent on the amount of weight loss: 48-month data from the Osteoarthritis Initiative. Osteoarthritis Cartilage. 2016;24(7):1126–34. [DOI] [PMC free article] [PubMed] [Google Scholar]
- 41.Shah RP, Stambough JB, Fenty M, Mauck RL, Kelly JD, Reddy R, et al. T1rho Magnetic Resonance Imaging at 3T Detects Knee Cartilage Changes After Viscosupplementation. Orthopedics. 2015;38(7):e604–10. [DOI] [PubMed] [Google Scholar]
- 42.Jungmann PM, Kraus MS, Nardo L, Liebl H, Alizai H, Joseph GB, et al. T(2) relaxation time measurements are limited in monitoring progression, once advanced cartilage defects at the knee occur: longitudinal data from the osteoarthritis initiative. J Magn Reson Imaging. 2013;38(6):1415–24. [DOI] [PMC free article] [PubMed] [Google Scholar]
- 43.Su F, Pedoia V, Teng HL, Kretzschmar M, Lau BC, McCulloch CE, et al. The association between MR T1rho and T2 of cartilage and patient-reported outcomes after ACL injury and reconstruction. Osteoarthritis Cartilage. 2016;24(7):1180–9. [DOI] [PMC free article] [PubMed] [Google Scholar]
- 44.van der Heijden RA, Oei EH, Bron EE, van Tiel J, van Veldhoven PL, Klein S, et al. No Difference on Quantitative Magnetic Resonance Imaging in Patellofemoral Cartilage Composition Between Patients With Patellofemoral Pain and Healthy Controls. Am J Sports Med. 2016;44(5):1172–8. [DOI] [PubMed] [Google Scholar]
- 45.Dautry R, Bousson V, Manelfe J, Perozziello A, Boyer P, Loriaut P, et al. Correlation of MRI T2 mapping sequence with knee pain location in young patients with normal standard MRI. JBR-BTR. 2014;97(1):11–6. [DOI] [PubMed] [Google Scholar]
- 46.Blumenkrantz G, Carballido-Gamio J, McCulloch C, Lynch J, Link T, Majumdar S, editors. The Relationship Between the Spatial Distribution of Cartilage MR T2 and Longitudinal Changes in Pain: Data from the Osteoarthritis Initiative ISMRM; 2009; Honolulu, Hawaii. [Google Scholar]
- 47.Kretzschmar M, Nevitt MC, Schwaiger BJ, Joseph GB, McCulloch CE, Link TM. Spatial distribution and temporal progression of T2 relaxation time values in knee cartilage prior to the onset of cartilage lesions - data from the Osteoarthritis Initiative (OAI). Osteoarthritis Cartilage. 2019;27(5):737–45. [DOI] [PMC free article] [PubMed] [Google Scholar]
- 48.Apprich SR, Schreiner MM, Szomolanyi P, Welsch GH, Koller UK, Weber M, et al. Potential predictive value of axial T2 mapping at 3 Tesla MRI in patients with untreated patellar cartilage defects over a mean follow-up of four years. Osteoarthritis Cartilage. 2020;28(2):215–22. [DOI] [PubMed] [Google Scholar]
- 49.Wirth W, Maschek S, Roemer FW, Sharma L, Duda GN, Eckstein F. Radiographically normal knees with contralateral joint space narrowing display greater change in cartilage transverse relaxation time than those with normal contralateral knees: a model of early OA? - data from the Osteoarthritis Initiative (OAI). Osteoarthritis Cartilage. 2019;27(11):1663–8. [DOI] [PMC free article] [PubMed] [Google Scholar]
- 50.Desai AD, Caliva F, Iriondo C, Mortazi A, Jambawalikar S, Bagci U, et al. The International Workshop on Osteoarthritis Imaging Knee MRI Segmentation Challenge: A Multi-Institute Evaluation and Analysis Framework on a Standardized Dataset. Radiol Artif Intell. 2021;3(3):e200078. [DOI] [PMC free article] [PubMed] [Google Scholar]
- 51.Ebrahimkhani S, Jaward MH, Cicuttini FM, Dharmaratne A, Wang Y, de Herrera AGS. A review on segmentation of knee articular cartilage: from conventional methods towards deep learning. Artif Intell Med. 2020;106:101851. [DOI] [PubMed] [Google Scholar]
- 52.Gaj S, Yang M, Nakamura K, Li X. Automated cartilage and meniscus segmentation of knee MRI with conditional generative adversarial networks. Magn Reson Med. 2020;84(1):437–49. [DOI] [PubMed] [Google Scholar]
- 53.Gatti AA, Maly MR. Automatic knee cartilage and bone segmentation using multi-stage convolutional neural networks: data from the osteoarthritis initiative. MAGMA. 2021;34(6):859–75. [DOI] [PubMed] [Google Scholar]
- 54.Liu F, Zhou Z, Jang H, Samsonov A, Zhao G, Kijowski R. Deep convolutional neural network and 3D deformable approach for tissue segmentation in musculoskeletal magnetic resonance imaging. Magn Reson Med. 2018;79(4):2379–91. [DOI] [PMC free article] [PubMed] [Google Scholar]
- 55.Norman B, Pedoia V, Majumdar S. Use of 2D U-Net Convolutional Neural Networks for Automated Cartilage and Meniscus Segmentation of Knee MR Imaging Data to Determine Relaxometry and Morphometry. Radiology. 2018;288(1):177–85. [DOI] [PMC free article] [PubMed] [Google Scholar]
- 56.Chaudhari AS, Kogan F, Pedoia V, Majumdar S, Gold GE, Hargreaves BA. Rapid Knee MRI Acquisition and Analysis Techniques for Imaging Osteoarthritis. J Magn Reson Imaging. 2020;52(5):1321–39. [DOI] [PMC free article] [PubMed] [Google Scholar]
- 57.Zhou Y, Pandit P, Pedoia V, Rivoire J, Wang Y, Liang D, et al. Accelerating T1rho cartilage imaging using compressed sensing with iterative locally adapted support detection and JSENSE. Magn Reson Med. 2016;75(4):1617–29. [DOI] [PMC free article] [PubMed] [Google Scholar]
- 58.Zibetti MVW, Sharafi A, Otazo R, Regatte RR. Accelerating 3D-T1rho mapping of cartilage using compressed sensing with different sparse and low rank models. Magn Reson Med. 2018;80(4):1475–91. [DOI] [PMC free article] [PubMed] [Google Scholar]
- 59.Kim J, Zhang CA, Yang M, Li H, Li M, Lartey R, editors. Highly accelerated T1ρ imaging using kernel-based low-rank compressed sensing reconstruction in knees with and without osteoarthritis. Annual Conference of International Society of Magnetic Resonance in Medicine (ISMRM); 2021; virtual. [Google Scholar]
- 60.Sharafi A, Zibetti MVW, Chang G, Cloos M, Regatte RR. 3D MR-Fingerprinting for Rapid Simultaneous T1, T2, and T1rho Volumetric Mapping of the Human Articular Cartilage at 3T. NMR Biomed. 2022:e4800. [DOI] [PMC free article] [PubMed] [Google Scholar]
- 61.Li H, Yang M, Kim JH, Zhang C, Liu R, Huang P, et al. SuperMAP: Deep ultrafast MR relaxometry with joint spatiotemporal undersampling. Magn Reson Med. 2022. Epub ahead of print (2022/09/22). [DOI] [PMC free article] [PubMed] [Google Scholar]
- 62.Chalian M, Li X, Guermazi A, Obuchowski NA, Carrino JA, Oei EH, et al. The QIBA Profile for MRI-based Compositional Imaging of Knee Cartilage. Radiology. 2021;301(2):423–32. [DOI] [PMC free article] [PubMed] [Google Scholar]
- 63.Li X, Pedoia V, Kumar D, Rivoire J, Wyatt C, Lansdown D, et al. Cartilage T1rho and T2 relaxation times: longitudinal reproducibility and variations using different coils, MR systems and sites. Osteoarthritis Cartilage. 2015;23(12):2214–23. [DOI] [PMC free article] [PubMed] [Google Scholar]
- 64.Joseph GB, McCulloch CE, Nevitt MC, Heilmeier U, Nardo L, Lynch JA, et al. A reference database of cartilage 3 T MRI T2 values in knees without diagnostic evidence of cartilage degeneration: data from the osteoarthritis initiative. Osteoarthritis Cartilage. 2015;23(6):897–905. [DOI] [PMC free article] [PubMed] [Google Scholar]
- 65.Joseph GB, McCulloch CE, Nevitt MC, Gersing AS, Schwaiger BJ, Kretzschmar M, et al. Medial femur T2 Z-scores predict the probability of knee structural worsening over 4–8 years: Data from the osteoarthritis initiative. J Magn Reson Imaging. 2017;46(4):1128–36. [DOI] [PMC free article] [PubMed] [Google Scholar]
- 66.Liu F, Feng L, Kijowski R. MANTIS: Model-Augmented Neural neTwork with Incoherent k-space Sampling for efficient MR parameter mapping. Magn Reson Med. 2019;82(1):174–88. [DOI] [PMC free article] [PubMed] [Google Scholar]


