Abstract
Introductin
Improper gait patterns, impaired balance and foot drop consistently plague stroke survivors, preventing them from walking independently and safely. Neuromuscular electrical stimulation (NMES) technology can help patients reactivate their muscles and regain motor coordination. This study aims to systematically review and summarize the evidence for the potential benefits of NMES on the improvement of gait patterns after stroke.
Evidence acquisition
PubMed, Cochrane Library, Embase, Science Direct and Web of Science were systematically searched until April 2024, to identify randomized controlled trials with the following criteria: stroke survivors as participants; NMES as intervention; conventional rehabilitation as a comparator; and gait assessment, through scales or quantitative parameters, as outcome measures.
Evidence synthesis
29 publications involving 1711 patients met the inclusion criteria. Meta-analysis showed no significant differences in Ten-meter walk test, Fugl-Meyer assessment lower extremity, Modified Ashworth Assessment and asymmetry between the NMES group and the control group. Besides, NMES was associated with changes in outcome indicators such as quantitative gait analysis speed [SMD = 0.53, 95% CI (0.20, 0.85), P = 0.001], cadence [SMD = 0.76, 95% CI (0.32, 1.20), P = 0.0008], affected side step length [SMD = 0.73, 95% CI (0.16, 1.31), P = 0.01], angle of ankle dorsiflexion [WMD = 1.57, 95% CI (0.80, 2.33), P < 0.0001], Six-Minute Walk Test [WMD = 14.83, 95% CI (13.55, 16.11), P<0.00001]. According to the PEDro scale, 21 (72.4%) studies were of high quality and 8 were of moderate quality (27.6%).
Conclusions
Taken together, the review synthesis indicated that NMES might play a potential role in stroke-induced walking dysfunction. And NMES may be superior for survivors in the chronic phase than the acute and subacute phases, and the efficacy of short sessions received by patients was greater than that of those who participated in a longer session. Additionally, further comparisons of the effects of NMES with different types or stimulation frequencies may provide unexpected benefits.
Supplementary Information
The online version contains supplementary material available at 10.1186/s12984-024-01462-2.
Keywords: Stroke, Neuromuscular electrical stimulation, Functional electrical stimulation, Walking, Kinematic parameters, Meta-analysis
Introduction
Globally, 12.2 million new strokes occur each year, one every three seconds [1]. Stroke survivors generally have limited activity due to impairments in body structure and function, with about 60% of these survivors suffer from walking dysfunction [2]. Motor function of the lower extremities can significantly improve within the first 30 days after stroke [3]. However, the ultimate degree of recovery in stroke patients remain uncertain, as it depends on factors such as patient-specific spontaneous neurologic recovery, rehabilitation training, and environmental enrichment. Moreover, stroke survivors have been continually plagued by problems like improper gait patterns, muscle spasms, impaired balance and foot drop [4], which impede their ability to walk independently and safely. Independent and safe ambulation is the most commonly cited goal and a key component of functional recovery for stroke survivors [5–7].
Neuromuscular electrical stimulation (NMES) technology utilizes electrical stimulation to alleviate the inability of muscles to produce joint movements in stroke patients due to weak or absent innervation. It enables survivors with lower extremity motor dysfunction to reactivate their muscles and regain motor coordination [8, 9]. And there is a traceable history of generating physical movement through electrical stimulation and using it in the therapeutic field. As early as the 1960s, clinical trials were conducted to correct foot drop in stroke survivors by electrically stimulating the peroneal nerve in the affected leg [10].
Generally, NMES is divided into two categories: functional electrical stimulation (FES) and transcutaneous electrical nerve stimulation (TENS). FES, which typically uses electrical stimulation at 20–50 Hz, is designed to activate motor nerve fibers causing the target muscle to contract and generate functional movements [9, 11]. TENS, which usually utilizes electrical stimulation at 2–10 Hz, can activate sensory nerve fibers and override pain impulses without produce significant muscle contraction [12]. Currently, numerous studies have pointed out the effectiveness of NMES in improving balance, ankle stability, gait symmetry and muscle spasticity in stroke patients [13–15]. However, it has also been noted that NMES, despite contributing to functional improvement in stroke survivors, did not differ significantly from conventional treatment in terms of improvements in speed, step length symmetry, other spatiotemporal gait parameters, or walking capacity [16–18]. A 2018 meta-analysis indicates that further analysis of high-quality randomized controlled trials on NMES is warranted [19]. Notably, scientific evidences regarding the role of NMES in stroke-induced lower limb motor dysfunction may have been unwittingly updated as the research progressed, making an updated review indispensable. Furthermore, few studies have focused on the role of NMES in temporal and spatial parameters and on comparing the efficacy of functional rehabilitation in patients with different post-stroke time and different treatment sessions.
Based on these considerations, the objective of this study was to undertake a systematic review and meta-analysis of all the existing literature and to explore the following queries:
What is the contribution of NMES to temporal and spatial parameters in individuals with stroke-induced lower limb motor dysfunction?
Does NMES play a different role for stroke survivors in the acute, subacute, or chronic phase?
Can an optimal treatment cycle be indicated based on the existing studies?
Materials and methods
Protocol
For this systematic review and meta-analysis, the Preferred Reporting Items for Systematic Reviews and Meta-Analysis (PRISMA) guidelines were followed [20, 21]. And it has been registered with the International Prospective Register of Systematic Reviews (PROSPERO) (registration number: CRD42024542857).
Retrieval strategy
Studies from inception to April 2024 were retrieved from five databases (PubMed, Cochrane Library, Embase, Science Direct and Web of Science) based on the principle of PICOS (population, intervention, comparison, outcome, study). Medical Subject Headings (MeSH) and keywords were used to search, including stroke [MeSH], apoplexy [MeSH], Electric Stimulation [MeSH], functional electrical stimulation [Title/Abstract], Transcutaneous Electric Nerve Stimulation [MeSH], Lower Extremity [MeSH], and walking [MeSH]. And the detailed retrieval strategies are available in the Appendix 1.
Study selection
Based on the PICOS principles, the following inclusion and exclusion criteria were set. The inclusion criteria were as follows: (1) population: adult stroke patients diagnosed with lower limb motor dysfunction; (2) intervention: experimental group received NMES (including FES and TENS); (3) comparison: control group received conventional training (including ankle-foot orthosis and treadmill walking training); (4) outcome: the primary outcomes were quantitative gait analysis (QGA) speed and ten-meter walk test (10MWT), and the secondary outcomes were parameters (temporal, spatial and temporal-spatial) and clinical scales associated with walking function in stroke; (5) study: randomized controlled study.
Studies were excluded if they met any of the following criteria: (1) study protocols; (2) conference summaries; (3) studies that could not isolate the efficacy of NMES; (4) non-English literature.
Data extraction
Two researchers (S.S. and J.J.) independently conducted literature screening, data extraction and cross-verification. Any disagreements were resolved through discussion or by referring to a third researcher (Z.Y.) until a consensus was reached. Endnote X9 was used for literature management, including reading titles and abstracts, eliminating obviously irrelevant literature, and recording reasons and quantities for exclusions. Additionally, a predefined form created in Excel 2021 was used for data extraction. If the literature contained multiple subgroups, the data matching the subgroups of this study were extracted.
To summarize the effects of NMES on walking function in stroke survivors, the following data were extracted from the included studies: (1) basic information: first author, year of publication, country; (2) basic characteristics of the subjects: sample size, age, gender, stroke onset time, stroke location, and types of stroke; (3) intervention protocols and treatment courses: device, treatment sessions, electrical stimulation frequency, waveform, pulse width, and stimulation position; (4) key elements of bias risk assessment; (5) outcome indicators: QGA speed, 10MWT(when speed could not be obtained by QGA), cadence, angle of joint motion, six-minute walk test (6MWT), berg balance scale (BBS), etc.
Quality and certainty assessment
The methodological quality of the literature was assessed using the physiotherapy evidence database scale (PEDro) [22] and the Cochrane risk bias assessment tool [23]. And the certainty of evidence was assessed using the Grading of Recommendations Assessment, Development and Evaluation (GRADE) [24]. Two researchers (S.S. and Y.X.) independently conducted the quality and certainty assessment. If there were discrepancies in the results, they discussed and negotiated with the third researcher (B.S.) until a consensus was reached. The PEDro scale has 11 assessment items, including randomization, blinding of participants and assessors, dropout rates. Scores of 7–10, 5–6 and ≤ 4 indicate that the quality of the literature is high, medium and low, respectively [25]. The GRAED criteria has 8 assessment items, including inconsistency, indirectness, magnitude of the effect and dose-response gradient. And the certainty of evidence is categorized into four levels (high, moderate, low, and very low).
Statistical analysis
Two statistical software programs, Stata15 and RevMan 5.4, were used for the meta-analysis.
Effect size
Outcome indicators were all continuous variables. When units of the measurement were consistent, the weighted mean difference (WMD) was used to calculate effect sizes; When units of measurement were inconsistent, the standardized mean difference (SMD) was used to eliminate the effect of the dimension. A 95%CI is given for each effect size. The median and quartile values of the included studies were converted to mean or standard deviation according to the formula and then combined for analysis [26, 27].
Heterogeneity
The I2 statistic was used for evaluation. Fixed-effects and random-effects models were used for Meta-analysis in the case of I2 < 50% or I2 ≥ 50%, respectively. And if I2 ≥ 50%, it indicates statistical heterogeneity among the results of the included studies and the source of heterogeneity needs to be analyzed. To identify the sources of heterogeneity, subgroup analyses were conducted based on post-stroke time [acute and subacute phases (≤ 6 months), chronic phase (> 6 months)] [28], number of stimulation sites (single stimulation site and multiple stimulation sites) or treatment sessions (≤ 4 weeks, > 4 weeks).
Sensitivity analysis
Stata/SE was used to conduct a meta-analysis after successively removing individual studies to evaluate the differences between the eliminated results and the original combined results. If the new pooled results are consistent with the original combined results, this indicates a stable result from the original study.
Publication bias
Publication bias was evaluated by drawing funnel plots for visual judgment and using Egger’s test for linear regression.
Results
Study selection
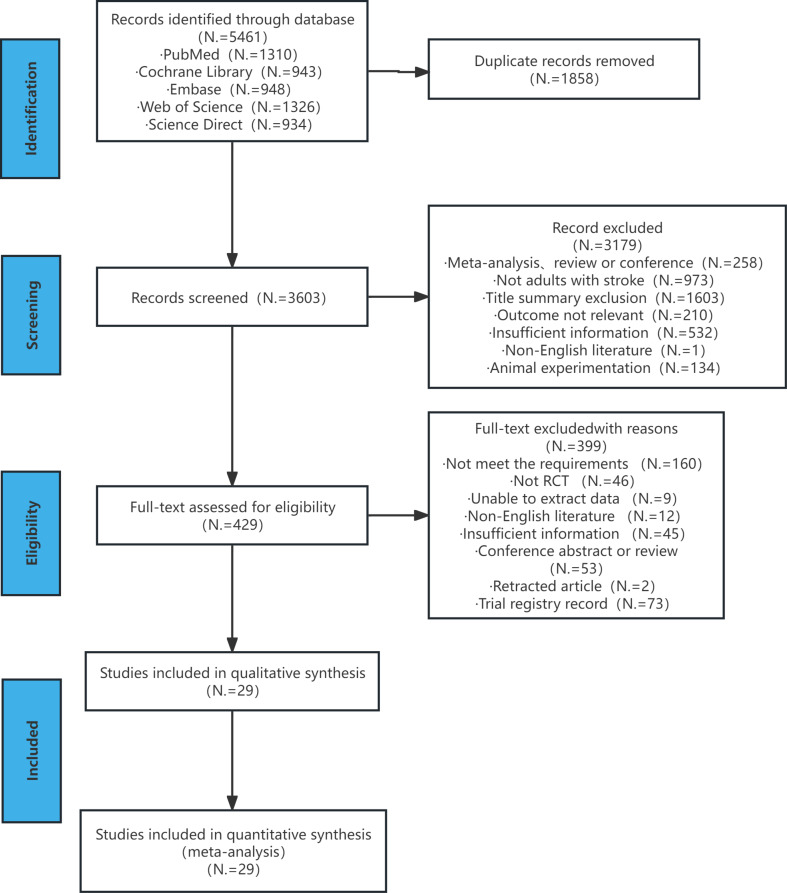
Using the search strategies described above, a total of 5965 studies were retrieved from five databases (1310 from PubMed, 943 from Cochrane Library, 948 from Embase, 1326 from Web of Science and 934 from Science Direct). After eliminating duplicates and screening the remaining literature, 29 eligible studies were included [14, 16–18, 29–53]. A total of 1711 patients were included in the study cohort (848 in the experimental group and 863 in the control group) and their basic information is shown in Appendix 1. Fig. 1 illustrates the literature screening process and results. Except three studies [39, 46, 52] in which NMES was combined with treadmill walking training, the experimental groups in the included studies were either NMES combined with conventional walking training or NMES alone. In addition, four studies [34, 35, 45, 47] pinpointed the use of ankle-foot orthosis in control groups. Moreover, in 89.66% of the included studies, treatment cycles were greater than or equal to four weeks, with a single treatment duration ranging from ten minutes to one and a half hours.
Fig. 1.
Literature screening process and results
Risk of bias
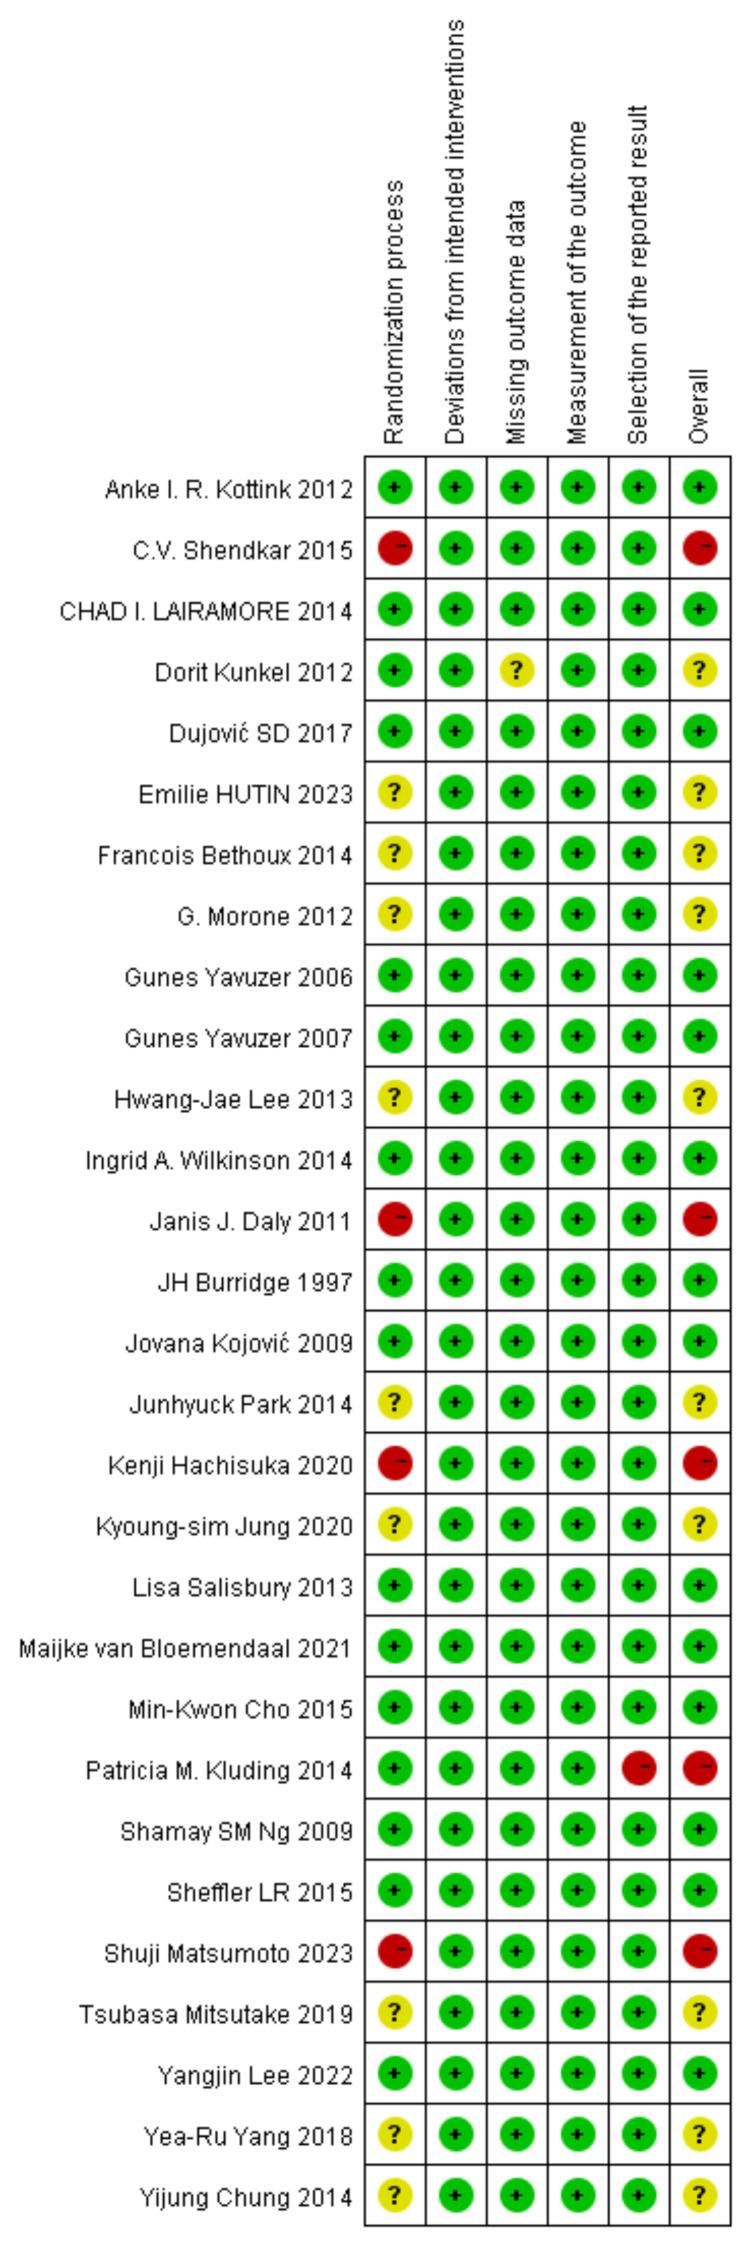
Figure 2; Table 1 display the risk of bias in the included studies (8 medium-quality and 21 high-quality studies). Among them, 7 studies [16, 29, 34, 42, 46, 49, 53] did not explicitly stated whether a blind method was used, 3 studies [18, 35, 45] did not use blind method, 15 studies [14, 17, 30, 32, 33, 36, 37, 40, 41, 43, 47, 48, 50–52] used a single blind method, 3 studies [31, 38, 44] used double blind method and 1 study [39] used triple blind method. Regarding random sequence generation, only 6 studies [29, 34, 36, 44, 51, 53] had unclear methods for random sequence generation, while the rest had clear descriptions. Meanwhile, 9 studies [14, 34–36, 39, 43, 44, 51, 53] did not mention allocation concealment, while the rest provided detailed descriptions (including three high-risk studies [18, 30, 50]).Besides, data were completely reported in all studies, except for 1 study [32], which was defined as high-risk due to a serious loss of follow-up in partial outcome indicator. And 1 study [47] was defined as high risk in selection of the reported result due to funding by a corporation. Moreover, 13 studies [14, 16, 30–34, 38, 41, 46, 51–53] used electrical stimulation frequencies at 15–50 Hz, 4 studies [37, 43, 44, 48] at 80–100 Hz and the remaining studies did not describe this characteristic.
Fig. 2.
Cochrane bias risk score
Table 1.
Summary of PEDro score
| Inclusion study | 1 | 2 | 3 | 4 | 5 | 6 | 7 | 8 | 9 | 10 | 11 | Total |
|---|---|---|---|---|---|---|---|---|---|---|---|---|
| Anke I. R. Kottink 2012[29] | √ | — | √ | √ | — | — | — | √ | √ | √ | √ | 6 |
| C.V. Shendkar 2015 | √ | — | — | √ | — | — | √ | √ | √ | √ | √ | 6 |
| CHAD I. LAIRAMORE 2014[31] | √ | √ | √ | √ | √ | √ | — | √ | √ | √ | √ | 9 |
| Dorit Kunkel 2012[32] | √ | √ | √ | √ | — | — | √ | — | √ | √ | √ | 7 |
| Dujović SD 2017[33] | √ | √ | √ | √ | — | — | √ | √ | √ | √ | √ | 8 |
| Emilie HUTIN 2023[34] | √ | — | — | √ | — | — | — | √ | √ | √ | √ | 5 |
| Francois Bethoux 2014[35] | √ | √ | — | √ | — | — | — | √ | √ | √ | √ | 6 |
| G. Morone 2012[36] | √ | — | — | √ | — | — | √ | √ | √ | √ | √ | 6 |
| Gunes Yavuzer 2006[37] | √ | √ | √ | √ | — | — | √ | √ | √ | √ | √ | 8 |
| Gunes Yavuzer 2007 [37] | √ | √ | √ | √ | √ | — | √ | √ | √ | √ | √ | 9 |
| Hwang-Jae Lee 2013 | √ | √ | — | √ | √ | √ | √ | √ | √ | √ | √ | 9 |
| Ingrid A. Wilkinson 2014 | √ | √ | √ | √ | — | — | √ | √ | √ | √ | √ | 8 |
| Janis J. Daly 2011 | √ | √ | √ | √ | — | — | √ | √ | √ | √ | √ | 8 |
| JH Burridge 1997 | √ | √ | √ | √ | — | — | — | √ | √ | √ | √ | 7 |
| Jovana Kojović 2009 | √ | √ | √ | √ | — | — | — | √ | √ | √ | √ | 7 |
| Junhyuck Park 2014 | √ | √ | — | √ | — | — | √ | √ | √ | √ | √ | 7 |
| Kenji Hachisuka 2020 | √ | √ | — | √ | — | — | — | √ | √ | √ | √ | 6 |
| Kyoung-sim Jung 2020 | √ | — | — | √ | √ | √ | √ | √ | √ | √ | √ | 8 |
| Lisa Salisbury 2013 | √ | √ | √ | √ | — | — | — | √ | √ | √ | √ | 7 |
| Maijke van Bloemendaal 2021 | √ | √ | √ | √ | — | — | — | √ | √ | √ | √ | 7 |
| Min-Kwon Cho 2015 | √ | √ | √ | √ | — | — | — | √ | √ | √ | √ | 7 |
| Patricia M. Kluding 2014 | √ | √ | √ | √ | — | — | √ | √ | √ | √ | √ | 8 |
| Shamay SM Ng 2009 | √ | √ | √ | √ | — | — | √ | √ | √ | √ | √ | 8 |
| Sheffler LR 2015 | √ | √ | √ | √ | — | — | — | √ | √ | √ | √ | 7 |
| Shuji Matsumoto 2023 | √ | √ | — | √ | — | — | √ | √ | √ | √ | √ | 7 |
| Tsubasa Mitsutake 2019 | √ | — | — | √ | — | — | — | √ | √ | √ | √ | 5 |
| Yangjin Lee 2022 | √ | √ | √ | √ | — | — | √ | √ | √ | √ | √ | 7 |
| Yea-Ru Yang 2018 | √ | √ | — | √ | — | — | √ | √ | √ | √ | √ | 7 |
| Yijung Chung 2014 | √ | — | — | √ | — | — | — | √ | √ | √ | √ | 5 |
#1:eligibility criteria; 2:randomly allocated; 3:assigning concealment; 4:similar at baseline; 5:blinding of all subjects;
6:blinding of all therapists; 7:blinding of all assessors; 8:measures of at least one key outcome; 9:intention to treat;
10:Comparison between groups; 11:point measures and measures of variability
The summary of findings in Appendix 1 display the certainty of the evidence (1 high, 4 moderate, 5 low, 3 very low). It was attributed to a moderate degree of heterogeneity, small sample sizes, small confidence interval overlap and high-risk of bias.
Results of individual studies
Walking speed
It can be categorized into QGA speed and 10MWT.
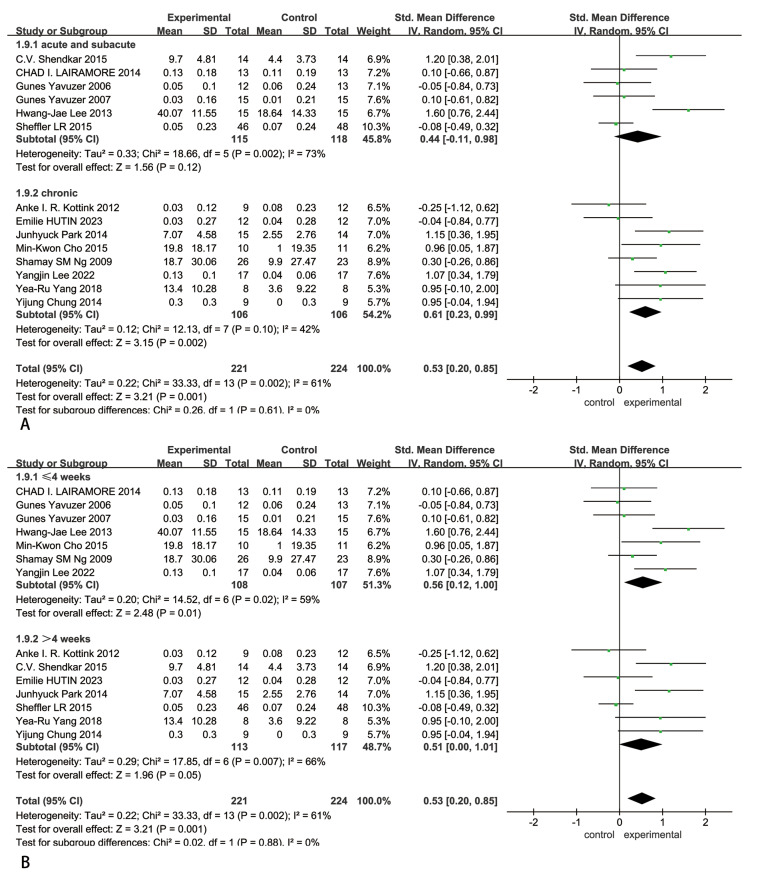
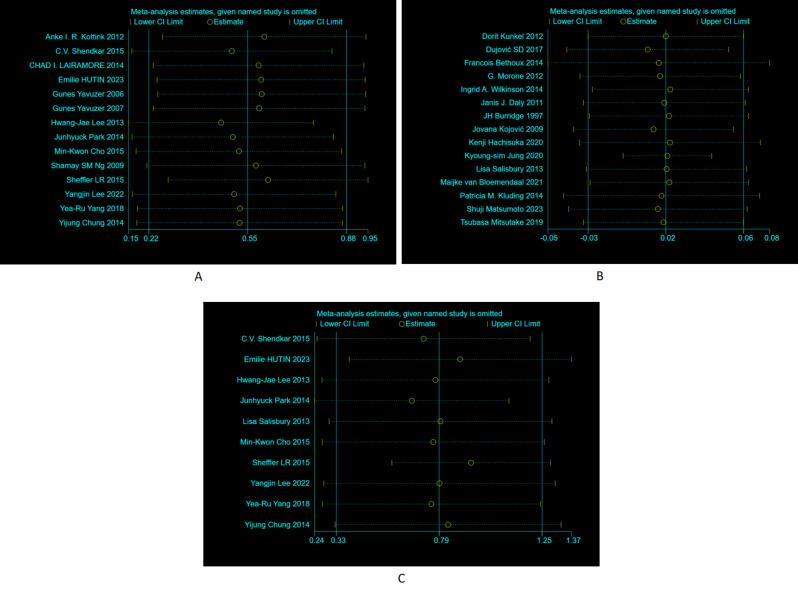
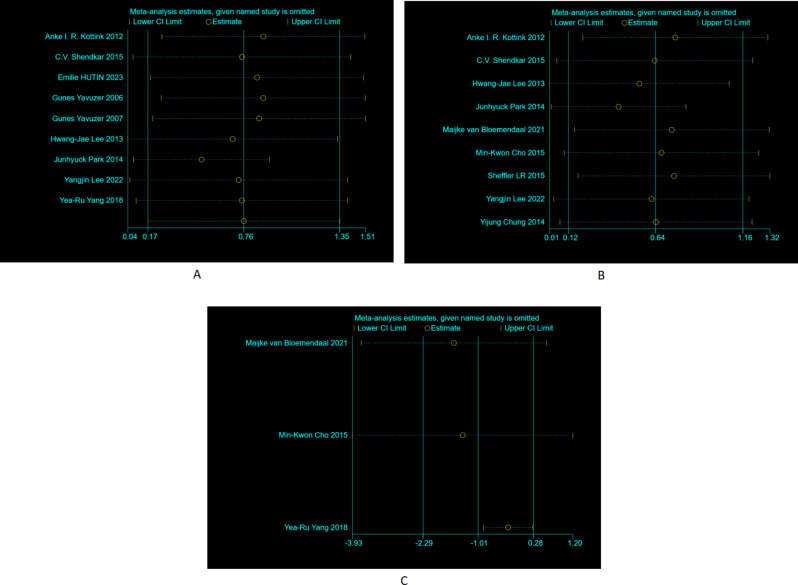
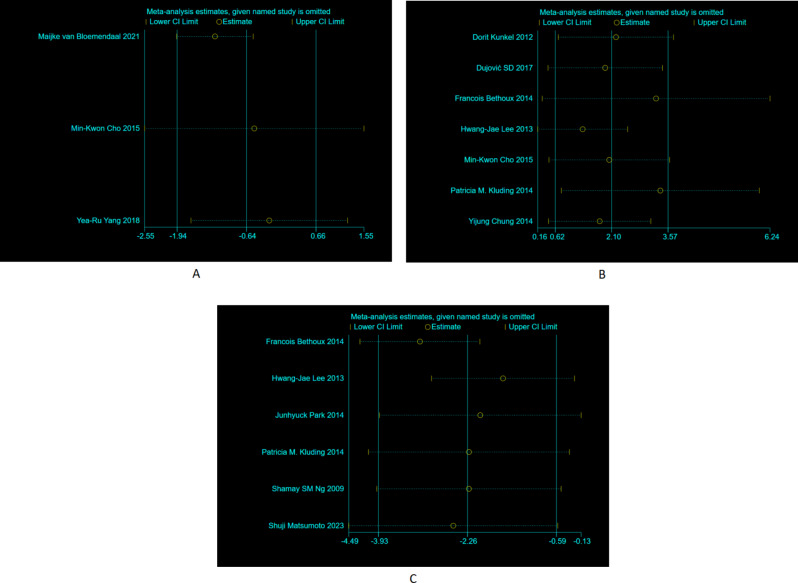
Regarding QGA speed, fourteen studies were included, involving 445 patients with stroke-induced lower limb motor dysfunction. Due to the heterogeneity test results (P = 0.002, I2 = 61%), a random-effect model analysis was used. The results in Fig. 3 indicated that there was a statistical difference between the experimental group and the control group [SMD = 0.53, 95% CI (0.20, 0.85), P = 0.001]. Sensitivity analysis found that the results showed satisfactory robustness (Fig. 4-A).
Fig. 3.
Forest plots for the analysis of QGA speed and its subgroups. (A) subgroup analysis on post-stroke time, (B) subgroup analysis on treatment sessions
Fig. 4.
Sensitivity analysis plots of QGA speed (subfigure A), 10MWT (subfigure B) and cadence (subfigure C)
Subgroup analysis of post-stroke time indicated that the chronic phase [SMD = 0.61, 95% CI (0.23, 0.99), P = 0.002] showed a higher effect size than the acute and subacute phases [SMD = 0.44, 95% CI (-0.11, 0.98), P = 0.12], as shown in Fig. 3-A. Subgroup analysis of treatment sessions indicated that ≤ 4 weeks [SMD = 0.56, 95% CI (0.12, 1.00), P = 0.01] showed a higher effect size than > 4 weeks [SMD = 0.51, 95% CI (0.00, 1.01), P = 0.05], as shown in Fig. 3-B.
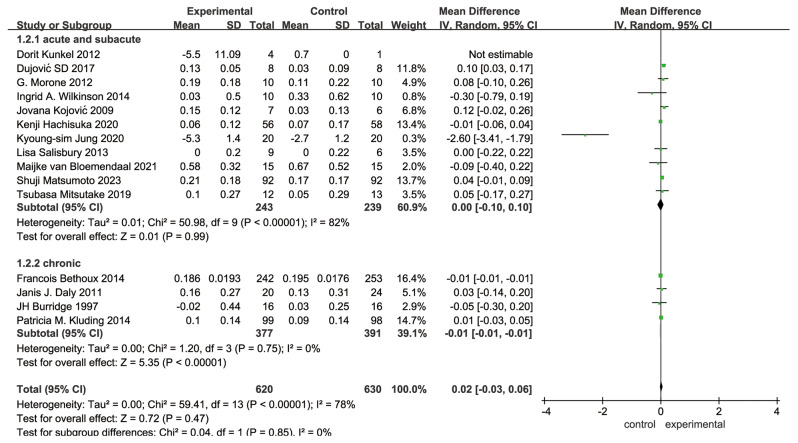
Regarding 10MWT, fifteen studies were included, involving 1250 patients with stroke-induced lower limb motor dysfunction. Due to the heterogeneity test results (P<0.00001, I2 = 78%), a random-effect model analysis was used. The results in Fig. 5 indicated that there was no statistical difference between the experimental group and the control group [WMD = 0.02, 95% CI (-0.03, 0.06), P = 0.47]. Sensitivity analysis found that the results showed satisfactory robustness (Fig. 4-B).
Fig. 5.
Forest plots for the analysis of 10MWT and its subgroups
Subgroup analysis of post-stroke time indicated that the chronic phase [WMD=-0.01, 95% CI (-0.01, -0.01), P<0.00001] showed a higher effect size than the acute and subacute phases [WMD = 0.00, 95% CI (-0.01, 0.01), P = 0.99], as shown in Fig. 5.
Cadence
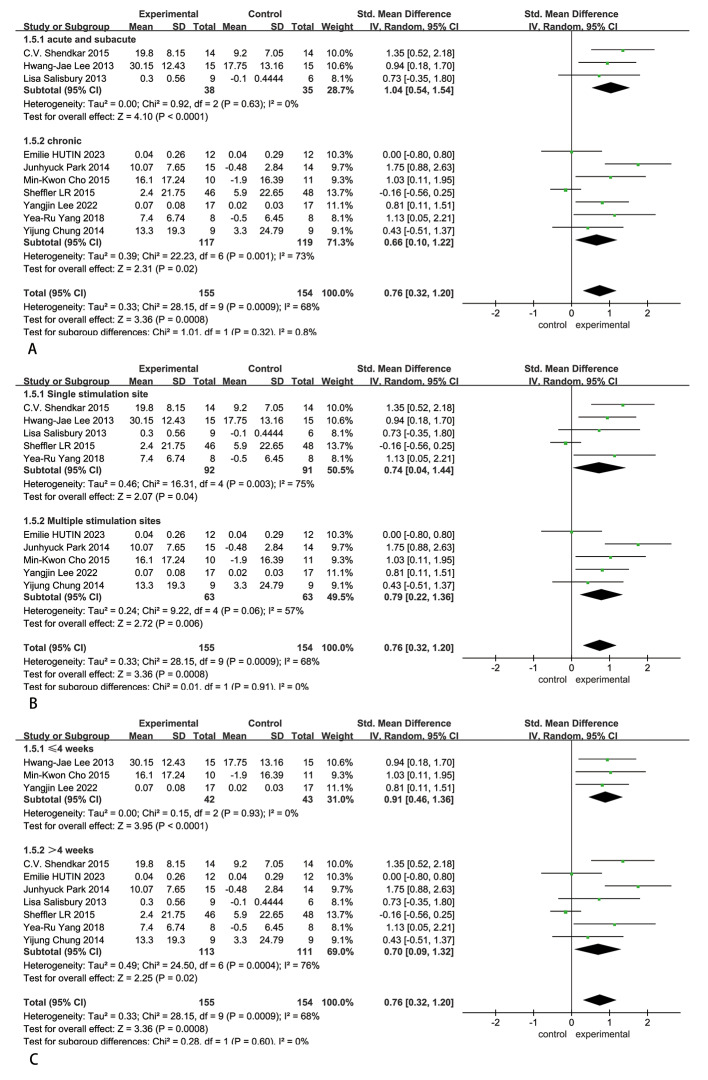
Ten studies were included, involving 309 patients with stroke-induced lower limb motor dysfunction. Due to the heterogeneity test results (P = 0.0009, I2 = 68%), a random-effect model analysis was used. The results in Fig. 6 indicated that there was a statistical difference between the experimental group and the control group [SMD = 0.76, 95% CI (0.32, 1.20), P = 0.0008]. Sensitivity analysis found that the results showed satisfactory robustness (Fig. 4-C).
Fig. 6.
Forest plots for the analysis of cadence and its subgroups. (A) subgroup analysis on post-stroke time, (B) subgroup analysis on number of stimulation sites, (C) subgroup analysis on treatment sessions
Subgroup analysis of post-stroke time indicated that the acute and subacute phases [SMD = 1.04, 95% CI (0.54, 1.54), P<0.0001] showed a higher effect size than the chronic phase [SMD = 0.66, 95% CI (0.10, 1.22), P = 0.02], as shown in Fig. 6-A. Subgroup analysis of the number of stimulation sites indicated that multiple stimulation sites [SMD = 0.79, 95% CI (0.22, 1.36), P = 0.006] showed a higher effect size than a single stimulation site [SMD = 0.74, 95% CI (0.04, 1.44), P = 0.04], as shown in Fig. 6-B. Subgroup analysis of treatment sessions indicated that ≤ 4 weeks [SMD = 0.91, 95% CI (0.46, 1.36), P<0.0001] showed a higher effect size than > 4 weeks [SMD = 0.70, 95% CI (0.09,1.32), P = 0.02], as shown in Fig. 6-C.
Affected side step length
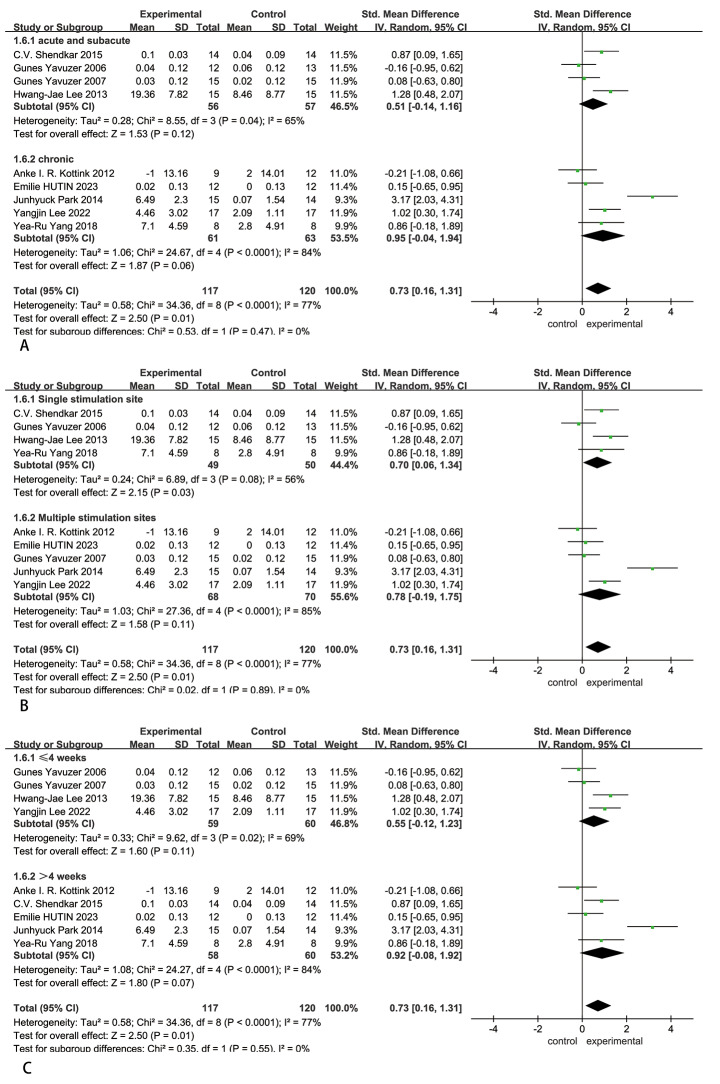
Nine studies were included, involving 237 patients with stroke-induced lower limb motor dysfunction. Due to the heterogeneity test results (P<0.0001, I2 = 77%), a random-effect model analysis was used. The results in Fig. 7 indicated that there was a statistical difference between the experimental group and the control group [SMD = 0.73, 95% CI (0.16, 1.31), P = 0.01]. Sensitivity analysis found that the results showed satisfactory robustness (Fig. 8-A).
Fig. 7.
Forest plots for the analysis of affected side step length and its subgroups. (A) subgroup analysis on post-stroke time, (B) subgroup analysis on number of stimulation sites, (C) subgroup analysis on treatment sessions
Fig. 8.
Sensitivity analysis plots of affected side step length (subfigure A), stride length (subfigure B) and spatial asymmetry (subfigure C)
Subgroup analysis of post-stroke time indicated that the chronic phase [SMD = 0.95, 95% CI (-0.04, 1.94), P = 0.06] showed a higher effect size than the acute and subacute phases [SMD = 0.51, 95% CI (-0.14, 1.16), P = 0.12], as shown in Fig. 7-A. Subgroup analysis of the number of stimulation sites indicated that multiple stimulation sites [SMD = 0.78, 95% CI (-0.19, 1.75), P = 0.11] showed a higher effect size than a single stimulation site [SMD = 0.70, 95% CI (0.06, 1.34), P = 0.03], as shown in Fig. 7-B. Subgroup analysis of treatment sessions indicated that > 4 weeks [SMD = 0.92, 95% CI (-0.08, 1.92), P = 0.07] showed a higher effect size than ≤ 4 weeks [SMD = 0.55, 95% CI (-0.12, 1.23), P = 0.11], as shown in Fig. 7-C.
Stride length
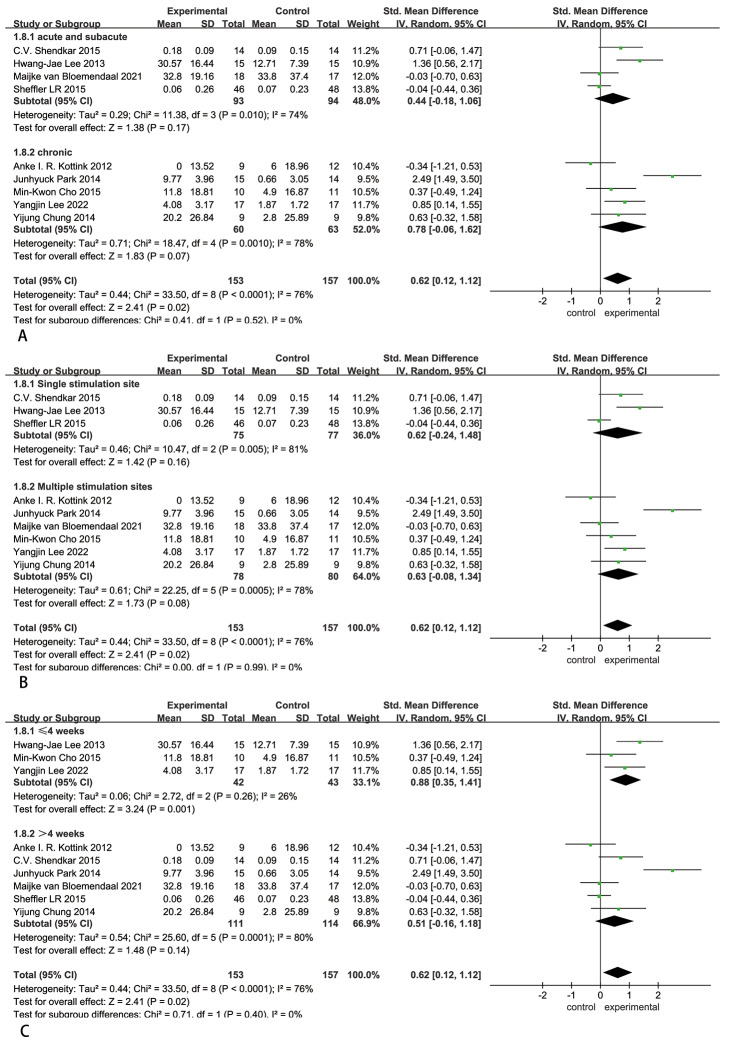
Nine studies involving 310 patients with stroke-induced lower limb motor impairment were included. Due to the heterogeneity test results (P<0.0001, I2 = 76%), a random-effect model analysis was used. The results in Fig. 9 indicated that there was a statistical difference between the experimental group and the control group [SMD = 0.62, 95% CI (0.12, 1.12), P = 0.02]. Sensitivity analysis showed satisfactory robustness (Fig. 8-B).
Fig. 9.
Forest plots for the analysis of stride length. (A) subgroup analysis on post-stroke time, (B) subgroup analysis on number of stimulation sites, (C) subgroup analysis on treatment sessions
Subgroup analysis of post-stroke time indicated that the chronic phase [SMD = 0.78, 95% CI (-0.06, 1.62), P = 0.07] showed a higher effect size than the acute and subacute phases [SMD = 0.44, 95% CI (-0.18, 1.06), P = 0.17], as shown in Fig. 9-A. Subgroup analysis of the number of stimulation sites indicated that multiple stimulation sites [SMD = 0.63, 95% CI (-0.08, 1.34), P = 0.08] showed a higher effect size than a single stimulation site [SMD = 0.62, 95% CI (-0.24, 1.48), P = 0.16], as shown in Fig. 9-B. Subgroup analysis of treatment sessions indicated that ≤ 4 weeks [SMD = 0.88, 95% CI (0.35, 1.41), P = 0.001] showed a higher effect size than > 4 weeks [SMD = 0.51, 95% CI (-0.16, 1.18), P = 0.14], as shown in Fig. 9-C.
Angle of ankle dorsiflexion
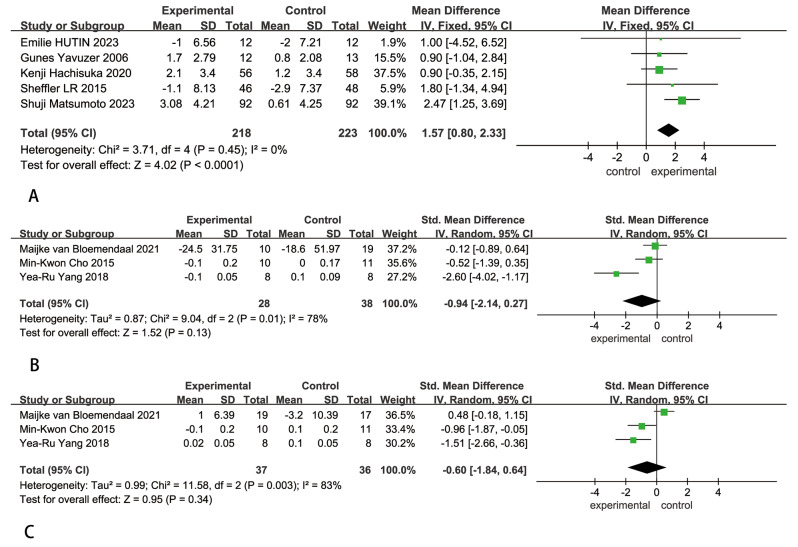
Five studies involving 441 patients with stroke-induced lower limb motor impairment were included. Due to the heterogeneity test results (P = 0.45, I2 = 0%), a fixed-effect model analysis was used. The results in Fig. 10-A indicated that there was a statistical difference between the experimental group and the control group [WMD = 1.57, 95% CI (0.80, 2.33), P < 0.0001].
Fig. 10.
Forest plots for the analysis of angle of ankle dorsiflexion (subfigure A), spatial asymmetry (subfigure B), temporal asymmetry (subfigure C)
Asymmetry
This can be categorized into spatial asymmetry and temporal asymmetry.
Concerning spatial asymmetry, three studies involving 66 patients with stroke-induced lower limb motor impairment were included. Due to the heterogeneity test results (P = 0.01, I2 = 78%), a random-effect model analysis was used. The results in Fig. 10-B indicated no statistical difference between the experimental group and the control group [SMD=-0.94, 95% CI (-2.14, 0.27), P = 0.13].
Regarding temporal asymmetry, three studies involving 73 patients with stroke-induced lower limb motor impairment were included. Due to the heterogeneity test results (P = 0.003, I2 = 83%), a random-effect model analysis was used. The results in Fig. 10-C indicated no statistical difference between the experimental group and the control group [SMD=-0.60, 95% CI (-1.84, 0.64), P = 0.34].
Sensitivity analysis found that both spatial (Fig. 8-C) and temporal (Fig. 11-A) asymmetries showed satisfactory robustness. Considering the number of included studies and the quantitative limitations of the sample size, subgroup analysis was not applicable.
Fig. 11.
Sensitivity analysis plots of temporal asymmetry (subfigure A), BBS (subfigure B), TUG (subfigure C)
6MWT
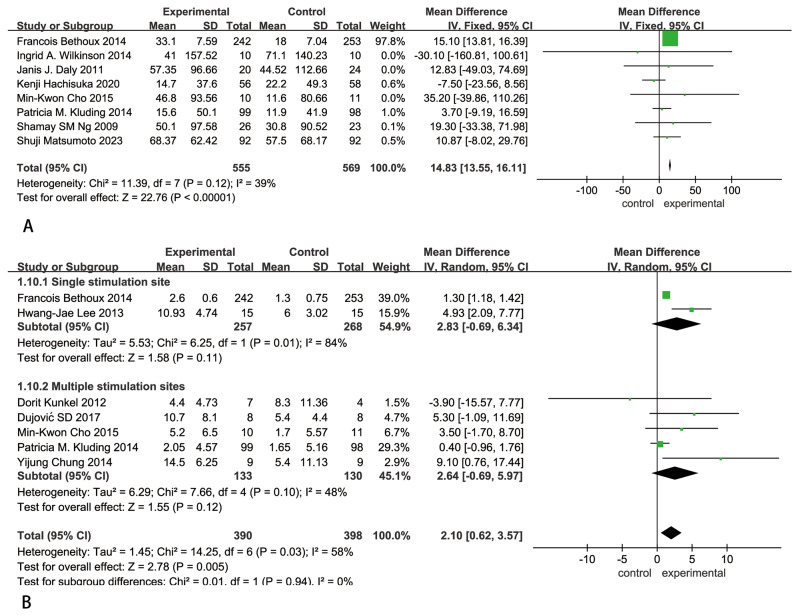
Eight studies were included, involving 1124 patients with stroke-induced lower limb motor dysfunction. Due to the heterogeneity test results (P = 0.12, I2 = 39%), a fixed-effect model analysis was used. The results in Fig. 12-A indicated that there was a statistical difference between the experimental group and the control group [WMD = 14.83, 95% CI (13.55, 16.11), P<0.00001].
Fig. 12.
Forest plots for the analysis of 6MWT (subfigure A), BBS (subfigure B)
BBS
Seven studies were included, involving 788 patients with stroke-induced lower limb motor impairment. A random-effect model analysis was used due to the heterogeneity test results (P = 0.03, I2 = 58%). The results in Fig. 12-B indicated that there was a statistical difference between the experimental group and the control group [WMD = 2.10, 95% CI (0.62, 3.57), P = 0.005]. Sensitivity analysis demonstrated satisfactory robustness (Fig. 11-B).
Subgroup analysis of the number of stimulation sites indicated that a single stimulation site [WMD = 2.83, 95% CI (-0.69, 6.34), P = 0.11] showed a higher effect size than multiple stimulation sites [WMD = 2.64, 95% CI (-0.69, 5.97), P = 0.12], as shown in Fig. 12-B.
Time up and go test (TUG)
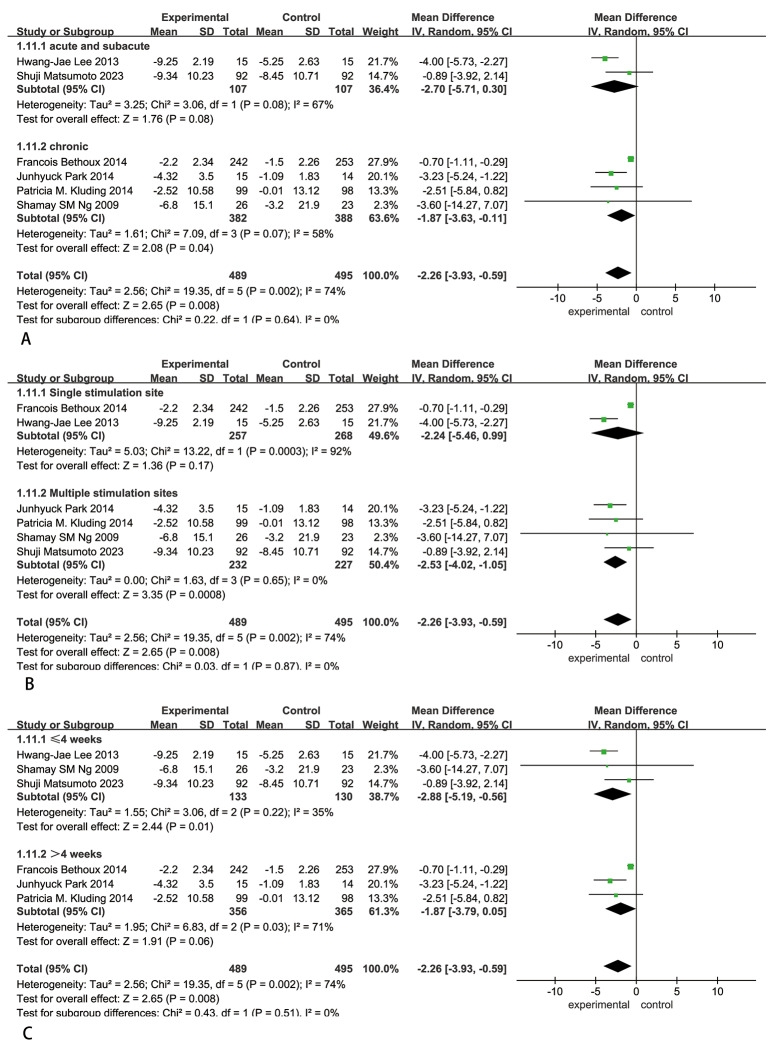
Six studies were included, involving 984 patients with stroke-induced lower limb motor dysfunction. A random-effect model analysis was used due to the heterogeneity test results (P = 0.002, I2 = 74%). The results in Fig. 13 indicated that there was a statistical difference between the experimental group and the control group [WMD=-2.26, 95% CI (-3.93, -0.59), P = 0.008]. Sensitivity analysis showed satisfactory robustness (Fig. 11-C).
Fig. 13.
Forest plots for the analysis of TUG and its subgroups. (A) subgroup analysis on post-stroke time, (B) subgroup analysis on number of stimulation sites, (C) subgroup analysis on treatment sessions
Subgroup analysis of post-stroke time indicated that the acute and subacute phases [WMD=-2.70, 95% CI (-5.71, 0.30), P = 0.08] showed a higher effect size than the chronic phase [WMD=-1.87, 95% CI (-3.63, -0.11), P = 0.04], as shown in Fig. 13-A. Subgroup analysis based on the number of stimulation sites indicated that multiple stimulation sites [WMD=-2.53, 95% CI (-4.02, -1.05), P = 0.0008] showed a higher effect size than a single stimulation site [WMD=-2.24, 95% CI (-5.46, 0.99), P = 0.17], as shown in Fig. 13-B. Subgroup analysis of treatment sessions indicated that ≤ 4 weeks [WMD=-2.88, 95% CI (-5.19, -0.56), P = 0.01] showed a higher effect size than > 4 weeks [WMD=-1.87, 95% CI (-3.79, 0.05), P = 0.06], as shown in Fig. 13-C.
Fugl-Meyer assessment lower extremity (FMA-LE)
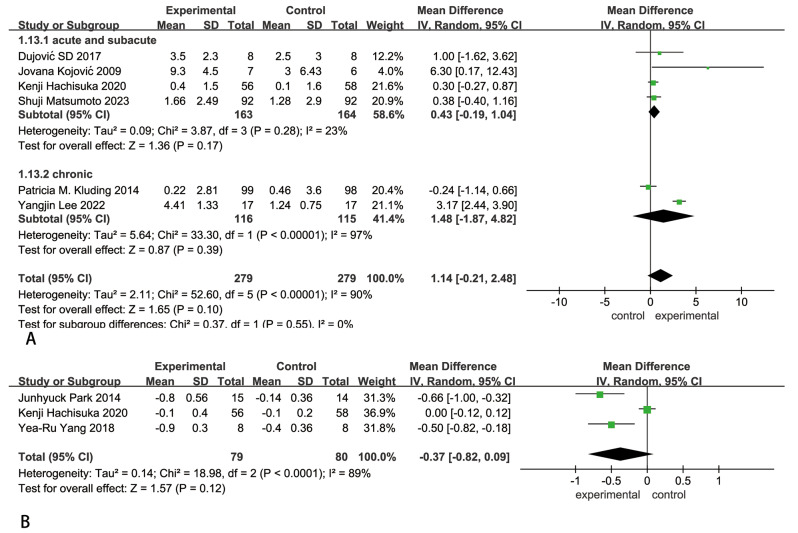
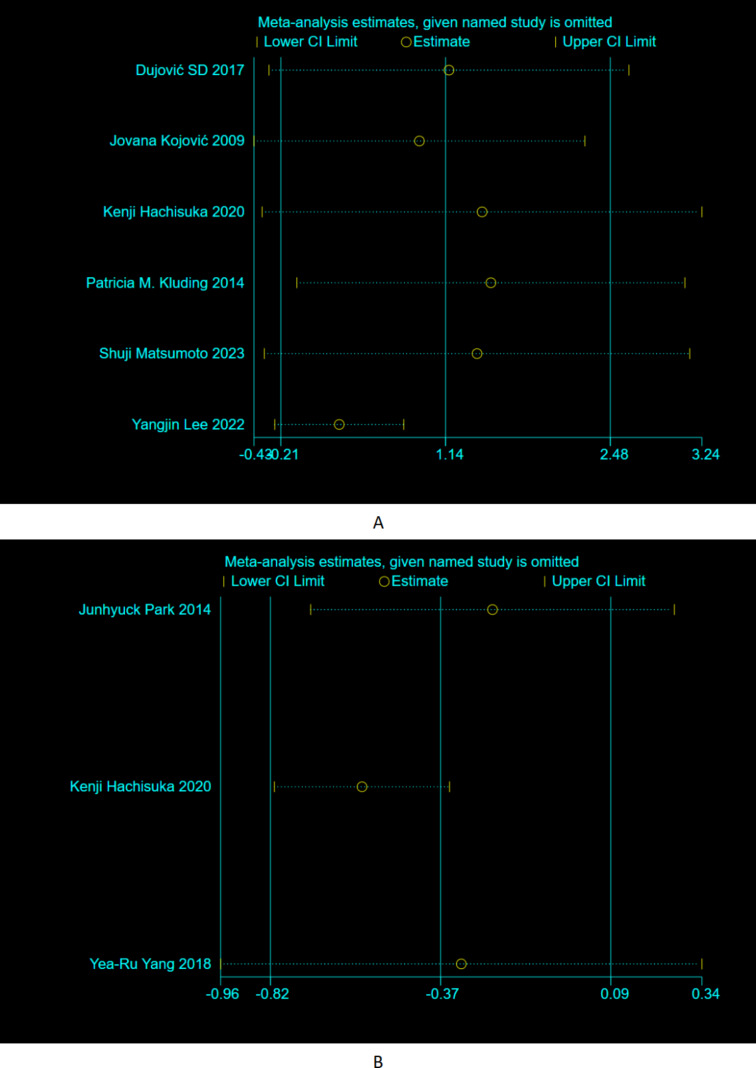
Six studies involving 558 patients with stroke-induced lower limb motor impairment were included. A random-effect model analysis was used due to the heterogeneity test results (P < 0.00001, I2 = 90%). The results in Fig. 14-A indicated that there was no statistical difference between the experimental group and the control group [WMD = 1.14, 95% CI (-0.21, 2.48), P = 0.10]. Sensitivity analysis found that the results showed satisfactory robustness (Fig. 15-C).
Fig. 14.
Forest plots for the analysis of FMA-LE (subfigure A) and MAS (subfigure B)
Fig. 15.
Sensitivity analysis plots of FMA-LE (subfigure A) and MAS (subfigure B)
Subgroup analysis of post-stroke time indicated that the chronic phase [WMD = 1.48, 95% CI (-1.87, 4.82), P = 0.39] showed a higher effect size than the acute and subacute phases [WMD = 0.43, 95% CI (-0.19, 1.04), P = 0.17], as shown in Fig. 14-A.
Modified ashworth assessment (MAS)
Assessed on the plantar flexor muscles, three studies involving 159 patients with stroke-induced lower limb motor dysfunction were included. Due to the heterogeneity test results (P < 0.0001, I2 = 89%), a random-effect model analysis was used. The results in Fig. 14-B indicated that no statistical difference between the experimental group and the control group [WMD=-0.37, 95% CI (-0.82, 0.09), P = 0.12]. Sensitivity analysis showed satisfactory robustness (Fig. 15-B).
Considering the number of included studies and the quantitative limitations of the sample size, this indicator was not analyzed in subgroups.
Publication bias
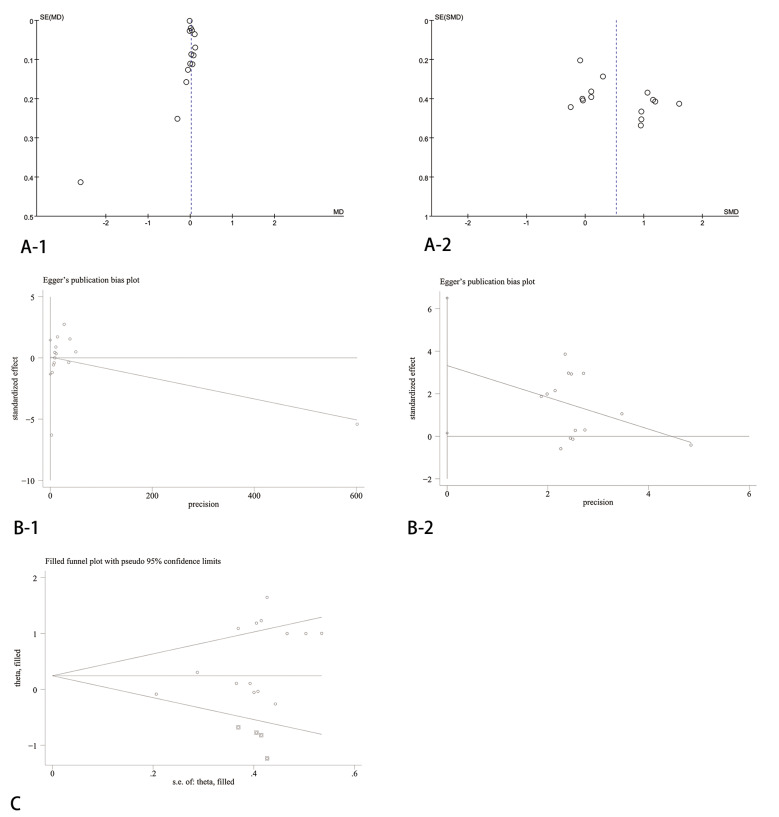
In most of the included studies, QGA speed and 10MWT were used as outcome indicators. Visual inspection of the funnel plot (Fig. 16-A) showed no evidence for publication bias. Nevertheless, due to the mild asymmetry in effect sizes, the Egger’s regression intercept test was used to further illustrate publication bias. The Egger’s test for the 10MWT (Fig. 16-B-1) was not statistically significant (P = 0.908), indicating no publication bias. However, the Egger’s test for QGA speed (Fig. 16-B-2) was statistically significant (P = 0.041), suggesting that publication bias may affect the observed indicators. And the Duval and Tweedie’s trim and fill procedure (Fig. 16-C) was then conducted to assess publication bias. Fourteen missing studies were imputed during the analysis to account for potential bias. The pooled odds ratio for the included studies was 0.547 (95% CI: 0.216–0.879), indicating a significant association. After adjustment with the imputed studies, the odds ratio was slightly attenuated to 1.276 (95% CI: 0.890–1.830). The effect of the interventions remained statistically significant after adjusting for potential publication bias.
Fig. 16.
Summary of publication bias. (A-1) funnel plot of 10MWT, (A-2) funnel plot of QGA speed, (B-1) Egger’s publication bias plot of 10MWT, (B-2) Egger’s publication bias plot of QGA speed, (C) the Duval and Tweedie’s trim and fill procedure of QGA speed
Discussion
To explore the specific effects of NMES, researchers in randomized controlled trials compared NMES (including FES and TENS) with conventional gait training or treadmill walking training. Electrical stimulation as a less complicated treatment has the potential to reduce atrophy, improve muscle strength, increase range of motion, reduce edema, heal tissues and relieve pain [54]. Our study was suspected to suffer from publication bias. Due to the low likelihood of editorial bias and peer review bias [55, 56], the fact that small sample size trials were published may have caused the publication bias. After double-checking, it was found that the sample size of the included studies involving QGA speed was indeed small in comparison to those involving 10MWT. Fortunately, our study was found to be robust through sensitivity analysis. In addition, our study showed that NMES was associated with changes of 6MWT, QGA speed, ankle dorsiflexion, cadence, stride length, affected side step length, TUG and BBS, which were potentially clinically beneficial for patients. However, compared with the control group, the experimental group had no significant advantages in 10MWT, FMA-LE, MAS and asymmetry. The NMES therapy for stroke-induced walking dysfunction is an area that has been consistently studied, and the final timespan of the included literature was from 1997 to 2023.
This review attempted to include studies that all used instruments to measure physical function. However, owing to the long history of NMES research, few of the early studies were conditioned to use instruments to measure. And all of the included literature contained walking speed (QGA speed or 10MWT) which is a valid and reliable indicator of walking ability recovery after stroke [57, 58]. Intriguingly, after analyzing these two kinds of indicator, we obtained different results: QGA speed analysis of a relatively small sample size revealed that the experimental group was superior to the control group, while 10MWT analysis of a comparatively large sample size did not. Furthermore, the discovery about 10MWT seems to be more noteworthy than QGA speed. Although the present study suggests no significant association between NMES and improvement of walking speed, several studies [59–61] have concluded a positive effect of NMES in this regard. Bethoux et al. [35] noted no statistical significance between-group differences in speed were observed between FES and AFO. This is consisted with our result and another meta-analysis [62] which revealed low-quality of evidence for positive effects of FES on gait speed when combined with physiotherapy. Moreover, meta-results indicated that NMES was related to improvements in cadence, stride length, and affected side step length. Despite these indicator changes not directly and accurately reflect whether walking motor patterns improve or not [63], a better comprehension may be achieved by discussing these results together with changes in other indicators.
A possible explanation for these results is the improvement of ankle dorsiflexion. Our meta-study indicated a better performance of NMES in improving ankle dorsiflexion ability. The initial contact of the foot with the ground shifts from anterior to posterior in response to the increasing ankle mobility [64]. Further, changes in the anterior-posterior displacement of the center of foot pressure were significantly predictive of changes in walking speed [65]. The improvement of foot clearance could enhance forward ability and stability during locomotion, thus it is not surprising that NMES is associated with improvements in cadence, stride length and affected side step length.
Well-endurance is a reflection of excellent walking function. And 6MWT is an essential assessment for walking endurance reflecting the ability to functionally compensate for daily physical activity [66]. The meta-study by Hong et al. [19] concluded that NMES had no significant effect on the improvement of 6MWT. Notably, our study updated this evidence and found a correlation between NMES and the improvement of endurance. Complete muscle function and control are integral parts of motor control and postural balance. NMES overcomes impaired muscle activation by increasing motor unit recruitment and motor unit discharge rate [67]. For these reasons, it makes sense that TUG and BBS, which require more muscular components to be involved, could be improved. Improvement in asymmetry is not only limited by impaired muscle activation, but also by more demanding conditions such as central control, multi-muscle and multi-joint coordination. Therefore, not surprisingly, NMES did not show significant correlations with asymmetry and FMA-LE.
In general, we confirmed and updated the rehabilitative effects of NMES on stroke-induced walking dysfunction. NMES plays an active and limited role in the improvement of temporal and spatial parameters among stroke survivors. Integrating the role of NMES in improving walking patterns by combining other therapies like robot-assisted gait training could be the focus of further research.
Post-stroke time
After subgroup analysis, the heterogeneity decreased significantly in 10MWT, cadence, affected side step length, stride length, QGA speed, TUG and FMA-LE, suggesting that post-stroke time may be the source of heterogeneity in these indicators. All these measures, except cadence and TUG, presented a superior therapeutic effect of NMES for patients in the chronic phase compared to those in the acute and subacute phases. NMES can enhance neural recruitment in muscles [68]. NMES is more effective in improving neuroplasticity for patients in the chronic phase, implying that we could break the motor patterns of stroke patients at this stage by NMES. Balance, muscle strength as well as motor coordination were poor for patients in the early stages [69, 70]. Cadence and TUG reflect the overall physical function of patients. Thus, explaining the changes observed in subgroup analyses.
Number of stimulation sites
Subgroup analysis of most indicators demonstrated that multiple stimulation sites resulted in better functional improvement. Remarkably, a single stimulation site was more beneficial in improving BBS. Detailed matching of the included studies involving a single stimulation site revealed that all of them stimulated either the peroneal nerve or the tibialis anterior muscle. The tibialis anterior muscle’s bundles dynamics well represent postural sway during standing balance [71]. And a study [72] proposes that quiescent, unregulated muscles may be better suited to provide proprioceptive input during quiet standing. Boyas et al. [73] proposed that postural control can be impaired when the muscles of ankle dorsiflexion get fatigued. In conjunction with this meta-analysis, it can be seen that stimulating key muscles alone, such as the tibialis anterior muscle, is an effective way to improve balance.
Treatment sessions
After subgroup analysis, the heterogeneity decreased significantly in cadence, stride length, QGA speed and TUG, implying that treatment sessions may be the source of heterogeneity in these indicators. NMES can alter the population of motor units that is activated by voluntary and reflex means. Electrical stimulation also alters the recruitment threshold of motor units involved in voluntary and reflexive muscle contractions [74]. Furthermore, prolonged application of NMES may be similar to ice therapy. It is recommended to be applied no longer than 20 to 30 min [75], to avoid physical impairment and because of the body’s adaptability. Long treatment sessions may increase neural excitability threshold and lead to adaptation. In conclusion, meta-analysis indicates that treatments of less than or equal to 4 weeks may provide greater benefit to patients, requiring further rigorous randomized controlled trial.
Strengths of the study
One of the strengths of this study is the extensive database search that was conducted. This approach enhanced the comprehensiveness of the review and increased the likelihood of identifying a diverse pool of studies, providing a more complete view of the current state of research. Moreover, this meta-analysis confirms and updates the effects of NMES on the improvement of stroke-induced walking dysfunction. Multiple subgroup analyses have the potential to promote a deeper understanding and advancement of NMES treatment, providing a theoretical basis for further research and discussions in the field and informing clinical decision-making.
Limitations of the study
The primary limitation of this study is the lack of meta-analysis regarding different types of NMES and varying stimulation frequencies and diverse stimulation positions. This shortcoming may require further research, given that some of the studies did not specify the type or frequency. Besides, there is a mild publication bias in this study. While this does not invalidate our results, it require a more critical and discerning interpretation.
Conclusions
Based on the present data, NMES does play a role in the modification of stroke-induced walking dysfunction. And NMES outperformed conventional training in most kinematic indicators including affected side step length, cadence, ankle dorsiflexion. However, given the conflicting results of QGA speed and 10MWT, the effect of NMES on walking speed remain inconclusive. NMES may be more effective for survivors in the chronic phase than the acute and subacute phases, and shorter treatment sessions appear to be more efficacious than longer ones.
These conclusions should be viewed with caution due to the recognized shortcomings of existing research. There is an urgent need to study different types of NMES or NMES with varying stimulation frequencies and stimulation position. The involvement of quantitative gait analysis may generate unexpected findings.
Electronic supplementary material
Below is the link to the electronic supplementary material.
Acknowledgements
We wish to thank Dr. Manting Cao for polishing the translation.
Author contributions
S.S. and J.J. conceived the manuscript and analyzed the data. Y.Z., Y.X and H.P. searched the literature and collected data. S.S., J.J. and B.S. assessed methodological quality and contributed to data curation and writing of the first draft. J.E. participated in verification, writing, review and editing. All authors contributed to the article and approved the final manuscript.
Funding
Key Scientific Research and Development Program of Zhejiang Province, China [No. 2021C03050]; The Construct Program of the Key Discipline in Zhejiang Rehabilitation Medical Center, China [ZKXK02].
Data availability
No datasets were generated or analysed during the current study.
Declarations
Ethics approval and consent to participate
Not applicable.
Consent for publication
All authors consent to publish this study, including textual content, figures and tables, in the Journal of Neuroengineering and Rehabilitation. We acknowledge our authorship and authorize the use of this material in accordance with the publication’s policies.
Competing interests
The authors declare no competing interests.
Footnotes
Publisher’s note
Springer Nature remains neutral with regard to jurisdictional claims in published maps and institutional affiliations.
Shishi Chen, Jingjing Gao and Ye Zhou contributed equally to this work.
References
- 1.Guerrero R, Ceci Galanos L, Arsovska A, et al. Stroke Education in the Digital era: recent advances and the E-Strategy of the World Stroke Academy [J]. Stroke. 2024;55(3):e52–5. [DOI] [PubMed] [Google Scholar]
- 2.Rodríguez-Fernández A, Lobo-Prat J, Font-Llagunes JM. Systematic review on wearable lower-limb exoskeletons for gait training in neuromuscular impairments [J]. J Neuroeng Rehabil. 2021;18(1):22. [DOI] [PMC free article] [PubMed] [Google Scholar]
- 3.Duncan PW, Goldstein LB, Horner RD, et al. Similar motor recovery of upper and lower extremities after stroke [J]. Stroke. 1994;25(6):1181–8. [DOI] [PubMed] [Google Scholar]
- 4.Kim CM, Eng JJ. Magnitude and pattern of 3D kinematic and kinetic gait profiles in persons with stroke: relationship to walking speed [J]. Gait Posture. 2004;20(2):140–6. [DOI] [PMC free article] [PubMed] [Google Scholar]
- 5.Kinoshita S, Abo M, Okamoto T, et al. Utility of the revised version of the ability for Basic Movement Scale in Predicting Ambulation during Rehabilitation in Poststroke patients [J]. J Stroke Cerebrovasc Dis. 2017;26(8):1663–9. [DOI] [PubMed] [Google Scholar]
- 6.Fulk GD, He Y, Boyne P, et al. Predicting Home and Community walking activity poststroke [J]. Stroke. 2017;48(2):406–11. [DOI] [PubMed] [Google Scholar]
- 7.Lord SE, Rochester L. Measurement of community ambulation after stroke: current status and future developments [J]. Stroke. 2005;36(7):1457–61. [DOI] [PubMed] [Google Scholar]
- 8.Ring H, Treger I, Gruendlinger L, et al. Neuroprosthesis for footdrop compared with an ankle-foot orthosis: effects on postural control during walking [J]. J Stroke Cerebrovasc Dis. 2009;18(1):41–7. [DOI] [PubMed] [Google Scholar]
- 9.Peckham PH, Knutson JS. Functional electrical stimulation for neuromuscular applications [J]. Annu Rev Biomed Eng. 2005;7:327–60. [DOI] [PubMed] [Google Scholar]
- 10.Liberson WT, Holmquest HJ, Scot D, et al. Functional electrotherapy: stimulation of the peroneal nerve synchronized with the swing phase of the gait of hemiplegic patients [J]. Arch Phys Med Rehabil. 1961;42:101–5. [PubMed] [Google Scholar]
- 11.Valenti F. [Neuromuscular Electrostimulation In Clinical Practice] [J]. Acta Anaesthesiol. 1964;15:227–45. [PubMed] [Google Scholar]
- 12.Sluka KA, Walsh D. Transcutaneous electrical nerve stimulation: basic science mechanisms and clinical effectiveness [J]. J Pain. 2003;4(3):109–21. [DOI] [PubMed] [Google Scholar]
- 13.Kim DH, Jang SH. Effects of Mirror Therapy Combined with EMG-Triggered Functional Electrical Stimulation to improve on standing Balance and Gait ability in patient with chronic stroke [J]. Int J Environ Res Public Health. 2021;18(7). [DOI] [PMC free article] [PubMed]
- 14.Yang YR, Mi PL, Huang SF, et al. Effects of neuromuscular electrical stimulation on gait performance in chronic stroke with inadequate ankle control - A randomized controlled trial [J]. PLoS ONE. 2018;13(12):e0208609. [DOI] [PMC free article] [PubMed] [Google Scholar]
- 15.Zheng H, Tian F, Sun W et al. Neuromuscular electrical stimulation improves frontal ankle motor control in individuals with chronic ankle instability during drop-landing [J]. Am J Phys Med Rehabil. 2024. [DOI] [PubMed]
- 16.Burridge JH, Taylor PN, Hagan SA, et al. The effects of common peroneal stimulation on the effort and speed of walking: a randomized controlled trial with chronic hemiplegic patients [J]. Clin Rehabil. 1997;11(3):201–10. [DOI] [PubMed] [Google Scholar]
- 17.van Bloemendaal M, Bus SA, Nollet F, et al. Feasibility and preliminary efficacy of Gait Training assisted by Multichannel Functional Electrical Stimulation in Early Stroke Rehabilitation: a pilot randomized controlled trial [J]. Neurorehabil Neural Repair. 2021;35(2):131–44. [DOI] [PubMed] [Google Scholar]
- 18.Hachisuka K, Ochi M, Kikuchi T, et al. Clinical effectiveness of peroneal nerve functional electrical stimulation in chronic stroke patients with hemiplegia (PLEASURE): a multicentre, prospective, randomised controlled trial [J]. Clin Rehabil. 2021;35(3):367–77. [DOI] [PubMed] [Google Scholar]
- 19.Hong Z, Sui M, Zhuang Z, et al. Effectiveness of neuromuscular electrical stimulation on lower limbs of patients with Hemiplegia after Chronic Stroke: a systematic review [J]. Arch Phys Med Rehabil. 2018;99(5):1011–e221. [DOI] [PubMed] [Google Scholar]
- 20.Page MJ, McKenzie JE, Bossuyt PM, et al. The PRISMA 2020 statement: an updated guideline for reporting systematic reviews [J]. BMJ. 2021;372:n71. [DOI] [PMC free article] [PubMed] [Google Scholar]
- 21.Shen W, Fan X, Wang L, et al. Traditional Chinese medicine for Post-stroke Cognitive Impairment: a systematic review and Meta-analysis [J]. Front Pharmacol. 2022;13:816333. [DOI] [PMC free article] [PubMed] [Google Scholar]
- 22.Cha HG, Kim MK. Effects of strengthening exercise integrated repetitive transcranial magnetic stimulation on motor function recovery in subacute stroke patients: a randomized controlled trial [J]. Technol Health Care. 2017;25(3):521–9. [DOI] [PubMed] [Google Scholar]
- 23.Sterne JAC, Savović J, Page MJ, et al. RoB 2: a revised tool for assessing risk of bias in randomised trials [J]. BMJ. 2019;366:l4898. [DOI] [PubMed] [Google Scholar]
- 24.A GRADE Working. Group approach for rating the quality of treatment effect estimates from network meta-analysis [J]. BMJ. 2015;350:h3326. [DOI] [PubMed] [Google Scholar]
- 25.Lemes ÍR, Ferreira PH, Linares SN, et al. Resistance training reduces systolic blood pressure in metabolic syndrome: a systematic review and meta-analysis of randomised controlled trials [J]. Br J Sports Med. 2016;50(23):1438–42. [DOI] [PMC free article] [PubMed] [Google Scholar]
- 26.Wan X, Wang W, Liu J, et al. Estimating the sample mean and standard deviation from the sample size, median, range and/or interquartile range [J]. BMC Med Res Methodol. 2014;14:135. [DOI] [PMC free article] [PubMed] [Google Scholar]
- 27.Luo D, Wan X, Liu J, et al. Optimally estimating the sample mean from the sample size, median, mid-range, and/or mid-quartile range [J]. Stat Methods Med Res. 2018;27(6):1785–805. [DOI] [PubMed] [Google Scholar]
- 28.Bernhardt J, Hayward KS, Kwakkel G, et al. Agreed definitions and a shared vision for new standards in stroke recovery research: the Stroke Recovery and Rehabilitation Roundtable taskforce [J]. Int J Stroke. 2017;12(5):444–50. [DOI] [PubMed] [Google Scholar]
- 29.Kottink AI, Tenniglo MJ, de Vries WH, et al. Effects of an implantable two-channel peroneal nerve stimulator versus conventional walking device on spatiotemporal parameters and kinematics of hemiparetic gait [J]. J Rehabil Med. 2012;44(1):51–7. [DOI] [PubMed] [Google Scholar]
- 30.Shendkar CV, Lenka PK, Biswas A, Kumar R, Mahadevappa M. Therapeutic effects of functional electrical stimulation on gait, motor recovery, and motor cortex in stroke survivors[J]. Hong Kong Physiother J. 2015;33(1):10–20.
- 31.Lairamore CI, Garrison MK, Bourgeon L, et al. Effects of functional electrical stimulation on gait recovery post-neurological injury during inpatient rehabilitation [J]. Percept Mot Skills. 2014;119(2):591–608. [DOI] [PMC free article] [PubMed] [Google Scholar]
- 32.Kunkel D, Pickering RM, Burnett M, et al. Functional electrical stimulation with exercises for standing balance and weight transfer in acute stroke patients: a feasibility randomized controlled trial [J]. Neuromodulation. 2013;16(2):168–77. [DOI] [PubMed] [Google Scholar]
- 33.Dujović SD, Malešević J, Malešević N, et al. Novel multi-pad functional electrical stimulation in stroke patients: a single-blind randomized study [J]. NeuroRehabilitation. 2017;41(4):791–800. [DOI] [PubMed] [Google Scholar]
- 34.Hutin E, Ghédira M, Vinti M, et al. Comparing the effect of implanted peroneal nerve stimulation and ankle-foot orthosis on Gait kinematics in Chronic Hemiparesis: a randomized controlled trial [J]. J Rehabil Med. 2023;55:jrm7130. [DOI] [PMC free article] [PubMed] [Google Scholar]
- 35.Bethoux F, Rogers HL, Nolan KJ, et al. The effects of peroneal nerve functional electrical stimulation versus ankle-foot orthosis in patients with chronic stroke: a randomized controlled trial [J]. Neurorehabil Neural Repair. 2014;28(7):688–97. [DOI] [PubMed] [Google Scholar]
- 36.Morone G, Fusco A, Di Capua P, Coiro P, Pratesi L. Walking training with foot drop stimulator controlled by a tilt sensor to improve walking outcomes: a randomized controlled pilot study in patients with stroke in subacute phase [J]. Stroke Res Treat. 2012;2012:523564. [DOI] [PMC free article] [PubMed]
- 37.Yavuzer G, Geler-Külcü D, Sonel-Tur B, et al. Neuromuscular electric stimulation effect on lower-extremity motor recovery and gait kinematics of patients with stroke: a randomized controlled trial [J]. Arch Phys Med Rehabil. 2006;87(4):536–40. [DOI] [PubMed] [Google Scholar]
- 38.Yavuzer G, Oken O, Atay MB, et al. Effect of sensory-amplitude electric stimulation on motor recovery and gait kinematics after stroke: a randomized controlled study [J]. Arch Phys Med Rehabil. 2007;88(6):710–4. [DOI] [PubMed] [Google Scholar]
- 39.Lee HJ, Cho KH, Lee WH. The effects of body weight support treadmill training with power-assisted functional electrical stimulation on functional movement and gait in stroke patients [J]. Am J Phys Med Rehabil. 2013;92(12):1051–9. [DOI] [PubMed] [Google Scholar]
- 40.Wilkinson IA, Burridge J, Strike P, et al. A randomised controlled trial of integrated electrical stimulation and physiotherapy to improve mobility for people less than 6 months post stroke [J]. Disabil Rehabil Assist Technol. 2015;10(6):468–74. [DOI] [PubMed] [Google Scholar]
- 41.Daly JJ, Zimbelman J, Roenigk KL, et al. Recovery of coordinated gait: randomized controlled stroke trial of functional electrical stimulation (FES) versus no FES, with weight-supported treadmill and over-ground training [J]. Neurorehabil Neural Repair. 2011;25(7):588–96. [DOI] [PubMed] [Google Scholar]
- 42.Kojović J, Djurić-Jovicić M, Dosen S, et al. Sensor-driven four-channel stimulation of paretic leg: functional electrical walking therapy [J]. J Neurosci Methods. 2009;181(1):100–5. [DOI] [PubMed] [Google Scholar]
- 43.Park J, Seo D, Choi W, et al. The effects of exercise with TENS on spasticity, balance, and gait in patients with chronic stroke: a randomized controlled trial [J]. Med Sci Monit. 2014;20:1890–6. [DOI] [PMC free article] [PubMed] [Google Scholar]
- 44.Jung KS, Jung JH, In TS et al. Effectiveness of heel-raise-Lower Exercise after Transcutaneous Electrical Nerve Stimulation in patients with stroke: a randomized controlled study [J]. J Clin Med. 2020;9(11). [DOI] [PMC free article] [PubMed]
- 45.Salisbury L, Shiels J, Todd I, et al. A feasibility study to investigate the clinical application of functional electrical stimulation (FES), for dropped foot, during the sub-acute phase of stroke - A randomized controlled trial [J]. Physiother Theory Pract. 2013;29(1):31–40. [DOI] [PubMed] [Google Scholar]
- 46.Cho MK, Kim JH, Chung Y, et al. Treadmill gait training combined with functional electrical stimulation on hip abductor and ankle dorsiflexor muscles for chronic hemiparesis [J]. Gait Posture. 2015;42(1):73–8. [DOI] [PubMed] [Google Scholar]
- 47.Kluding PM, Dunning K, O’Dell MW, et al. Foot drop stimulation versus ankle foot orthosis after stroke: 30-week outcomes [J]. Stroke. 2013;44(6):1660–9. [DOI] [PubMed] [Google Scholar]
- 48.Ng SS, Hui-Chan CW. Does the use of TENS increase the effectiveness of exercise for improving walking after stroke? A randomized controlled clinical trial [J]. Clin Rehabil. 2009;23(12):1093–103. [DOI] [PubMed] [Google Scholar]
- 49.Sheffler LR, Taylor PN, Bailey SN, et al. Surface peroneal nerve stimulation in lower limb hemiparesis: effect on quantitative gait parameters [J]. Am J Phys Med Rehabil. 2015;94(5):341–57. [DOI] [PMC free article] [PubMed] [Google Scholar]
- 50.Matsumoto S, Shimodozono M, Noma T et al. Effect of functional electrical stimulation in Convalescent Stroke patients: a Multicenter, Randomized Controlled trial [J]. J Clin Med. 2023;12(7). [DOI] [PMC free article] [PubMed]
- 51.Mitsutake T, Sakamoto M, Horikawa E. The effects of electromyography-triggered neuromuscular electrical stimulation plus tilt sensor functional electrical stimulation training on gait performance in patients with subacute stroke: a randomized controlled pilot trial [J]. Int J Rehabil Res. 2019;42(4):358–64. [DOI] [PubMed] [Google Scholar]
- 52.Lee Y, Kim K. The influence of Gait Training Combined with Portable Functional Electrical Stimulation on motor function, balance and gait ability in stroke patients [J]. J Back Musculoskelet Rehabil. 2022;35(6):1171–8. [DOI] [PubMed] [Google Scholar]
- 53.Chung Y, Kim JH, Cha Y, et al. Therapeutic effect of functional electrical stimulation-triggered gait training corresponding gait cycle for stroke [J]. Gait Posture. 2014;40(3):471–5. [DOI] [PubMed] [Google Scholar]
- 54.Doucet BM, Lam A, Griffin L. Neuromuscular electrical stimulation for skeletal muscle function [J]. Yale J Biol Med. 2012;85(2):201–15. [PMC free article] [PubMed] [Google Scholar]
- 55.Olson CM, Rennie D, Cook D, et al. Publication bias in editorial decision making [J]. JAMA. 2002;287(21):2825–8. [DOI] [PubMed] [Google Scholar]
- 56.Lynch JR, Cunningham MR, Warme WJ, et al. Commercially funded and United States-based research is more likely to be published; good-quality studies with negative outcomes are not [J]. J Bone Joint Surg Am. 2007;89(5):1010–8. [DOI] [PubMed] [Google Scholar]
- 57.Fulk GD, Echternach JL, Nof L, et al. Clinometric properties of the six-minute walk test in individuals undergoing rehabilitation poststroke [J]. Physiother Theory Pract. 2008;24(3):195–204. [DOI] [PubMed] [Google Scholar]
- 58.Lindmark B, Hamrin E. Relation between gait speed, knee muscle torque and motor scores in post-stroke patients [J]. Scand J Caring Sci. 1995;9(4):195–202. [DOI] [PubMed] [Google Scholar]
- 59.Johnston TE, Keller S, Denzer-Weiler C, et al. A clinical practice Guideline for the Use of Ankle-Foot orthoses and Functional Electrical Stimulation Post-stroke [J]. J Neurol Phys Ther. 2021;45(2):112–96. [DOI] [PubMed] [Google Scholar]
- 60.Park HK, Jung J, Lee DW, et al. A wearable electromyography-controlled functional electrical stimulation system improves balance, gait function, and symmetry in older adults [J]. Technol Health Care. 2022;30(2):423–35. [DOI] [PubMed] [Google Scholar]
- 61.Kottink AI, Oostendorp LJ, Buurke JH, et al. The orthotic effect of functional electrical stimulation on the improvement of walking in stroke patients with a dropped foot: a systematic review [J]. Artif Organs. 2004;28(6):577–86. [DOI] [PubMed] [Google Scholar]
- 62.Jaqueline da Cunha M, Rech KD, Salazar AP, et al. Functional electrical stimulation of the peroneal nerve improves post-stroke gait speed when combined with physiotherapy. A systematic review and meta-analysis [J]. Ann Phys Rehabil Med. 2021;64(1):101388. [DOI] [PubMed] [Google Scholar]
- 63.Chen S, Zhang W, Wang D et al. How robot-assisted gait training affects gait ability, balance and kinematic parameters after stroke: a systematic review and meta-analysis [J]. Eur J Phys Rehabil Med. 2024. [DOI] [PMC free article] [PubMed]
- 64.Nolan KJ, Yarossi M, McLaughlin P. Changes in center of pressure displacement with the use of a foot drop stimulator in individuals with stroke [J]. Clin Biomech (Bristol Avon). 2015;30(7):755–61. [DOI] [PubMed] [Google Scholar]
- 65.Choi HS, Choi H, Kang S, et al. Change in Center of pressure progression in the Foot provides clues for functional improvement of the more affected Lower Limb during Post-stroke Gait Rehabilitation [J]. Am J Phys Med Rehabil. 2021;100(3):229–34. [DOI] [PubMed] [Google Scholar]
- 66.Agarwala P, Salzman SH. Six-Minute Walk Test: clinical role, technique, Coding, and reimbursement [J]. Chest. 2020;157(3):603–11. [DOI] [PMC free article] [PubMed] [Google Scholar]
- 67.Barss TS, Ainsley EN, Claveria-Gonzalez FC, et al. Utilizing Physiological Principles of Motor Unit Recruitment to Reduce Fatigability of electrically-evoked contractions: a narrative review [J]. Arch Phys Med Rehabil. 2018;99(4):779–91. [DOI] [PubMed] [Google Scholar]
- 68.Mesquita MB, Medeiros Dde C, Cota VR et al. Distinct temporal patterns of electrical stimulation influence neural recruitment during PTZ infusion: an fMRI study [J]. Prog Biophys Mol Biol. 2011;105(1–2):109 – 18. [DOI] [PubMed]
- 69.Lin RC, Chiang SL, Heitkemper MM, et al. Effectiveness of early Rehabilitation Combined with virtual reality training on muscle strength, Mood State, and functional status in patients with Acute Stroke: a randomized controlled trial [J]. Worldviews Evid Based Nurs. 2020;17(2):158–67. [DOI] [PubMed] [Google Scholar]
- 70.Wu WX, Zhou CY, Wang ZW, et al. Effect of Early and Intensive Rehabilitation after ischemic stroke on functional recovery of the Lower limbs: a pilot, Randomized Trial [J]. J Stroke Cerebrovasc Dis. 2020;29(5):104649. [DOI] [PubMed] [Google Scholar]
- 71.Day JT, Lichtwark GA, Cresswell AG. Tibialis anterior muscle fascicle dynamics adequately represent postural sway during standing balance [J]. J Appl Physiol (1985). 2013;115(12):1742–50. [DOI] [PubMed] [Google Scholar]
- 72.Di Giulio I, Maganaris CN, Baltzopoulos V, et al. The proprioceptive and agonist roles of gastrocnemius, soleus and tibialis anterior muscles in maintaining human upright posture [J]. J Physiol. 2009;587(Pt 10):2399–416. [DOI] [PMC free article] [PubMed] [Google Scholar]
- 73.Boyas S, Remaud A, Bisson EJ, et al. Impairment in postural control is greater when ankle plantarflexors and dorsiflexors are fatigued simultaneously than when fatigued separately [J]. Gait Posture. 2011;34(2):254–9. [DOI] [PubMed] [Google Scholar]
- 74.Trimble MH, Enoka RM. Mechanisms underlying the training effects associated with neuromuscular electrical stimulation [J]. Phys Ther. 1991;71(4):273 – 80; discussion 80 – 2. [DOI] [PubMed]
- 75.Guillot X, Tordi N, Mourot L, et al. Cryotherapy in inflammatory rheumatic diseases: a systematic review [J]. Expert Rev Clin Immunol. 2014;10(2):281–94. [DOI] [PubMed] [Google Scholar]
Associated Data
This section collects any data citations, data availability statements, or supplementary materials included in this article.
Supplementary Materials
Data Availability Statement
No datasets were generated or analysed during the current study.


