Abstract
Tumor metastasis is a continuous and dynamic process and is a major cause of tumor-related death in triple-negative breast cancer. However, this biological process remains largely unknown in triple-negative breast cancer. The emergence of single-cell sequencing enables a deeper understanding of the tumor microenvironment and provides a new strategy for discovering the potential mechanism of tumor metastasis. Herein, we integrated the single-cell expression profiling of primary and metastatic triple-negative breast cancer by Seurat package. Nine tumor cell subgroups were identified. Enrichment analysis suggested tumor subgroups (C0, C4) were associated with tumor metastasis with poor prognosis in TNBC. Weighted gene co-expression network was constructed and identified NENF was a metastasis-related gene. Subsequently, RT-qPCR, Immunohistochemistry, and western blot confirmed NENF is highly expressed in TNBC tissues. And cell function assays indicated NENF promote cell invasion and migration through regulating EMT in TNBC. Finally, TIDE and Connectivity Map database suggest the candidate drugs for targeting NENF. In conclusion, our findings provide a new insight into the progression and metastasis of TNBC and uncover NENF may be a prognostic biomarker and potential therapy targets.
Supplementary Information
The online version contains supplementary material available at 10.1186/s12935-024-03505-z.
Introduction
Breast cancer is one of the most commonly diagnosed cancer and the second leading cause of cancer-related death in women, with the incidence of breast cancer increasing in recent years [1, 2]. Triple-negative breast cancer (TNBC) is defined as a type of breast cancer with negative expression of estrogen (ER), progesterone (PR) and human epidermal growth factor receptor-2 (HER-2) [3]. Compared to other types of breast cancer, TNBCs have more invasive biological behaviors and poor prognosis. Moreover, TNBCs are provided with the features of occurring earlier metastasis, mainly involving visceral organs, including the lungs, liver, and brain [4]. Therefore, further research into the metastasis and development mechanisms of TNBC is urgently needed.
Neuron derived neurotrophic factor (NENF) is initially identified as a secreted protein of 172 amino acids with neurotrophic activity, also known as GIG47 or neudesin [5]. Since NENF presents a cytochrome 5-like heme/steroid binding domain of ~ 100 amino acids, it is classified as a member of the membrane-associated progesterone receptor family [6]. NENF has been confirmed to play a crucial part in maintaining the hippocampal anxiety circuitry and can inhibit adipogenesis [7, 8]. In addition, it has also been demonstrated that NENF is overexpressed in several human cancers and induces tumorigenesis [9]. However, the mechanism of action of NENF in TNBC remains unclear.
Tumor metastasis is a dynamic and complex process, which involves the enhanced invasiveness of primary tumor cells, the formation of metastasis-promoting microenvironment by immune cells and stromal cells [10, 11]. Therefore, investigating tumor metastasis from the perspective of tumor microenvironment can reveal and understand this process more deeply. Conventional transcriptome sequencing measures expression levels in tissues and does not reflect the expression profile of individual cells. With the development of sequencing technology, the emergence of single-cell RNA sequencing has improved this dilemma [12] and provided a larger number of novel ideas for the treatment of breast cancer [13, 14]. New single-cell sequencing algorithms, such as monocle analysis, can infer cell lineage evolution based on expression profiles, providing a new theoretical basis for explaining the occurrence, evolution and metastasis of tumors [15].
Herein, we comprehensively investigated the tumor microenvironment heterogeneity between primary and metastatic TNBC through single-cell sequencing (scRNA-seq). We identified the tumor cell subgroups with high level of NENF in TNBC, which was closely associated with tumor metastasis. In vitro experiments confirmed the pro-metastasis effect of NFNF. Our study revealed the potential mechanism of TNBC metastasis, and provided a candidate therapy target for TNBC.
Materials and methods
Data collection and processing
A total of 552 samples were enrolled in this study: 4 scRNA-seq samples (3 primary samples and 1 metastatic sample of TNBC) from the Gene Expression Omnibus (GEO) cohort (GSE199515 and GSE143423); 123 RNA-seq data of primary (n = 44) and metastatic (n = 79) breast cancer samples from GSE209998; 319 RNA-seq data of TNBC samples from METABRIC dataset; 229 RNA-seq data (113 normal and 116 TNBC samples) from TCGA-BRCA cohort. The TCGAbiolinks package was used to obtain the gene expression profiles of BRCA cohort. The data were transformed to TPM format and standardized with log2.
The “Seurat” R package (v4.3.0) was used to implement quality control procedures and associated bioinformatics analyses on the scRNA-seq datasets. The detailed criteria were used to remove the low-quality cells: genes detected per cell ≥ 200; 500 ≤ UMIs ≤ 7000; the proportion of mitochondrial genes counts ≤ 20%. The method of removing potential doublet was conducted as previously described [12]. The “Harmony” R package was conducted to remove the batch effect. The methods of standardization, dimensionality reduction and resolution selection were performed as previously described [12]. Moreover, the markers used for cell identity were obtained from CellMarker database [16].
CNV and Single‑cell downstream analysis
The breast cell expression matrix of three primary TNBC samples (TNBC1, TNBC2, and TNBC3) were extracted from the scRNA-seq datasets mentioned above. The “inferCNV” R package was used to perform copy number variation (CNV) analysis and identify malignant breast epithelial cells. Malignant cells were defined as CNV correlation > 0.4 and CNV score > 0.001.
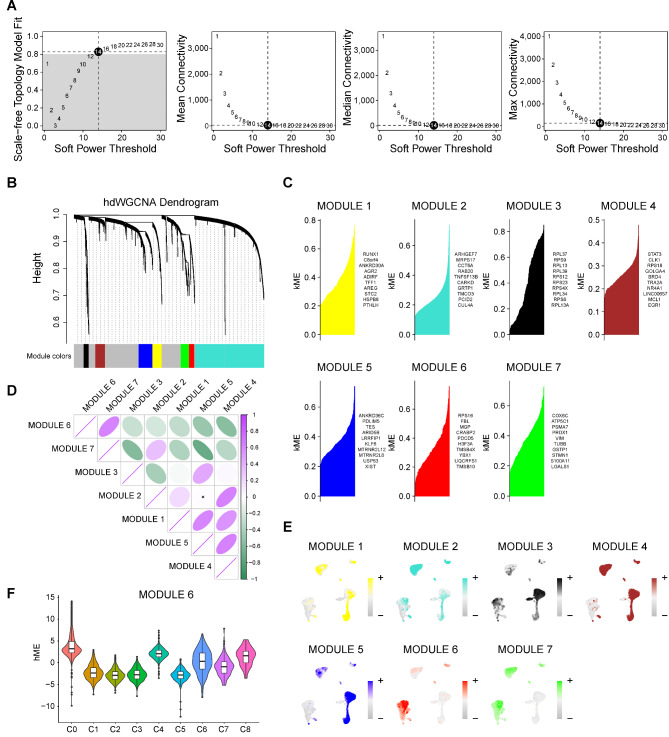
The “Monocle” R package (v2.26.0) was conducted to perform the differentiation trajectory analysis for malignant breast cells [17]. In detail, the single cell RNA profiles of malignant breast cells were converted into Monocle format using newCellDataSet function, and the data were normalized and filtered using the estimateSizeFactors function and detectGenes function. The DDRtree was used as the dimensionality reduction method, with a maximum dimension set to 2. Subsequently, the “GSVA” and “clusterprofiler” R packages were used to analyze the hallmark pathway activity containing tumor subpopulation cells. CIBERSORTX was used to estimate the ratio of different types of cells in METABRIC patients with default setting (https://cibersortx.stanford.edu/). Specificly, 50 cells in each cell group were extracted for constructing single cell reference matrix. Then, the survival outcomes of distinct cell types were evaluated by “survminer” R package. The “hdwgcna” R package was used to analyze co-expressed gene modules in tumor subpopulation cells. Concretely, based on the variation in single cell RNA profiles of all malignant breast cells, 14 was selected as the soft threshold and divided into 7 different modules.
Breast cancer specimens
All diagnoses of samples were confirmed histologically which were collected at Tianjin Medical University Cancer Institute and Hospital. This study was sanctioned by the Ethical Committee of Tianjin Medical University Cancer Institute and Hospital and was consistent with the ethical guidelines of the Helsinki Declaration. Informed and written consent was acquired from all involved patients.
Cell cultures and transfection
Breast cancer cell lines MCF-7, MDA-MB-231, T47D, CAL-51 and SUM159 were all derived from the General Surgery Laboratory of Tianjin Medical University General Hospital. MCF-7, MDA-MB-231, T47D and CAL-51 were cultured in 1640 (Gibco, USA). SUM159 was cultured in DMEM (Gibco, USA). All medium included 10% fetal bovine serum (FBS, NEWZERUM, Australia) and 1% penicillin/streptomycin (Gibco, USA). The cells were kept at 37 °C in a humidified 5% CO2 atmosphere cell incubator. The siRNAs of NENF constructs were synthesized by RiboBio (Guangzhou, China) and oligonucleotides were listed in Supplementary File: Table S1. The protocol of cell transfection was conducted as previous described [18].
Western blot and antibodies
Cells were lysed by RIPA buffer supplemented with phosphorylase inhibitor and protease inhibitor mixture (Invitorgen, USA). The lysed samples (20 µl) were applied to SDS-PAGE for protein separation and then transferred to the PVDF membrane, moreover a 1:1000 dilution of primary antibodies was incubated on the membrane. The target proteins were immunoblotted with corresponding antibodies and ECL reagent (Millipore, Bedford, MA, USA) was used to visualize.
Antibodies against E-cadherin (ID: 07-697, Cell Signaling Technology, USA), N-cadherin (ID: 13116T, Cell Signaling Technology, USA), NENF (ID: 60131-1-lg), Vimentin (ID: YT4880), Snail (ID: 13099-1-AP) and GAPDH (ID: 60004-1-Ig, Proteintech, China) were used.
Immunohistochemistry (IHC) and cell function assays
The tissue specimen through deparaffinization and hydration were incubated with the primary antibody overnight at 4 °C after antigen retrieval, endogenous peroxidase removal and serum blocking. The sections were next incubated with secondary antibody, followed by signal detection with DAB staining kit (ZSGB-BIO, China). The standard score for the extent of staining was conducted as previous described [19, 20]. Transwell invasion assays (coated with Matrigel), transwell assays (Matrigel-free) and wound healing assays were performed to assess cell invasion and migration. All experiments were performed as previously described [19–21].
Reverse transcription-quantitative PCR (RT‒qPCR) analysis
Total RNA was extracted by Trizol according to the instruction (Invitrogen, USA), and was reverse transcribed using a reverse transcription kit (TaKaRa, Japan). 2 µl cDNA was mixed with the primers and SYBR Green PCR Master Mix (TaKaRa, Japan) for RT-qPCR reaction. The NENF and GAPDH primers were synthesized by Genewiz (Tianjin, China). All specific sequences are listed in Supplementary File: Table S2.
Statistics and analysis
All data are presented as the mean ± standard deviation (SD) for at least three repeated individual experiments for each group. Quantitative results were analyzed by two-tailed Student’s t test. Prism 8 (Graph pad Software, CA) was utilized for data visualization and analysis. p < 0.05 was considered statistically significant.
Results
Different cell types in TNBC were identified by single-cell sequencing
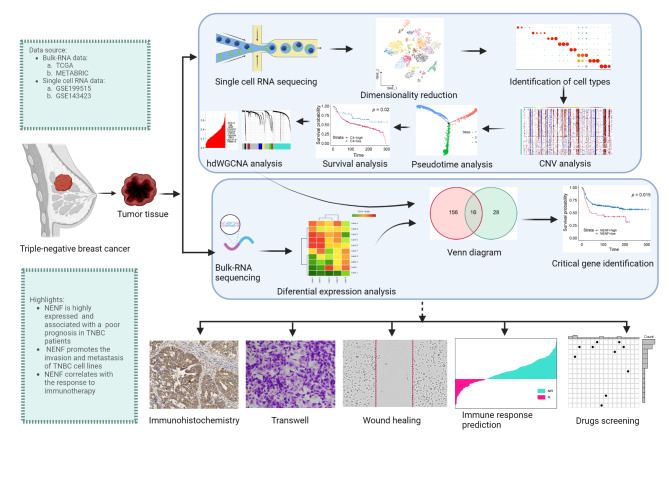
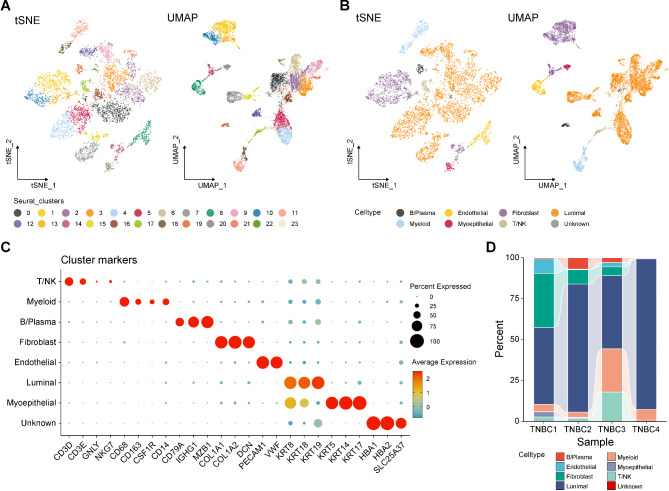
The overall flow chart of our study is illustrated in Fig. 1. In this study, a total of 11,811 cells were derived in the quality control procedures using Seurat, including 8566 cells from primary TNBC samples (TNBC1, TNBC2, TNBC3) and 3245 cells from brain metastasis TNBC sample (TNBC4). All cells in the scRNA-seq datasets were clustered into 24 different cell clusters through PCA, and the resolution was set to 0.8. The high-quality cells were visualized using graph-based dimensionality reduction. As shown in Fig. 2A, different cell clusters were significantly distinguished in space. Then, we annotated all cells and distinguished eight different cell types, including B/plasma cells, endothelial cells, fibroblasts cells, luminal cells, myeloid cells, myoepithelial cells, T/NK cells, and unknown (Fig. 2B). The cell markers utilized were sourced from the Cell Marker database (Fig. 2C). These analyses could sufficiently discern the different cell types, for example, KRT8, KRT18, and KRT19 were markers of luminal cells, and thirteen cell clusters (0, 2, 3, 4, 5, 6, 7, 9, 12, 15, 16, 21, and 22) were identified as luminal cells. As shown in Fig. 2D, we described the proportion of the aforementioned eight cell types in inclusive TNBC samples. In summary, we successfully identified eight principal cell types for further exploration.
Fig. 1.
Schematic design of the study. GSE, Gene Expression Omnibus series; TNBC, triple-negative breast cancer; TCGA, The Cancer Genome Atlas; NENF, Neuron derived neurotrophic factor
Fig. 2.
Different cell types in TNBC were identified by single-cell sequencing. A tSNE and UMAP scatter plots displayed 24 different cell clusters in TNBC samples. B tSNE and UMAP scatter plots displayed 8 different cell types in TNBC samples. C Dot plots showed expression levels of marker genes used to note 8 different cell types. D The proportion of 8 different cell types in TNBC samples
Malignant cells in TNBC were identified by inferCNV analysis
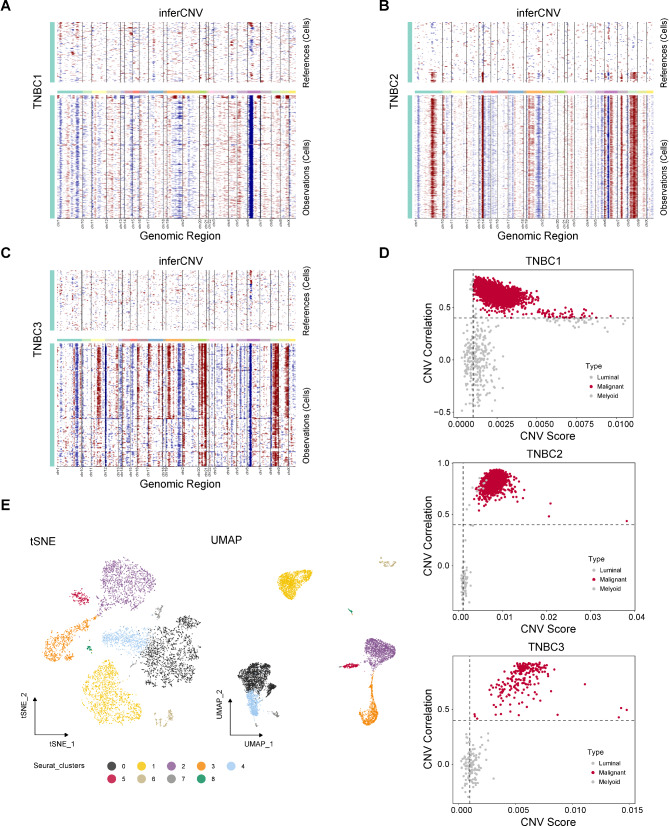
It is obviously difficult to distinguish between benign and malignant epithelial cells at the single cell level through inherent cell markers. Therefore, we used inferCNV to assist in the identification of malignant cells. We first used the CNVs of myeloid cells as a reference to infer the CNVs of luminal cells. As shown in Fig. 3A-C, there was significant amplification or deletion of CNVs in luminal cells in TNBC1, TNBC2 and TNBC3 samples. Then, we accurately isolated malignant luminal cells through CNV correlation and CNV score. As demonstrated in Fig. 3D, malignant cells, defined by inferCNV, exhibited high heterogeneity in gene expression, which was significantly distinguished from control myeloid cells and normal luminal cells. Luminal cells in TNBC4 derived from metastatic sample were considered malignant tumor cells. Furthermore, 53 normal luminal cells were removed and a total of 7629 confident malignant cells were identified. All malignant luminal cells were performed further dimensionality reduction and clustering with the resolution at 0.2, identifying a total of nine different clusters of malignant cells (Fig. 3E). Taken together, the malignant cells were successfully identified for further exploration.
Fig. 3.
Malignant cells in TNBC were identified by inferCNV analysis. Chromosomal landscape of inferred CNVs among luminal cells in TNBC1 (A), TNBC2 (B), and TNBC3 (C). D Scatter plot showed the CNV correlation and CNV score of TNBC luminal cells in TNBC1, TNBC2, and TNBC3. E tSNE and UMAP scatter plots displayed 9 different clusters in TNBC luminal cells
Cell trajectory and characteristics of various clusters of TNBC tumor cells
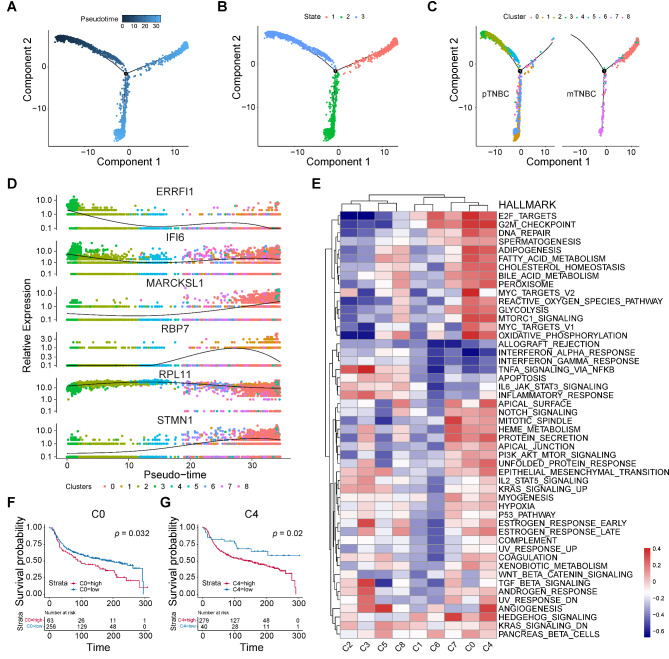
The tendency for metastasis is a characteristic of TNBC, the gene expression patterns during tumor metastasis exhibit temporal heterogeneity. Therefore, thoroughly explore the evolutionary trajectory of TNBC from the primary cells to the metastatic cells will contribute to understand potential biological processes preferably. Trajectory analysis performed for malignant cells uncovered the three states and three branches in the cell trajectory (Fig. 4A-B). Malignant cells of state 3 were presented at the beginning of the trajectory. As shown in Fig. 4C, cell clusters including cluster 2, 3, and 5 evolved to cluster 0, 1, 4, 6, 7, and 8. To further investigate the heterogeneity of malignant cells, we scored each cluster by using Hallmark gene sets. Accompanied by evolutionary trajectories, the expression of MARCKSL1, RBP7, and STMN1 gradually increased, IFI6 and RPL11 displayed as continuous expression. Conversely, the expression of ERRFI1, the crucial negative regulator of EGFR, was significantly decreased during (Fig. 4D). As shown in Fig. 4E, the canonical tumor malignant phenotype related signaling pathways, such as EMT, E2F targets, NOTCH signaling, PI3K/AKT/mTOR signaling were significantly enriched in cluster 0, 4, and 7. The analysis results indicated that the three clusters mentioned above possibly exhibit stronger levels of malignancy. In addition, to identify clusters with poor prognosis for TNBC, we used CIBERSOFTX to infer the abundance of TNBC patients in various clusters in the METABRIC dataset, and combined the cumulative overall survival (OS) information to perform survival analysis on different clusters. Interestingly, the results showed that only the cluster 0, and 4 showed significant correlation with poor prognosis in TNBC patients (Fig. 4F-G), while cluster 7 presented a significant association with favorable prognosis (Supplementary Figure S1A). The prognostic values of the other clusters were illustrated in Supplementary Figure S1B-G. In brief, cluster 0, and 4 displayed distinct malignant features of tumors and were significantly associated with poor prognosis in TNBC patients. These findings revealed a high degree of heterogeneity among different clusters of TNBC and the dynamic evolution process from primary TNBC cells to metastatic TNBC cells.
Fig. 4.
Cell trajectory and characteristics of various clusters of TNBC tumor cells. The trajectory of primary TNBC cells evolved into metastasis TNBC cells were revealed by monocle analysis, visualized by pseudo-time (A), distribution of three cell states (B), and distribution of 9 clusters (C). D 6 most relevant genes were identified in the evolutionary process. E The hallmark pathway enrichment score of different tumor subpopulation cells were illustrated by heat map. The OS of TNBC patients with different abundant levels of C0 (F) and C4 (G) cluster, depicted by KM curves
Identification of gene co-expression modules among TNBC cells
As cluster 0 and 4 were closely correlated with poor prognosis in TNBC, it was necessary to explore the co expressed gene networks that exert important roles in these two subgroups. The scale-free network of cluster 0, and 4 were constructed for the best connectivity with soft threshold set at 14 (Fig. 5A-B). Finally, seven modules were identified with representative top 10 genes (Fig. 5C&E). As shown in Fig. 5D, module 6 and 7 were observed a certain extent of correlation, while other modules constituted another relevant group. On the other hand, the enrichment score of modules 6 was more concentrated in cluster 0 and 4 than that of module 7, and was nearly not enriched in other clusters. (Figures 3E and 5E). Consistently, harmonization module characteristic genes (hME) of module 6 was significantly increased in cluster 0 and 4 (Fig. 5F). In a word, these findings implied that genes of module 6 were co-expressed network of cluster 0 and 4, which could promote TNBC metastasis.
Fig. 5.
Identification of gene co-expression modules among TNBC cells. A Weighed gene co-expression network analysis was constructed among malignant cells. B The hdWGCNA dendrogram of 7 modules. C The first 10 eigengenes of each module, ranked by eigengene-based connectivity. D The correlation among 7 modules illustrated by heat map. E UMAP scatter plots displayed the expression of module 1–7 among all malignant cells. F The module 6 score in 9 different clusters
Fig. 6.
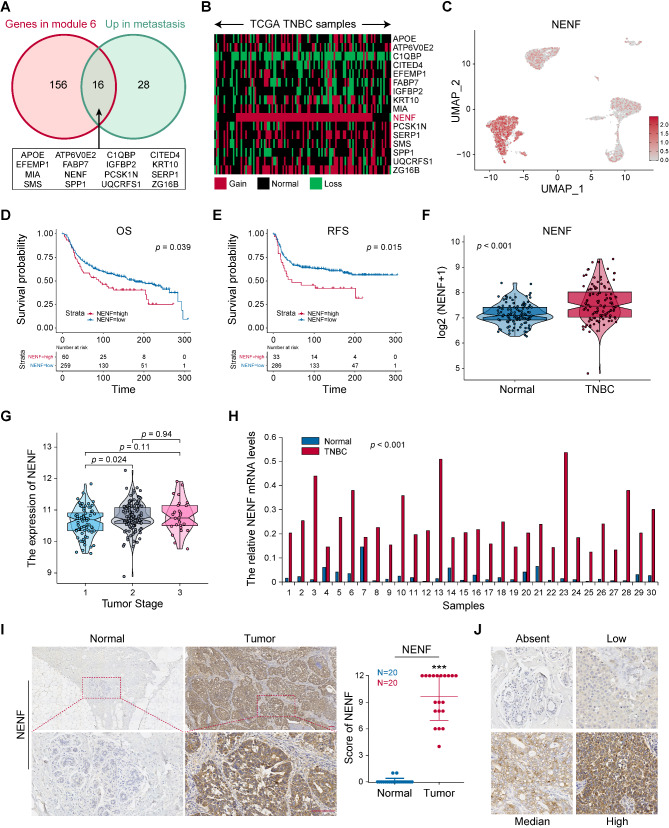
NENF was identified metastasis related gene and upregulated in TNBC. A The intersection of genes in module 6 and upregulated genes in metastatic TNBC cells showed by Venn diagram. B The copy number changes of candidate genes in TCGA-TNBC were displayed by heat map. C tSNE scatter plots displayed the expression of NENF in TNBC malignant cells. The survival analysis of TNBC patients with high‑ or low‑NENF expression levels, including OS (D) and RFS (E), depicted by KM curves. F The NENF expression level in normal tissues and TNBC tissues. G The NENF expression level among TNBC stages. H The mRNA expression level of NENF in 30 paired TNBC tissues detected by RT-qPCR. I The protein expression level of NENF in 20 paired TNBC were detected by IHC and the scores of IHC staining. J The standard score of IHC staining. **p < 0.01, ***p < 0.001
NENF was identified metastasis related gene and upregulated in TNBC
To explore the essential genes driving tumor metastasis, we conducted differential analysis of expression profiles between metastatic and primary tumor cells, and identified 44 genes upregulated in metastatic tumor cells (Supplementary File Table S3). Then, we took the intersection of this gene set and module 6 gene set (Supplementary File Table S4). Totally, 16 genes were identified as candidate genes, including APOE, ATP6VOE2, C1QBP, CITED4, EFEMP1, FABP7, IGFBP2, KRT10, MIA, NENF, PCSK1N, SERP1, SMS, SPP1, UQCRFS1 and ZG16B (Fig. 6A). To investigate transcriptional levels of 16 candidate genes, we detected the copy-number variation of these candidate genes in the TCGA-TNBC dataset. In TCGA-TNBC specimens, NENF was the most significantly amplified candidate gene (88/114, 77.2%) (Fig. 6B). Consistent with Fig. 2E, NENF was mainly expressed in clusters 0, 4, and 7 (Fig. 6C). And NENF was highly expressed in metastatic TNBC at both single-cell and tissue level (supplementary Figure S2A-B). As predicted by METABRIC dataset, higher NENF expression level was associated with poorer prognosis of TNBC, both OS (Fig. 6D) and recurrence-free survival (RFS) (Fig. 6E). Moreover, NENF had observed higher expression in TNBC tissues and associated with advanced stages (Fig. 6F-G). RT-qPCR was used to detect NENF mRNA levels in 30 TNBC tissues and paired adjacent normal tissues, the analysis results show that the expression of NENF was remarkably increased in TNBC specimens (Fig. 6H). In addition, 20 TNBC tissues and paired adjacent normal tissues were collected to examine NENF expression by IHC staining. Comparing to the normal tissues, the expression of NENF in TNBC tissues was significantly up-regulated (Fig. 6I). Furthermore, the standard stain score of IHC is established as Fig. 6J. Taken together, these findings showed that high expression of NENF was associated with TNBC metastasis and poor patient prognosis, and it was upregulated in tumor tissues.
Fig. 7.
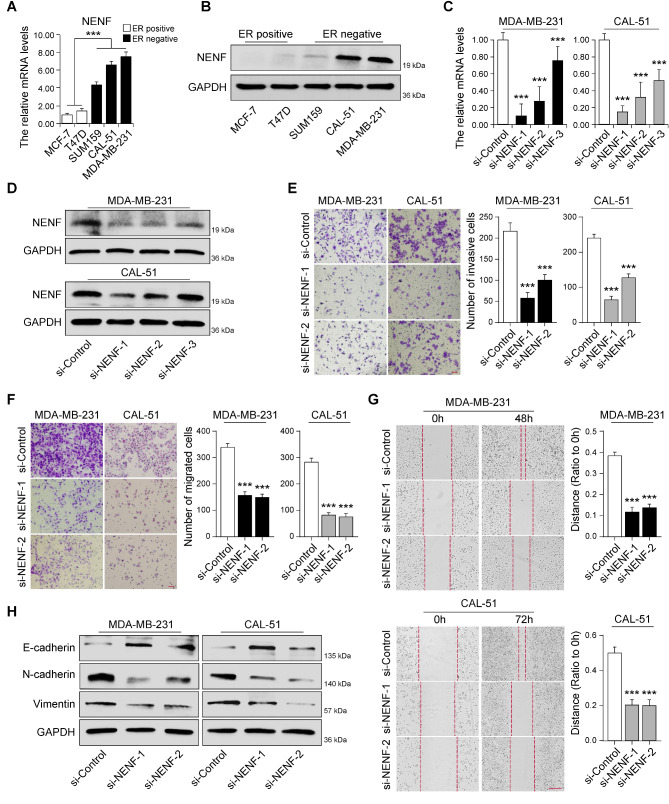
NENF was required for cell invasion and migration through regulating EMT in TNBC. The mRNA and protein expression levels of NENF in breast cancer cell lines detected by RT‑qPCR (A) and western blot (B). RT‑qPCR (C) and western blot (D) analysis of NENF expression levels in MDA-MB-231-siNENF cells and CAL-51-siNENF cells compared with siControl cells, respectively. E Cell invasion in cells as in D were detected by Matrigel coated transwell analysis, respectively. F Cell migration in cells as in D were detected by Matrigel non-coated transwell (F) and wound healing (G) analysis, respectively. H The protein expression levels of EMT‑related markers in cells as in D were detected by western blot, respectively. ***p < 0.001
NENF was required for cell invasion and migration through regulating EMT in TNBC
To investigate the role of NENF in TNBC progression, RT-qPCR and western blot were conducted to analyze the mRNA and protein levels of NENF in breast cancer cells line (MCF-7, T47D, SUM159, CAL-51 and MDA-MB-231). The results showed a significant discrepancy in the expression of NENF between hormone receptor positive (HR+) and triple-negative breast cancer cell lines. Obviously, the expression of NENF was significantly higher in triple-negative breast cancer subtype (SUM159, CAL-51 and MDA-MB-231), compared with HR + breast cancer subtypes (MCF-7 and T47D) (Fig. 7A-B). Then, we examine the effect of NENF deficiency on the breast cancer cell invasion and migration by using three specific siRNAs targeting NENF, and found two of siRNAs could efficiently reduce the mRNA and protein expression of NENF in CAL-51 and MDA-MB-231 cells (Fig. 7C-D). By Matrigel coated transwell assay, we found that depletion of NENF resulted in a substantial decrease in the rate of cell invasion (Fig. 7E). Meanwhile, depletion of NENF could reduce cell migration in the Matrigel non-coated transwell (Fig. 7F) and cell wound healing assays (Fig. 7G). Epithelial to mesenchymal transition (EMT) process is crucial for tumor metastasis, which serves as a driving factor for tumor cell invasion and migration [22, 23]. To investigated the effect of NENF expression in breast cancer EMT, western blot was used to detect the expression of epithelial and mesenchymal markers. Compared to control cells, the expression of E-cadherin (epithelial marker) was dramatically elevated, while decreasing the N-cadherin and Vimentin expression (mesenchymal marker) in NENF-depleted CAL-51 and MDA-MB-231 cells, demonstrating that NENF was positively correlated with EMT (Fig. 7H). In brief, these results indicated that depletion of NENF reduced cell invasion and migration through regulating EMT in TNBC.
Individualized therapy for TNBC patients based on NENF
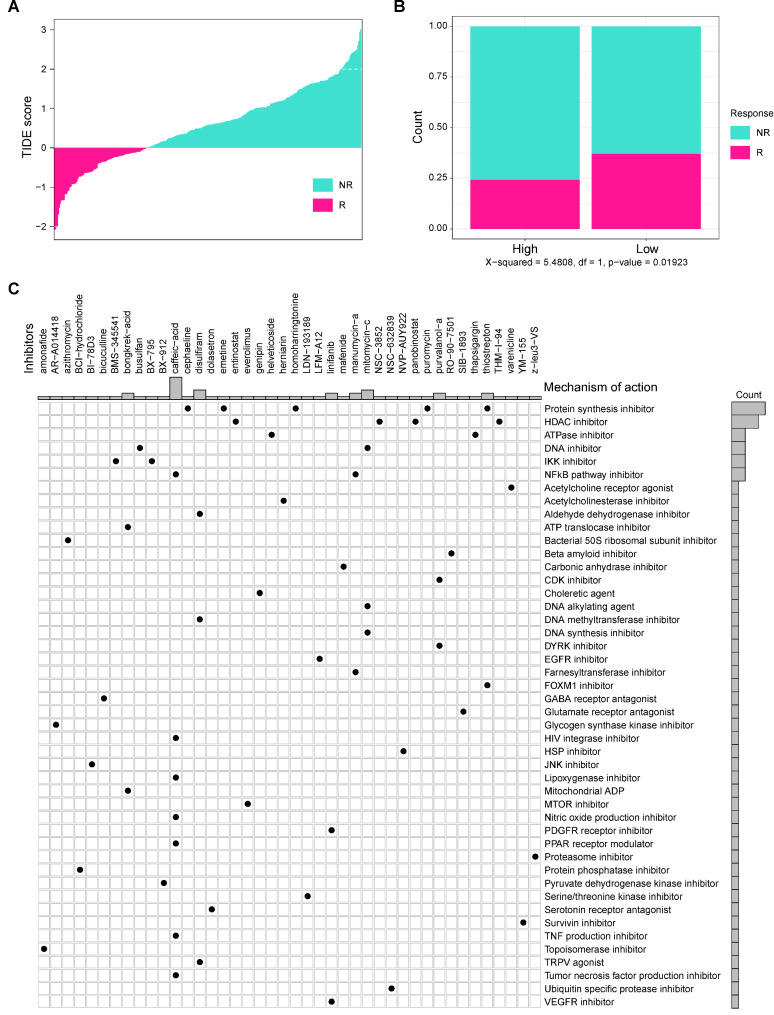
Presently, the treatment of TNBC is still limited. Therefore, it is urgent to develop novel and effective therapeutic targets for TNBC. In this study, we normalized the gene matrix of METABRIC dataset for predicting the immune response to immune checkpoints on TIDE database (http://tide.dfci.harvard.edu/). As shown in Fig. 8A-B, low TIDE scores indicate strong response to immune checkpoint (ICI) therapy, and patients with NENF high expression exhibited weak response to ICI therapy. These results indicated that NENF probably be a promising predictor for ICI treatment. In addition, we sifted potential therapeutic drugs targeting high expression of NENF by online database (https://clue.io/, Supplementary File Table S5). Figure 8C revealed 46 molecular pathways targeted by 42 compounds in high NENF group. According to the most important mechanism of action for the high NENF group, including protein synthesis inhibitor, HDAC inhibitor, and ATPase inhibitor. These inhibitors had been conformed to effective for cancers [24–26]. In conclusion, our findings provide novel strategy for TNBC immunotherapy and individual treatment.
Fig. 8.
Individualized therapy for TNBC patients based on NENF A The correlation between TIDE score and immune response status. B The correlation between different NENF group and immune response status. C The potential drugs identified for high-NENF patients
Discussion
TNBC exhibits an earlier tendency to metastasis, which is the one of the main reasons for the poorer prognosis compared to other subtypes of breast cancer [27–29]. Tumor microenvironment is tumor-dependent soil for unremitting proliferation, metastasis, and invasion [30]. Therefore, Characterizing the heterogeneity of TNBC tumor microenvironment is important for understanding the biological processes of TNBC progression and metastasis. To the best of our knowledge, this is the first report to reveal the role of NENF in promoting tumor metastasis in breast cancer.
Traditional transcriptome has been a canonical method to identify the prognostic biomarkers and anti-cancer targets before the emergence of single-cell RNA sequencing. Since the expression profile of individual cells cannot be recognized, it is difficult for Bulk-RNA seq to probe into the tumor microenvironment at the cellular level. Therefore, we analyzed the scRNA-seq TNBC samples for exploration of the heterogeneity of TNBC tumor subgroups, especially between primary and metastatic TNBC. In this study, we identified 9 high heterogeneous tumor subgroups of TNBC cells after a series of strict procedures. Cluster 2, 3, and 5 were at the beginning of trajectory, showing the similar biological function including TNFA signaling, angiogenesis, and inflammatory response (Fig. 4C&E). While cluster 0, 4, 7 were at the end of trajectory, with high enrichment of Notch signaling, and PI3K/AKT signaling, E2F target, and G2M checkpoint pathways. Of note, NOTCH signaling and PI3K/AKT signaling pathways were confirmed to be associated with tumor metastasis [31, 32]. Also, E2F target and G2M checkpoint pathways were essential for tumor proliferation [33, 34]. These results revealed that the immunoreactivity of TNBC tumor cells decreased from primary to metastasis while the tumor proliferation and metastasis ability increased. Furthermore, the expression of MARCKSL1 and STMN1 were increased steadily during the dynamic lineage evolution (Fig. 4D). Jonsdottir et al. [35] found that the protein level of MARCKSL1 was a strong prognostic predictor for lymph node-negative breast cancer (Hazard Ratio = 5.1, P < 0.001). Kuang et al. [36] reported phosphorylation of STMN1 at Ser25 and Ser38 is necessary to maintain cell migration capabilities and is associated with shorter disease-free survival (DFS) in breast cancer. Consistently, these studies supported our findings. We also performed the survival analysis confirmed the prognostic value of cluster 0, 4. Although further experiments need to be confirmed the prognostic value and biological function of these subgroups, these results provided a novel strategy for targeting TME to improve TNBC patient prognosis.
To investigate critical genes which promote the tumor metastasis in TNBC, weighted gene co-expression network analysis and differential gene analysis were performed and identified several genes as candidate genes. Interestingly, NENF exhibited more malignant characteristics compared to other genes. For instance, the amplification rate of NENF were markedly higher (Fig. 6B). Meanwhile, the expression of NENF was closely associated with advanced stage, poor OS and RFS (Fig. 6D-E&G). These findings suggested NENF may facilitate the progression of TNBC. Consistently, our experiments confirmed NENF was upregulated in breast cancer tissues (Fig. 6H-I), especially in TNBC cell lines (Fig. 7A-B). Knockdown of NENF reduced the cell invasion and migration with the protein level of EMT markers downregulated. In summary, these results strongly supported the role of NENF in promoting tumor metastasis. In fact, NENF has been discovered for biomarker in multiple tumors [37, 38]. Wang et al. found NENF could be used as one of prognostic biomarkers for risk stratification in multiple myeloma [39]. Also, Lenkiewicz et al. [37] revealed that NENF concentration was an effective diagnostic predictor for primary brain tumor patients. Stefanska et al. [38] reported that NENF drove cancer growth and metastasis through AKT, WNT, and MAPK signaling pathways. All in all, NENF may be a promising biomarker for cancer diagnosis and therapy. Unlike our study that focused on tumor metastasis, a previous study [40] has found that NENF involved in breast cancer tumorigenesis via MAPK and PI3K pathways, indicating NENF might play an essential role during breast cancer tumorigenesis and development.
Due to the high heterogeneity of triple-negative breast cancer, the benefit rate of patients receiving immunotherapy is unsatisfactory [41], so it is necessary to further explore the feasibility of NENF as a potential immune indicator. Our results showed patients with high expression of NENF exhibited a lower immune response, indicating it could be a potential predictor for immunotherapy. Additionally, several drugs were predicted based on the gene list of NENF gene perturbation, which enhances the accuracy of drug predictions. Although further study needs to be conducted to validate their efficiency, previous studies has confirmed their potential for cancer treatment. For example, disulfiram, a Food and Drug Administration-approved drug, has been proven to have a strong anti-tumor effect in tumors [42–44]. Linifanib, is a novel tyrosine-kinase inhibitor (TKI) inhibitor and its anti-angiogenic activity has been explored in numerous clinical trials [45]. In a word, these potential drugs were identified for high-NENF patients in TNBC, and these findings provided a novel idea for the individualized therapy of TNBC.
Evidently, bioinformatics analysis and preliminary experiments are only the prologue to our research, and biomarkers are significant only when they were validated in clinic. Our study identified the tumor subgroups highly expressed NENF were associated with tumor metastasis, and preliminarily confirmed the prognosis role and biological function of NENF. However, some limitations still need to be improved for further study. For example, the prognostic value of tumor subgroup requires verification by collecting clinical samples to further confirm its translational potential. In addition, the molecular mechanism of NENF on tumor metastasis should be deeply explored. Meanwhile, the sample size of single-cell analysis was insufficient. Although the batch effect between samples has been removed by the algorithm, more samples should be included to reduce the impact of individual differences on the results.
In summary, our study reveals the tumor cell heterogeneity in the primary and metastatic microenvironment of triple-negative breast cancer, and provides a new insight into the progression and metastasis of TNBC. Notably, we discovered a tumor subgroup related to tumor metastasis with high expression of NENF. And NENF may become a promising therapy target for TNBC.
Electronic supplementary material
Below is the link to the electronic supplementary material.
Acknowledgements
Figure 1 was created with BioRender.com (Agreement number: JJ271O8QDY).
Author contributions
WX, TY, and WGX: conception and design. SCC, LYX, and HL: writing, review, and/or revision of the manuscript. SWB, CZH, LZY, WYZ, HXH, and YY: administrative, technical, and material support. All the authors approved the final version of the manuscript.
Funding
This work was supported by National Natural Science Foundation of China (Grant Nos. 82303857, 82304025 and 82172835).
Data availability
Datasets related to this article are from public database (GSE199515 and GSE143423), TCGA database (https://portal.gdc.cancer.gov/), and METABRIC database (https://www.cbioportal.org/study/summary?id=brca_metabric). All data generated or analyzed during this study are included in this article/Additional files
Declarations
Ethics approval and consent to participate
The design of this study was approved by Ethical Committee of Tianjin Medical University Cancer Institute and Hospital and was consistent with the ethical guidelines of the Helsinki Declaration. Informed and written consent was acquired from all involved patients.
Consent for publication
All co-authors have consented the version of manuscript for publication.
Competing interests
The authors declare no competing interests.
Footnotes
Publisher’s note
Springer Nature remains neutral with regard to jurisdictional claims in published maps and institutional affiliations.
Guixin Wang, Cangchang Shi and Long He contributed equally to this work.
Contributor Information
Yao Tian, Email: tianyao@tmu.edu.cn.
Xin Wang, Email: wangxin@tjmuch.com.
References
- 1.Siegel RL, Giaquinto AN, Jemal A. Cancer statistics, 2024. CA Cancer J Clin. 2024;74:12–49. 10.3322/caac.21820. [DOI] [PubMed] [Google Scholar]
- 2.Sung H, et al. Global Cancer statistics 2020: GLOBOCAN estimates of incidence and Mortality Worldwide for 36 cancers in 185 countries. CA Cancer J Clin. 2021;71:209–49. 10.3322/caac.21660. [DOI] [PubMed] [Google Scholar]
- 3.Wolff AC, et al. Recommendations for human epidermal growth factor receptor 2 testing in breast cancer: American Society of Clinical Oncology/College of American Pathologists clinical practice guideline update. Arch Pathol Lab Med. 2014;138:241–56. 10.5858/arpa.2013-0953-SA. [DOI] [PMC free article] [PubMed] [Google Scholar]
- 4.Foulkes WD, Smith IE, Reis-Filho JS. Triple-negative breast cancer. N Engl J Med. 2010;363:1938–48. 10.1056/NEJMra1001389. [DOI] [PubMed] [Google Scholar]
- 5.Kimura I, Yoshioka M, Konishi M, Miyake A, Itoh N. Neudesin, a novel secreted protein with a unique primary structure and neurotrophic activity. J Neurosci Res. 2005;79:287–94. 10.1002/jnr.20356. [DOI] [PubMed] [Google Scholar]
- 6.Kimura I, et al. Neurotrophic activity of neudesin, a novel extracellular heme-binding protein, is dependent on the binding of heme to its cytochrome b5-like heme/steroid-binding domain. J Biol Chem. 2008;283:4323–31. 10.1074/jbc.M706679200. [DOI] [PubMed] [Google Scholar]
- 7.Kimura I, et al. Neudesin, an extracellular heme-binding protein, suppresses adipogenesis in 3T3-L1 cells via the MAPK cascade. Biochem Biophys Res Commun. 2009;381:75–80. 10.1016/j.bbrc.2009.02.011. [DOI] [PubMed] [Google Scholar]
- 8.Novais A, et al. Neudesin is involved in anxiety behavior: structural and neurochemical correlates. Front Behav Neurosci. 2013;7:119. 10.3389/fnbeh.2013.00119. [DOI] [PMC free article] [PubMed] [Google Scholar]
- 9.Ohta H, Kimura I, Konishi M, Itoh N. Neudesin as a unique secreted protein with multi-functional roles in neural functions, energy metabolism, and tumorigenesis. Front Mol Biosci. 2015;2. 10.3389/fmolb.2015.00024. [DOI] [PMC free article] [PubMed]
- 10.Gerstberger S, Jiang Q, Ganesh K. Metastasis Cell. 2023;186:1564–79. 10.1016/j.cell.2023.03.003. [DOI] [PMC free article] [PubMed] [Google Scholar]
- 11.Massague J, Ganesh K. Metastasis-initiating cells and ecosystems. Cancer Discov. 2021;11:971–94. 10.1158/2159-8290.CD-21-0010. [DOI] [PMC free article] [PubMed] [Google Scholar]
- 12.Wang Y, et al. Integrated analysis of tumor microenvironment features to establish a diagnostic model for papillary thyroid cancer using bulk and single-cell RNA sequencing technology. J Cancer Res Clin Oncol. 2023;149:16837–50. 10.1007/s00432-023-05420-8. [DOI] [PMC free article] [PubMed] [Google Scholar]
- 13.Tang S, et al. Metabolic heterogeneity and potential immunotherapeutic responses revealed by single-cell transcriptomics of breast Cancer. Apoptosis. 2024. 10.1007/s10495-024-01952-7. [DOI] [PubMed] [Google Scholar]
- 14.Wang Q, et al. Single-cell transcriptome sequencing of B-cell heterogeneity and tertiary lymphoid structure predicts breast cancer prognosis and neoadjuvant therapy efficacy. Clin Transl Med. 2023;13:e1346. 10.1002/ctm2.1346. [DOI] [PMC free article] [PubMed] [Google Scholar]
- 15.Qiu X, et al. Reversed graph embedding resolves complex single-cell trajectories. Nat Methods. 2017;14:979–82. 10.1038/nmeth.4402. [DOI] [PMC free article] [PubMed] [Google Scholar]
- 16.Zhang X, et al. CellMarker: a manually curated resource of cell markers in human and mouse. Nucleic Acids Res. 2019;47:D721–8. 10.1093/nar/gky900. [DOI] [PMC free article] [PubMed] [Google Scholar]
- 17.Qiu X, et al. Single-cell mRNA quantification and differential analysis with Census. Nat Methods. 2017;14:309–15. 10.1038/nmeth.4150. [DOI] [PMC free article] [PubMed] [Google Scholar]
- 18.Tian Y, et al. Serum deprivation response inhibits breast cancer progression by blocking transforming growth factor-beta signaling. Cancer Sci. 2016;107:274–80. 10.1111/cas.12879. [DOI] [PMC free article] [PubMed] [Google Scholar]
- 19.Chen ZH, et al. CMTM7 inhibits breast cancer progression by regulating Wnt/beta-catenin signaling. Breast Cancer Res. 2023;25. 10.1186/s13058-023-01620-9. [DOI] [PMC free article] [PubMed]
- 20.Zhu K, et al. CAVIN2/SDPR functioned as a tumor suppressor in lung adenocarcinoma from systematic analysis of Caveolae-related genes and experimental validation. J Cancer. 2023;14:2001–14. 10.7150/jca.84567. [DOI] [PMC free article] [PubMed] [Google Scholar]
- 21.Li Y et al. MED1 Downregulation Contributes to TGFbeta-Induced Metastasis by Inhibiting SMAD2 Ubiquitination Degradation in Cutaneous Melanoma. J Invest Dermatol 142, 2228–2237 e2224, 10.1016/j.jid.2022.01.013 (2022). [DOI] [PubMed]
- 22.Bakir B, Chiarella AM, Pitarresi JR, Rustgi AK. EMT, MET, plasticity, and Tumor Metastasis. Trends Cell Biol. 2020;30:764–76. 10.1016/j.tcb.2020.07.003. [DOI] [PMC free article] [PubMed] [Google Scholar]
- 23.Wu D, et al. Nogo-B receptor promotes epithelial-mesenchymal transition in non-small cell lung cancer cells through the Ras/ERK/Snail1 pathway. Cancer Lett. 2018;418:135–46. 10.1016/j.canlet.2018.01.030. [DOI] [PMC free article] [PubMed] [Google Scholar]
- 24.Parveen R, Harihar D, Chatterji BP. Recent histone deacetylase inhibitors in cancer therapy. Cancer. 2023;129:3372–80. 10.1002/cncr.34974. [DOI] [PubMed] [Google Scholar]
- 25.Kovalski JR, Kuzuoglu-Ozturk D, Ruggero D. Protein synthesis control in cancer: selectivity and therapeutic targeting. EMBO J. 2022;41:e109823. 10.15252/embj.2021109823. [DOI] [PMC free article] [PubMed] [Google Scholar]
- 26.Fu J, et al. ATPase family AAA domain-containing protein 2 (ATAD2): from an epigenetic modulator to cancer therapeutic target. Theranostics. 2023;13:787–809. 10.7150/thno.78840. [DOI] [PMC free article] [PubMed] [Google Scholar]
- 27.Bai X, Ni J, Beretov J, Graham P, Li Y. Triple-negative breast cancer therapeutic resistance: where is the Achilles’ heel? Cancer Lett. 2021;497:100–11. 10.1016/j.canlet.2020.10.016. [DOI] [PubMed] [Google Scholar]
- 28.Al-Mahmood S, Sapiezynski J, Garbuzenko OB, Minko T. Metastatic and triple-negative breast cancer: challenges and treatment options. Drug Deliv Transl Res. 2018;8:1483–507. 10.1007/s13346-018-0551-3. [DOI] [PMC free article] [PubMed] [Google Scholar]
- 29.Neophytou C, Boutsikos P, Papageorgis P. Molecular mechanisms and emerging therapeutic targets of triple-negative breast Cancer Metastasis. Front Oncol. 2018;8:31. 10.3389/fonc.2018.00031. [DOI] [PMC free article] [PubMed] [Google Scholar]
- 30.Quail DF, Joyce JA. Microenvironmental regulation of tumor progression and metastasis. Nat Med. 2013;19:1423–37. 10.1038/nm.3394. [DOI] [PMC free article] [PubMed] [Google Scholar]
- 31.Meurette O, Mehlen P. Notch Signaling in the Tumor Microenvironment. Cancer Cell. 2018;34:536–48. 10.1016/j.ccell.2018.07.009. [DOI] [PubMed] [Google Scholar]
- 32.Tian Y, et al. MIR497HG-Derived miR-195 and miR-497 mediate tamoxifen resistance via PI3K/AKT signaling in breast Cancer. Adv Sci (Weinh). 2023;10:e2204819. 10.1002/advs.202204819. [DOI] [PMC free article] [PubMed] [Google Scholar]
- 33.Kent LN, Leone G. The broken cycle: E2F dysfunction in cancer. Nat Rev Cancer. 2019;19:326–38. 10.1038/s41568-019-0143-7. [DOI] [PubMed] [Google Scholar]
- 34.Oshi M, et al. G2M checkpoint pathway alone is associated with drug response and survival among cell proliferation-related pathways in pancreatic cancer. Am J Cancer Res. 2021;11:3070–84. [PMC free article] [PubMed] [Google Scholar]
- 35.Jonsdottir K, et al. The prognostic value of MARCKS-like 1 in lymph node-negative breast cancer. Breast Cancer Res Treat. 2012;135:381–90. 10.1007/s10549-012-2155-9. [DOI] [PubMed] [Google Scholar]
- 36.Kuang XY, et al. The phosphorylation-specific association of STMN1 with GRP78 promotes breast cancer metastasis. Cancer Lett. 2016;377:87–96. 10.1016/j.canlet.2016.04.035. [DOI] [PubMed] [Google Scholar]
- 37.Koper-Lenkiewicz OM, et al. Serum and cerebrospinal fluid neudesin concentration and Neudesin Quotient as potential circulating biomarkers of a primary brain tumor. BMC Cancer. 2019;19:319. 10.1186/s12885-019-5525-4. [DOI] [PMC free article] [PubMed] [Google Scholar]
- 38.Stefanska B, et al. Genome-wide study of hypomethylated and induced genes in patients with liver cancer unravels novel anticancer targets. Clin Cancer Res. 2014;20:3118–32. 10.1158/1078-0432.CCR-13-0283. [DOI] [PubMed] [Google Scholar]
- 39.Wang QS, Shi QQ, Meng Y, Chen MP, Hou J. Identification of Immune-related genes for risk stratification in multiple myeloma based on whole bone marrow gene expression profiling. Front Genet. 2022;13:897886. 10.3389/fgene.2022.897886. [DOI] [PMC free article] [PubMed] [Google Scholar]
- 40.Han KH, et al. The functional and structural characterization of a novel oncogene GIG47 involved in the breast tumorigenesis. BMC Cancer. 2012;12:274. 10.1186/1471-2407-12-274. [DOI] [PMC free article] [PubMed] [Google Scholar]
- 41.Luo C, et al. Progress and Prospect of Immunotherapy for Triple-negative breast Cancer. Front Oncol. 2022;12:919072. 10.3389/fonc.2022.919072. [DOI] [PMC free article] [PubMed] [Google Scholar]
- 42.Zeng M, et al. A novel repurposed drug for cancer therapy. Chin Med J (Engl). 2024;137:1389–98. 10.1097/CM9.0000000000002909. Disulfiram. [DOI] [PMC free article] [PubMed] [Google Scholar]
- 43.Zhang S, et al. The immunomodulatory function and antitumor effect of disulfiram: paving the way for novel cancer therapeutics. Discov Oncol. 2023;14:103. 10.1007/s12672-023-00729-9. [DOI] [PMC free article] [PubMed] [Google Scholar]
- 44.Lanz J, et al. Disulfiram: mechanisms, applications, and challenges. Antibiot (Basel). 2023;12. 10.3390/antibiotics12030524. [DOI] [PMC free article] [PubMed]
- 45.Aversa C, et al. Linifanib: current status and future potential in cancer therapy. Expert Rev Anticancer Ther. 2015;15:677–87. 10.1586/14737140.2015.1042369. [DOI] [PubMed] [Google Scholar]
Associated Data
This section collects any data citations, data availability statements, or supplementary materials included in this article.
Supplementary Materials
Data Availability Statement
Datasets related to this article are from public database (GSE199515 and GSE143423), TCGA database (https://portal.gdc.cancer.gov/), and METABRIC database (https://www.cbioportal.org/study/summary?id=brca_metabric). All data generated or analyzed during this study are included in this article/Additional files


