

Abstract
Pulmonary veno-occlusive disease (PVOD) is a rare form of pulmonary hypertension arising from EIF2AK4 gene mutations or mitomycin C (MMC) administration. The lack of effective PVOD therapies is compounded by a limited understanding of the mechanisms driving vascular remodeling in PVOD. Here we show that administration of MMC in rats mediates activation of protein kinase R (PKR) and the integrated stress response (ISR), which leads to the release of the endothelial adhesion molecule vascular endothelial (VE) cadherin (VE-Cad) in complex with RAD51 to the circulation, disruption of endothelial barrier and vascular remodeling. Pharmacological inhibition of PKR or ISR attenuates VE-Cad depletion, elevation of vascular permeability and vascular remodeling instigated by MMC, suggesting potential clinical intervention for PVOD. Finally, the severity of PVOD phenotypes was increased by a heterozygous BMPR2 mutation that truncates the carboxyl tail of the receptor BMPR2, underscoring the role of deregulated bone morphogenetic protein signaling in the development of PVOD.
Pulmonary veno-occlusive disease (PVOD) or pulmonary capillary hemangiomatosis is a rare condition that represents a subgroup of patients with pulmonary hypertension (PH)1. PVOD is a progressive disease characterized by involvement of the pulmonary vein (PV) and the pulmonary capillary in addition to the pulmonary artery (PA)1,2. Vascular remodeling in PVOD includes structural remodeling of post-capillary small veins in the lung, resulting in intimal thickening, luminal occlusion and thrombosis, the fibrous intimal proliferation of septal veins, and preseptal venules associated with dilatation and proliferation of the pulmonary capillary1. PVOD is caused by biallelic loss-of-function or loss-of-expression (LOF/E) mutations in the EIF2AK4 gene, which encodes general control nonderepressible 2 (GCN2), a critical regulator of the eukaryotic translation initiation factor 2 (eIF2)3,4. Hence, PVOD appeared distinct from pulmonary arterial hypertension (PAH), which had been linked to monoallelic LOF/E mutations in genes involved in bone morphogenetic protein (BMP) signaling, such as GDF2, BMPR2, ACVRL1, ENG, SMAD1 and SMAD9 (refs. 5,6). However, a recent study has found that 8.5% of patients with PAH carry biallelic LOF/E mutations in EIF2AK4, similar to patients with PVOD7. Conversely, some patients with PVOD carry BMPR2 mutations like those found in patients with PAH8,9. The genetic overlap between PVOD and PAH indicates that genetic analysis is insufficient for a definitive diagnosis of the disease. This is an important clinical roadblock because patients with PVOD are at high risk of developing pulmonary edema, respiratory failure and even death from PAH-specific therapies1. On the other hand, PVOD might share a common etiology with PAH, and it might be possible to identify a therapeutic approach beneficial to both diseases. However, the mechanism(s) underlying the pathogenesis of PVOD, especially regarding the effect of BMPR2 mutations, are not fully understood.
Earlier research indicates that patients with cancer treated with chemotherapy drugs, such as mitomycin C (MMC), bleomycin and cisplatin, are at heightened risk of developing PVOD10–12. When MMC was administered to rats, they developed a range of PVOD-like phenotypes, including right ventricular (RV) hypertrophy and remodeling in the pulmonary vasculature11,13–15. Thus, studying the effects of MMC in rats could help us better understand the pathogenesis of PVOD and discover potential treatments. It has been shown previously that levels of the DNA repair enzyme RAD51 rapidly decreased after MMC treatment or depletion of BMPR2 in human pulmonary microvascular endothelial cells (PMVECs) and the vascular endothelium of patients with PAH and mouse models of PAH16, suggesting that the loss of RAD51 plays a role in the pathogenesis of PAH.
The integrated stress response (ISR) is an evolutionarily conserved adaptive intracellular mechanism that maintains homeostasis upon changes in the cellular environment and pathological stimuli17. Maladaptive ISR activation is linked to various diseases and aging17. Aside from GCN2, there are three other eIF2 kinases: heme-regulated inhibitor kinase (HRI), double-stranded RNA-activated protein kinase (PKR) and PKR-like endoplasmic reticulum kinase (PERK) that are activated in response to different types of stress and phosphorylate serine-51 (Ser51) of the α-subunit of eIF2α18. When eIF2α is phosphorylated (p-eIF2α), it associates with eIF2B, a guanine nucleotide exchange factor for eIF2. This association inhibits eIF2B activity and attenuates cap-dependent translation of most mRNA species17. Simultaneously, it promotes the translation of specific transcripts, such as the one encoding cyclic AMP-dependent transcription factor 4 (ATF4), a master transcriptional regulator for activating the ISR pathway19. It is unclear whether deregulation of the GCN2–eIF2–ISR axis contributes to the development of PVOD3,4.
In this study, we report that RAD51 interacts with vascular endothelial (VE) cadherin (VE-Cad) at adherens junctions (AJs) of the vascular endothelium20,21, thereby protecting it from degradation. Upon MMC treatment in rats, the VE-Cad–RAD51 complex (VRC) is secreted to the extracellular space, leading to the loss of junctional integrity of the endothelium. Exposure to MMC triggers the activation of PKR and the ISR. When we administer inhibitors of the ISR or PKR, secretion of the VRC is inhibited and pulmonary vascular phenotypes are restored. Thus, the evidence we present suggests that inhibition of the PKR–ISR axis might effectively prevent or ameliorate the pathogenesis of PVOD.
Results
FBH1 mediates RAD51 degradation after MMC treatment
To identify an E3 ubiquitin ligase that mediates RAD51 degradation, small inhibitory RNA (siRNA) species targeting candidate E3 ubiquitin ligases (FBH1, NEDD4–1, NEDD4–2 and SMURF1) were transfected into PMVECs (Fig. 1a). A 70% reduction of FBH1 resulted in a 4.5-fold increase in RAD51 levels compared to those in control (siCtrl) cells. By contrast, the depletion of other E3 ubiquitin ligases did not alter RAD51 levels (Fig. 1a). When increasing amounts of FBH1 were expressed, RAD51 levels decreased in a dose-dependent fashion (Fig. 1b). Conversely, when FBH1 levels were reduced to ~50%, RAD51 levels were no longer diminished by MMC (Fig. 1c). A time course analysis of FBH1 and RAD51 demonstrated an inverse correlation between the levels of FBH1 and RAD51 after MMC treatment (Fig. 1d). Similar to RAD51, VE-Cad levels also decreased (Fig. 1d). After MMC treatment, FBH1 levels in the cytoplasm and the nucleus increased 3.1-fold and 3.6-fold, respectively (Fig. 1e), while RAD51 levels in the cytoplasm and the nucleus decreased to 38% and 23%, respectively (Fig. 1e). The level of DNA damage increased from 3–5% to 25% after MMC treatment as determined by the comet assay (Fig. 1f), similar to phosphorylated histone H2AX (γH2AX) levels (Fig. 1c). When FBH1 was depleted (Fig. 1a), cells were protected from DNA damage after MMC treatment (Fig. 1f). When RAD51 was depleted, DNA damage was detected in the absence of MMC (Fig. 1c,f). On the contrary, overexpression of RAD51 protected cells from MMC-induced DNA damage (Extended Data Fig. 1a,b).
Fig. 1 |. E3 ubiquitin ligase FBH1 mediates RAD51 degradation upon MMC treatment.

a, PMVECs were transfected with siRNA targeting the expression of RAD51, FBH1, NEDD4–1 (NEDD4), NEDD4–2 (NEDD4L), SMURF1 or nonspecific control siRNA (siCtrl), and total cell lysates and total RNA were subjected to immunoblot analysis of RAD51 and GAPDH (loading control). RAD51 protein amount normalized to GAPDH values and the mRNA levels of RAD51 and E3 ubiquitin ligases normalized to GAPDH values are shown as mean ± s.e.m. n = 3 independent samples. b, PMVECs were transfected with empty vector or increasing amounts of the FBH1 expression plasmid, and total cell lysates were subjected to immunoblot analysis for FBH1, RAD51 and β-actin (loading control). The amount of FBH1 and RAD51 normalized to β-actin values is shown as mean ± s.e.m. n = 3 independent samples. c, Total cell lysates were prepared from vehicle- or MMC-treated PMVECs after transfection of siCtrl, siFbh1 or siRad51 and subjected to immunoblotting for RAD51, FBH1, γH2AX and GAPDH (loading control). Relative levels of the indicated proteins (normalized to GAPDH values) are shown as mean ± s.e.m. n = 3 independent samples. d, Time course changes in the amount of RAD51, FBH1 and VE-Cad following MMC treatment were examined by immunoblot. The amount of proteins normalized to β-actin values is shown as mean ± s.e.m. n = 3 independent samples. e, Cytoplasmic (Cyto) and nuclear (Nuc) fractions of PMVECs treated with vehicle (saline) or MMC for 14 h were subjected to immunoblot analysis for RAD51, FBH1, lamin A and C (loading control for the nuclear fraction) and β-actin (loading control for the cytoplasmic fraction). The relative amount of RAD51 and FBH1 in the cytoplasmic and nuclear compartments was quantitated and is shown as mean ± s.e.m. n = 4 independent samples. f, The alkaline comet assay was performed in PMVECs treated with vehicle (mock) or MMC for 14 h after the transfection of siCtrl, siFbh1 or siRad51. Representative confocal images are shown. White arrows indicate DNA with double-stranded breaks. The bar graph indicates levels of DNA damage as a percentage of nuclei with damaged DNA out of total nuclei as mean ± s.e.m. Approximately 100 nuclei per condition were examined. Scale bars, 25 μm. n = 8 independent samples. Samples for each independent experiment were prepared simultaneously, and gels were run in parallel (c,d,e). Data were analyzed by one-way ANOVA with Tukey’s or Sidak’s post hoc test (a) and by two-way ANOVA with Tukey’s post hoc test (c,e,f).
Role of RAD51 in the regulation of endothelial permeability
Next, the role of the MMC–FBH1–RAD51 axis in regulating VE-Cad was examined. VE-Cad signal was reduced to 24% after MMC treatment (Fig. 2a); however, when FBH1 was depleted, VE-Cad did not diminish (Fig. 2a). When RAD51 was depleted, VE-Cad levels were reduced to 12% of those in control cells (Fig. 2a). The level of VE-Cad in cells transfected with both siFbh1 and siRad51 was as low as that in cells transfected with siRad51 (Fig. 2a), confirming that FBH1-mediated RAD51 degradation leads to the loss of VE-Cad. Similarly, levels of another endothelial adhesion protein at the tight junctions (TJs), zona occludens 1 (ZO-1), decreased to 11.1% upon MMC treatment (Fig. 2a), but when RAD51 was stabilized in cells transfected with siFbh1, ZO-1 levels did not diminish (Fig. 2a). Overexpression of RAD51 inhibited the depletion of VE-Cad by MMC (Extended Data Fig. 1b).
Fig. 2 |. MMC treatment increases permeability and impairs the endothelial barrier.

a, PMVECs transfected with siCtrl, siFbh1, siRad51 or siFbh1 and siRad51 were treated with vehicle (Veh; saline) or MMC for 14 h, followed by IF staining for VE-Cad and ZO-1 (green). Cell nuclei were stained with 4,6-diamidino-2-phenylindole (DAPI; blue). Scale bars, 25 μm. The intensity of the IF signal of VE-Cad (VE) and ZO-1 (ZO) relative to vehicle-treated, siCtrl-transfected cells is shown as mean ± s.e.m. n = 3 independent samples. b, PMVECs transfected with siCtrl, siFbh1 or siRad51 were treated with vehicle or MMC for 14 h and subjected to the TVP assay using molecular tracers: sodium fluorescein (SF), EB or FITC-dex. The concentration of the tracer is presented as fluorescence intensity (FCI) or the permeability coefficient (Ps); mean ± s.e.m. n = 3 independent samples. c, PMVECs transfected with siCtrl, siFbh1, siRad51 or siFbh1 and siRad51 were treated with vehicle or MMC and subjected to TEER measurements (Ω cm2) every hour. Results are shown as mean ± s.e.m. n = 3 independent samples. d, PMVECs were transfected with empty vector or the RAD51 or FBH1 expression plasmid. After treatment with vehicle or MMC, TEER was measured every hour, and relative TEER values are shown as mean ± s.e.m. n = 3 independent samples. All data were analyzed by two-way ANOVA with Tukey’s post hoc test.
We examined the effect of the FBH1–RAD51–VE-Cad axis on vascular permeability by transfecting PMVECs with siCtrl, siRad51 or siFbh1 and treating them with or without MMC and then subjected them to a transwell vascular permeability (TVP) assay with molecular tracers of different molecular weights: sodium fluorescein dye, Evans blue dye (EB) and fluorescein isothiocyanate (FITC)-conjugated dextran (FITC-dex) (Fig. 2b)22. We found an increase in the permeability of MMC-treated or siRad51-treated cells (Fig. 2b). siFbh1 treatment averted the increase in permeability (Fig. 2b), shedding light on the role of the FBH1–RAD51–VE-Cad axis in maintaining the endothelial barrier. Transendothelial electrical resistance (TEER) analysis showed a rapid decline in TEER in siCtrl cells after MMC treatment, indicative of an impaired barrier. siCtrl-treated cells retained high TEER, indicating an intact barrier. Without MMC, siRad51-treated cells showed a decline in TEER, which was further reduced by MMC (Fig. 2c). When FBH1 was depleted, TEER remained high after MMC treatment, suggesting that the barrier remains intact when RAD51 is not degraded by FBH1 (Fig. 2c). Overexpression of FBH1 alone was sufficient to damage the barrier (Fig. 2d). TEER remained high even after MMC treatment in cells overexpressing RAD51, suggesting that high amounts of RAD51 protect against MMC-induced barrier damage (Fig. 2d). These results indicate that barrier damage is mediated through the loss of RAD51 by MMC.
Formation of a RAD51–VE-Cad complex
We performed the proximity ligation assay (PLA) to detect the putative colocalization of endogenous RAD51 and VE-Cad in PMVECs in situ23. A robust signal appeared in untreated cells, suggesting that RAD51 and VE-Cad colocalize (Fig. 3a, red dots). MMC treatment reduced the signal to 17% (Fig. 3a), reflecting MMC-induced depletion of RAD51 and VE-Cad. The amount of VRC was reduced to 16% after MMC treatment (Fig. 3b). Colocalization of VE-Cad and RAD51 at the endothelial cell (EC) junctions was confirmed by immunofluorescence (IF) staining (Fig. 3c, white arrows). We mapped the cytoplasmic domain of VE-Cad (amino acids 621–789) that associates with RAD51 using deletion mutants and found that RAD51 interacts with amino acids 715–730 of VE-Cad (Fig. 3d, blue arrows). This region (amino acids 715–730) does not overlap with those regions known to associate with other VE-Cad-associating proteins, such as vascular endothelial protein tyrosine phosphatase (VE-PTP), p120 catenin and β-catenin24, but it contains a microtubule-associated protein light chain 3 (LC3)-interacting motif (LC3 motif)25,26 (Fig. 3d, yellow boxes). A time-dependent conversion of a cytosolic form of the LC3 protein (LC3-I) to the phosphatidylethanolamine-conjugated form (LC3-II) was observed as early as 2 h after MMC treatment (Fig. 3e), indicating activation of autophagy upon MMC treatment. We speculate that the association of RAD51 with the LC3 motifs of VE-Cad might protect VE-Cad from autophagosome-mediated proteolysis.
Fig. 3 |. Interaction of RAD51 and VE-Cad in PMVECs.

a, Images of an in situ PLA using anti-RAD51 and anti-VE-Cad antibodies in PMVECs treated with vehicle or MMC for 14 h are shown in duplicate. Images of samples without primary antibodies (PLA probes only) are shown as a control (no Ab). PLA signal (red dots) represents the colocalization of VE-Cad and RAD51. DAPI was used to stain nuclei. PLA signal was quantitated and is shown as mean ± s.e.m. Scale bars, 25 μm. n = 6 independent samples. b, PMVECs treated with vehicle or MMC for 14 h were subjected to immunoprecipitation (IP) by nonspecific immunoglobulin (IgG) or an anti-RAD51 antibody, followed by immunoblot analysis for VE-Cad, RAD51 and β-actin (loading control) (IP). Total cell lysates without IP were also subjected to immunoblotting (input). The relative amount of the VRC is shown as mean ± s.e.m. n = 6 independent samples. c, PMVECs treated with vehicle or MMC for 14 h were subjected to IF staining for VE-Cad (red) and RAD51 (green). Cell nuclei were stained with DAPI (blue). Areas indicated by the white boxes are magnified and displayed below. Arrows indicate endothelial junctions where the colocalization of VE-Cad and RAD51 is found as yellow dots. The light blue signal is due to the nuclear localization of RAD51. n = 5 independent samples. Scale bars, 10 μm. d, A schematic representation of the VE-Cad cytoplasmic domain (Cyt; amino acids 621–789) and four deletion mutants (Prox, proximal; Mid, middle; Dist, distal; amino acids 780–784 deleted, Δ5) that are glutathione S-transferase (GST) fusion proteins. The amount of RAD51 pulled down with GST fusion proteins was analyzed by immunoblot. The ratio of RAD51 bound by GST fusion protein and the amount of GST fusion protein (RAD51/GST) is shown as a bar graph (mean ± s.e.m.) and summarized as + or −. The RAD51-interaction region and LC3 motifs are indicated with blue arrows and yellow boxes. n = 3 independent samples. aa, amino acids. e, Time course of the conversion of the LC3-I form of LC3 protein to the LC3-II form and β-actin (control) after MMC treatment was examined by immunoblot. The relative amount of LC3-II normalized to β-actin values is shown as mean ± s.e.m. n = 4 independent samples. Data were analyzed by two-sided unpaired Student’s t-test (b) and by one-way ANOVA with Tukey’s post hoc test (a,d,e).
Release of the VRC to the extracellular compartment
Next, we examined whether the VRC might be released from ECs into the extracellular space. We collected conditioned medium (CM) from PMVECs treated with either vehicle or MMC for 14 h, followed by immunoblotting. We detected a sevenfold and 2.7-fold increase in VE-Cad and RAD51 levels in the CM after MMC treatment, respectively (Fig. 4a). The rapid detection of both proteins in the CM after MMC treatment was confirmed by enzyme-linked immunosorbent assay (ELISA) (Fig. 4b). The VRC was detected in the CM from untreated cells, but it increased 1.7-fold after MMC treatment (Fig. 4c), complementing the reduction of intracellular VRC levels (Fig. 3a,b). Notably, the molecular size of extracellular VE-Cad was the same as that of intracellular VE-Cad, eliminating the possibility of proteolytic cleavage, as reported in apoptotic endothelial cells27. This is consistent with the absence of Annexin V-positive cells after MMC treatment (Extended Data Fig. 1c). VE-Cad and RAD51 were detected in the plasma of Sprague Dawley rats administered MMC (Fig. 4d). The amount of the VRC in plasma was 1.6-fold higher in MMC-treated (day 24) rats (Fig. 4e), indicating that MMC triggers release of the VRC into circulation. When the CM of cells pretreated with MMC for 2 h was replaced with the CM of cells treated with MMC for 14 h (CMMMC), the permeability of the recipient cells gradually returned to basal levels (Fig. 4f, +CMMMC). Consistently, the levels of cellular RAD51 and VE-Cad, which were depleted after the pretreatment with MMC (Fig. 4g and Extended Data Fig. 2a), were rescued by the addition of CMMMC (Fig. 4g). IF staining for VE-Cad further confirmed the rescue of VE-Cad in MMC-treated PMVECs when supplemented with CMMMC (Extended Data Fig. 2b, +CMMMC). Similarly, when CM from MMC-treated donor cells (CMMMC) was reintroduced to the donor cells’ CM after removing MMC (−MMC), the VRC amount (Extended Data Fig. 2c) reverted to levels comparable to those observed in vehicle-treated donor cells. These results demonstrate that the extracellular VRC can restore the endothelial barrier when damaged ECs take it up.
Fig. 4 |. Secretion of the VRC from vascular endothelial cells.

a, CM was collected from PMVECs treated with vehicle or MMC for 14 h and subjected to immunoblotting with anti-VE-Cad, anti-RAD51 and anti-transferrin (TF) (loading control) antibodies, and data were quantified. Data are plotted as mean ± s.e.m. n = 3 independent samples. b, Time course changes in the amount of VE-Cad and RAD51 in the CM of PMVECs after MMC treatment (0–14 h) were measured by ELISA and are plotted as mean ± s.e.m. n = 3 independent samples. c, CM from PMVECs treated with vehicle or MMC for 14 h was subjected to IP with nonspecific IgG (control) or an anti-RAD51 antibody, followed by anti-VE-Cad (for VRC) and anti-RAD51 antibodies. Immunoblotting with an anti-TF antibody is shown as a loading control. Data are plotted as mean ± s.e.m. n = 4 independent samples. d, A scheme of MMC treatment in rats. Plasma samples of WT rats injected once with vehicle or MMC were collected 8, 16 and 24 d after injection and subjected to immunoblotting for VE-Cad and RAD51. Immunoblotting with an anti-TF antibody is shown as a loading control. Relative amounts of RAD51 and VE-Cad in the plasma of vehicle-treated or MMC-treated (days (d)8, 16 and 24) rats were quantitated and are plotted as mean ± s.e.m. Samples for each independent experiment were prepared simultaneously, and gels were run in parallel. n = 3 independent samples per group. PL, plasma. e, The plasma of vehicle or MMC-treated rats (day 24) was subjected to IP with an anti-RAD51 antibody, followed by immunoblot analysis with anti-VE-Cad (for the VRC) and anti-RAD51 antibodies to detect the interaction between these proteins. Immunoblotting with an anti-TF antibody is shown as a loading control. Data are plotted as mean ± s.e.m. n = 3 independent samples. f, CM from PMVECs treated with vehicle (CMveh) and MMC for 14 h (CMMMC) was supplemented into the culture medium of PMVECs pretreated with MMC for 2 h. Time course changes in permeability were measured using the TPV assay in triplicate with FITC-dex as a tracer. Results are shown as relative FCI and are presented as mean ± s.e.m. g, The amount of RAD51 and VE-Cad protein in PMVECs after incubating with CMveh or CMMMC for 14 h was quantitated by immunoblotting. Results are shown as mean ± s.e.m. n = 4 independent samples. Data were analyzed by two-sided unpaired Student’s t-test (a,c,e), by one-way ANOVA with Tukey’s post hoc test (b,d,f) and by two-way ANOVA with Tukey’s post hoc test (g).
Activation of the ISR pathway by MMC
Transcriptome analysis of PMVECs treated with MMC revealed that 2,385 ATF4 target genes (Fig. 5a), including ATF3, ATF5, PPP1R15A (GADD34), GADD45A (GADD45), DDIT3 (CHOP) and TRIB3, were induced by MMC treatment (Extended Data Fig. 2d), suggesting ISR activation28. Transcriptional activation of Atf4 and ATF4 target genes was validated in the lungs of MMC-treated rats (Fig. 5b). We also noted that mRNA levels of one of the eIF2 kinases, PKR (Eif2ak2), were increased (Fig. 5b). There are three evolutionarily conserved ATF4-binding sites within the first intron of the Eif2ak2 gene (Fig. 5c). The chromatin immunoprecipitation (ChIP) assay revealed a 37-fold increase in ATF4 binding by MMC (Fig. 5c), suggesting that MMC promotes the recruitment of ATF4 and transcriptional activation of the Eif2ak2 gene. To explore the role of MMC-mediated ISR activation and EC damage in vivo, we performed immunoblot analysis using lung lysates from rats exposed to either vehicle or MMC. ATF4 protein levels increased approximately sevenfold, a hallmark of ISR activation, in MMC-treated rats (Fig. 5d). As ISR can be initiated by the phosphorylation of eIF2α by eIF2α kinases, such as GCN2, PKR, PERK or HRI, we also investigated their protein levels and found that PKR levels increased by 3.1-fold in MMC-treated rats (Fig. 5d). Unlike those of PKR, GCN2 levels were significantly diminished after MMC treatment, mimicking patients with PVOD and LOF/E Eif2ak4 mutations (Fig. 5d). VE-Cad, von Willebrand factor (vWF) and RAD51 levels also decreased (Fig. 5d). Both PERK and HRI were expressed in low amounts both with and without MMC (Fig. 5d), leaving PKR as the likely mediator of ISR activation induced by MMC. A threefold increase in the level of PKR autophosphorylation at threonine-446 (p-PKR) indicated the activation of PKR after MMC treatment29 (Fig. 5d). The relative amount of phosphorylated PKR activator protein (PACT)30 was increased 2.8-fold in MMC-treated rats (Fig. 5d), further confirming PKR activation in MMC-treated rats. Furthermore, a 2.9-fold increase in p-eIF2α relative to total eIF2α (p-eIF2α/t-eIF2α) was detected (Fig. 5d). IF staining for ATF4 or p-PKR showed the induction of p-PKR and ATF4 in the CD31-positive endothelium of PAs and PVs in MMC-treated rats (Fig. 5e). Decreased RAD51 staining and increased FBH1 staining were also evident in the endothelium of PAs and PVs in MMC-treated rats (Fig. 5e). By contrast, the levels of the VRC, VE-Cad and RAD51 in the plasma increased after MMC treatment (Fig. 5f). Annexin V staining revealed apoptotic cells within CD31-positive vascular endothelium on day 8, but not on day 14 or 24, following MMC treatment (Extended Data Fig. 3a).
Fig. 5 |. MMC activates the ISR pathway via PKR induction.

a, ATF4 target genes differentially expressed in PMVECs treated with MMC for 0, 4 or 14 h are shown in a heatmap. n = 3 independent RNA samples per condition. Min, minimum; max, maximum. b, Total RNA isolated from the lungs of WT rats injected with MMC (day 24) was subjected to quantitative-PCR (RT–qPCR) for Atf4 mRNA, ATF4 target mRNA (Atf3 and Ppp1r15a (Gadd34)), mRNA encoding Eif2ak2 (PKR) and mRNA encoding Cdh5 (VE-Cad) (control for MMC treatment) in triplicate. Results were normalized to Gapdh mRNA values and are presented as mean ± s.e.m. c, ChIP assay in PMVECs treated with vehicle or MMC for 4 h. ChIP was performed with nonspecific IgG (control) or an anti-ATF4 antibody, followed by PCR amplification using primers (blue arrows) flanking the genomic region of the Eif2ak2 gene containing ATF4-binding motifs (yellow boxes). PCR results are shown as fold enrichment over the input sample as mean ± s.e.m, and the image of the PCR product is shown as an inset. n = 3 independent experiments. bs, binding site. d, Lung lysates of WT rats 24 d after vehicle or MMC administration were subjected to immunoblotting for the indicated proteins. The amount of the indicated proteins normalized to β-actin values, the ratio of p-eIF2α/t-eIF2α and p-PACT/t-PACT are shown as mean ± s.e.m. n = 3 independent samples per condition. e, Lungs from WT rats administered vehicle or MMC were harvested on day 24 and subjected to IF staining with anti-ATF4 (green), anti-p-PKR (green), anti-α-SMA (red), anti-CD31 (red), anti-RAD51 (green) and anti-FBH1 (green) antibodies, images of the PA and the PV were taken, and merged images are shown. Cell nuclei were stained with DAPI (blue). Asterisks indicate the location of the PA or the PV. Scale bars, 10 μm. f, RAD51 and VE-Cad in the plasma of WT rats 24 d after vehicle or MMC administration were detected by immunoblot. Plasma samples were also subjected to IP with nonspecific IgG (control) or an anti-RAD51 antibody, followed by immunoblotting with anti-VE-Cad (for the VRC), anti-RAD51 and anti-TF (loading control) antibodies. The relative amount of the VRC, VE-Cad and RAD51 normalized to TF values is shown as mean ± s.e.m. n = 4 per condition. PL, plasma. g, An in vivo puromycin-incorporation assay was performed using lung lysates of WT rats (n = 4 per condition) 24 d after vehicle or MMC administration. After normalizing the total protein amount, puromycin-labeled proteins were visualized by immunoblot with an anti-puromycin antibody and are presented in quadruplicate. The amount of puromycin-labeled proteins normalized to GAPDH values (loading control) is shown as mean ± s.e.m. Ctrl, control. h, The amount of the indicated proteins in the lung was compared between control mice and Sch-PH mice and CH-PH mice. Protein levels normalized to β-actin values (loading control) are shown as mean ± s.e.m. n = 4 per condition. i, The plasma of Sch-PH and CH-PH mice and their controls was subjected to immunoblotting with anti-VE-Cad and anti-RAD51 antibodies. An immunoblot with an anti-TF antibody is shown as a loading control. The plasma samples were also immunoprecipitated with an anti-RAD51 antibody, followed by immunoblotting with an anti-VE-Cad antibody to detect the VRC. The plasma of MMC-treated rats (MMC) was included as a control. The relative amount of the VRC is shown as mean ± s.e.m. n = 4 independent samples per condition. j, The amount of the indicated proteins in the lung was compared between WT rats administered vehicle (control) or MCT. Proteins normalized to β-actin values (loading control) are shown as mean ± s.e.m. n = 3 independent samples per condition. k, The plasma of WT rats administered vehicle (control) or MCT was subjected to immunoblotting with anti-VE-Cad and anti-RAD51 antibodies. An immunoblot with an anti-TF antibody is shown as a loading control. Plasma samples were immunoprecipitated with an anti-RAD51 antibody and immunoblotted with an anti-VE-Cad antibody to detect the VRC. The plasma of MMC-treated rats (MMC) is included as a control. The relative amount of the VRC is shown as mean ± s.e.m. n = 3 independent samples per condition. l, PMVECs (5 × 10³ cells) were pretreated with the PKR inhibitor C16 or the ISR inhibitor ISRIB for 15 min, followed by MMC exposure for 1–14 h. The TPV assay using FITC-dex as a tracer was used to examine time course changes in permeability. Results are presented as relative FCI; mean ± s.e.m. n = 4 independent samples. m, PMVECs were pretreated with MMC for 2 h, followed by treatment with the PKR inhibitor C16 or the ISR inhibitor ISRIB for 0–14 h. The TPV assay using FITC-dex as a tracer was used to examine time course changes in permeability. Results are presented as relative FCI; mean ± s.e.m. n = 4 independent samples. n, PMVECs treated with vehicle or MMC alone, MMC and ISRIB or C16 for 14 h were subjected to IF staining with an anti-VE-Cad antibody (red) and DAPI (blue) for nuclei. Scale bars, 10 μm. o, PMVECs treated with vehicle or MMC alone, or MMC and ISRIB or C16 for 14 h were subjected to TEM, and representative images are shown. The areas shown as yellow and pink boxes are magnified and shown on the right. Scale bars, 500 nm (left), 200 nm (middle), 100 nm (right). White dotted lines delineate cell morphology. AJs and TJs are marked by yellow and green arrows, respectively. Pink arrows highlight gaps between two neighboring cells. Samples for each independent experiment were prepared simultaneously, and gels were run in parallel (d,h–k). Data were analyzed by two-sided unpaired Student’s t-test (d,f,g), by one-way ANOVA with Tukey’s post hoc test (c,i,k–m) or Sidak’s post hoc test (b) and by two-way ANOVA with Tukey’s post hoc test (h,j).
To examine whether MMC treatment results in the inhibition of global protein synthesis via ISR activation, rats injected with vehicle (control) or MMC were treated with puromycin and lung lysates were subjected to immunoblotting with an anti-puromycin antibody to detect puromycin-incorporated nascent proteins. The levels of puromycin-labeled proteins were 78% lower in MMC-injected rats than in control rats, confirming global translational inhibition in the lungs of MMC-treated rats (Fig. 5g). The activation of the PKR–ISR pathway is unique to the MMC-induced PVOD model because lung lysates from mice with Schistosoma-induced PH (Sch-PH) and chronic hypoxia-induced PH (CH-PH)31 showed neither PKR activation (p-PKR induction) nor induction of ATF4 (Fig. 5h), despite the fact that robust PH phenotypes were detected in these models (Extended Data Fig. 3b). Full-length VE-Cad (130 kDa), RAD51 and VRC were not detected in the plasma of Sch-PH or CH-PH mice (Fig. 5i). Only cleaved VE-Cad (90 kDa) was detected (Fig. 5i). We also examined lung and plasma samples from the monocrotaline (MCT)-induced rat PH model (MCT-PH). Lung lysates of MCT-PH rats demonstrated no induction of p-PKR or ATF4 compared to those of control rats (Fig. 5j), despite exhibiting PH phenotypes (Extended Data Fig. 3c). The VRC was not detected in the plasma of MCT-PH rats, unlike in rats with MMC-mediated PVOD (Fig. 5k). These results suggest that PKR and ISR activation and release of the VRC are unique to PVOD model rats.
To investigate whether the effects of MMC on endothelial dysfunction could be mitigated by pharmacological intervention, we used the PKR antagonist C16 (ref. 32) or the ISR inhibitor ISRIB33,34 to precondition PMVECs for 15 min, followed by MMC treatment and a TVP assay (Fig. 5l). MMC treatment resulted in a threefold increase in permeability by 14 h, but this effect was reduced to ~50% when cells were pretreated with C16 or ISRIB (Fig. 5l). When PMVECs were first treated with MMC for 2 h and then exposed to C16 and ISRIB, cell permeability decreased by ~35% compared to vehicle-treated cells (Fig. 5m). IF staining for VE-Cad and transmission electron microscopy (TEM) analyses revealed that treatment with ISRIB or C16 mitigated the depletion of VE-Cad (Fig. 5n) and the impairment of junctional structure (Fig. 5o) induced by MMC. These results suggest that inhibiting the PKR–ISR axis protects against MMC-induced EC damage.
ISRIB prevents vascular remodeling mediated by MMC
Next, we tested the therapeutic effect of the ISR inhibitor ISRIB in PVOD model rats35,36. As BMPR2 mutations have been found in some patients with PVOD8,9, we also tested the effect of MMC and ISRIB in Bmpr2-mutant (Mut) rats (E503fs and Q495fs) (Extended Data Fig. 4a). Because homozygous Bmpr2 mutations are embryonic lethal, all Mut rats used in this study were heterozygotes. Both mutant alleles express truncated proteins lacking the carboxyl-terminal tail domain (CTD) of BMPR2 (ΔCTD-BMPR2), similar to the mutations found in patients with PAH37–39. When PA smooth muscle cells (PASMCs) derived from wild-type (WT) and Mut (E503fs) rats were stimulated with BMP4 in increasing concentrations, the phosphorylation of SMAD1, SMAD5 and SMAD8 (p-SMAD1/5/8) was indistinguishable between WT and Mut PASMCs (Extended Data Fig. 4b). Upon BMP4 stimulation, time-dependent changes in p-SMAD1/5/8 and in the mRNA of SMAD1/5/8 target genes Id3 and Smad6 were similar between WT and Mut (Extended Data Fig. 4c). These results underscore the important role of SMAD-independent signaling in maintaining pulmonary vascular homeostasis37–40.
Both male and female WT and Mut rats were subjected to a single injection of vehicle or MMC on day 0 with ISRIB or vehicle, followed by an analysis of cardiopulmonary phenotypes on day 24. We found that ISRIB treatment prevented the induction of ATF4 and p-PKR by MMC in both WT and Mut rats, indicating an attenuation of the PKR–ISR pathway (Fig. 6a). Depletion of RAD51 and VE-Cad by MMC was also prevented by ISRIB treatment (Fig. 6a). The p-eIF2α/t-eIF2α ratio was not altered by ISRIB treatment in response to MMC (Extended Data Fig. 5a,b), as reported previously33,41. PA pressure (RV systolic pressure (RVSP)) and RV hypertrophy (RV/LV + septum (S) weight ratio (RV/LV + S)) of WT and Mut rats in the basal state were indistinguishable (25.6 ± 0.76 mmHg for WT and 25.5 ± 2.20 mmHg for Mut (for RVSP) and 0.216 ± 0.101 g/g for WT and 0.224 ± 0.013 g/g for Mut (for RV/LV + S)), indicating no spontaneous PH development in Mut rats like the rat carrying a heterozygous BMPR2-null mutation42 (Fig. 6b). When rats were administered MMC, RVSP was elevated by 46% (to 33.1 ± 1.3 mmHg; P = 0.0008) in WT rats and by 55% (to 37.6 ± 1.8 mmHg; P = 0.0008) in Mut rats and the RV/LV + S ratio was elevated by 41% (to 0.313 ± 0.008 g/g; P < 0.0001) in WT rats and by 52% (to 0.352 ± 0.012 g/g; P = 0.0021) in Mut rats (Fig. 6b). These results indicate that Mut rats develop more severe PH phenotypes than WT rats upon MMC treatment. No change in the left ventricular systolic pressure (LVSP) was detected after MMC treatment (Fig. 6b). With the co-treatment with ISRIB and MMC, RVSP in both WT and Mut rats decreased to levels (26.0 ± 1.7 mmHg in WT and 26.1 ± 0.5 mmHg in Mut) similar to those in vehicle-treated WT and Mut rats (Fig. 6b). Similarly, the RV/LV + S ratio decreased to 0.232 ± 0.014 g/g (P = 0.002) and 0.196 ± 0.005 g/g (P < 0.0001) with the co-treatment with ISRIB and MMC in WT and Mut rats, respectively, which are similar to values of vehicle-treated WT and Mut rats (Fig. 6b). RV wall thickness increased by 2.2-fold and 2.4-fold in WT and Mut rats treated with MMC, respectively, which was prevented by ISRIB without changes in LV wall thickness (Fig. 6c). Thus, the Bmpr2 mutation exacerbates PVOD phenotypes (Fig. 6a,b), and ISRIB prevents them in both WT and Mut rats. The PH phenotypes of male and female rats were indistinguishable (Extended Data Fig. 5c). Lung weight and the lung weight/body weight ratio were also elevated after MMC treatment in WT and Mut rats, and ISRIB treatment prevented this (Extended Data Fig. 5d). Vascular morphology in the heart and the liver remained unchanged after MMC treatment (Extended Data Fig. 5e). Furthermore, the levels of ATF4 (Extended Data Fig. 5f) and global protein synthesis (Extended Data Fig. 5g) remained unchanged in the heart and the liver, indicating that the ISR activation is specific to the pulmonary vasculature. Images of Microfil-casted pulmonary vessels indicated a decrease in the density of distal pulmonary vessels in MMC-treated WT and Mut rats (Extended Data Fig. 5h). Counting the number of branches and junctions in the distal pulmonary vessels revealed a significant reduction after MMC treatment, which was prevented by ISRIB treatment (Extended Data Fig. 5h). When pulmonary vasculature was perfused in MMC-treated rats, the extravasation of EB dye stained the entire lung blue (Extended Data Fig. 6a) and the intensity of EB stain increased ~1.7-fold compared to that in control rats (Extended Data Fig. 6b) due to the impaired endothelial barrier and increased vascular permeability. When co-treated with ISRIB, EB extravasation was prevented. The appearance of the lung resembled that in control WT and Mut rats (Extended Data Fig. 6a), and the intensity of the EB stain in ISRIB-treated rats was indistinguishable from that in the control rats (Extended Data Fig. 6b). MMC-treated rats developed medial thickening in both PAs and PVs, as reported previously11,13 (Fig. 6d). Both microvessels (<50 μm in diameter) and medium-sized vessels (50–80 μm in diameter) underwent remodeling in WT and Mut rats following MMC treatment (Fig. 6d). However, the medial thickness of medium-sized vessels (50–80 μm) increased threefold after MMC treatment in Mut rats, while, in WT rats, it only increased 2.5-fold (Fig. 6d). Vascular remodeling in Mut rats was more severe than in WT rats, but ISRIB attenuated the vascular phenotype in Mut and WT rats equally (Fig. 6d). IF staining for VE-Cad, a vascular endothelial cell marker, and α-smooth muscle actin (α-SMA), a smooth muscle marker in PAs and PVs, showed the depletion of ECs and a time-dependent growth of smooth muscle cells (SMCs) after MMC treatment (Fig. 6e). By 24 d after MMC treatment, VE-Cad signals had dropped to 30–40%, while α-SMA signals had increased to 300% in comparison to those in vehicle-treated WT and Mut rats; however, the vascular changes were prevented by ISRIB (Fig. 6e). We noted that the levels of RAD51 and VE-Cad in the plasma of Mut rats were higher than those in WT rats (Extended Data Fig. 6c), which is consistent with a more severe vascular phenotype in Mut rats. The vascular phenotypes of the two Mut lines were indistinguishable (Extended Data Fig. 7). Altogether, these results demonstrate that ISRIB effectively blocks vascular remodeling and the impairment of endothelial barriers induced by MMC, even on a Mut background. The protective role of ISRIB seems to be through inhibition of the ISR pathway, as the induction of mRNA encoding PKR and mRNA of ISR pathway genes was abolished by ISRIB (Fig. 6f). The ChIP assay demonstrated that ISRIB attenuates the recruitment of ATF4 to the EIF2AK2 gene by MMC (Extended Data Fig. 6d). The relative plasma levels of VE-Cad (from 3.1 ± 0.03 fold to 1.1 ± 0.03 fold; P < 0.0001 with ISRIB) and RAD51 (from 3.5 ± 0.02 fold to 1.3 ± 0.17 fold; P < 0.0001 with ISRIB) in MMC-treated rats were also reduced by ISRIB (Fig. 6g).
Fig. 6 |. Inhibition of the ISR prevents MMC-induced PVOD in WT and Mut rats.

a, A scheme of ISRIB treatment in MMC-treated rats. Immunoblot analysis of the indicated proteins in total lung lysates from WT and Mut rats treated with vehicle (−) or MMC (+), with or without ISRIB. Amounts of the indicated proteins relative to β-actin values are shown as mean ± s.e.m. Samples for each independent experiment were prepared simultaneously, and gels were run in parallel. n = 3 independent samples. b, RVSP (mmHg), RV/LV + S ratio and LVSP (mmHg) in WT and Mut rats in control conditions, exposed to MMC (MMC) and treated with MMC and ISRIB. The results are shown as mean ± s.e.m. n = 8–34 independent samples. c, H&E staining of heart from WT and Mut rats treated with vehicle, MMC or MMC and ISRIB. R and L indicate the right and left ventricles, respectively. A black bar is used to indicate RV wall thickness. RV and LV wall thickness was measured with ImageJ at three different locations per sample and is shown as mean ± s.e.m. n = 6 independent samples. d, H&E staining of pulmonary vasculature (PA and PV), in WT and Mut rats treated with vehicle or MMC with or without ISRIB, was performed on day 24. The third column is a magnified image of the black rectangular area in the second column. The medial thickness of microvessels (<50 μm in diameter) and medium-sized vessels (50–80 μm in diameter) was quantitated and converted to the value relative to the medial thickness of vehicle-treated WT rats and is shown as mean ± s.e.m. Scale bars, 10 μm. n = 10 independent samples. e, The PA and the PV from WT and Mut rats 8, 16 or 24 d after vehicle or MMC administration were stained with anti-α-SMA (red) and anti-VE-Cad (green) antibodies for SMCs and endothelial cells, respectively. The fourth row represents 24 d of treatment with MMC and ISRIB. The asterisk indicates the location of the PA or the PV. Scale bars, 50 μm. IF signals of images on day 24 were quantitated and converted to the value relative to the signal intensity of vehicle-treated WT rats and are shown as mean ± s.e.m. n = 10–11 independent samples. f, mRNA levels of ATF4 target genes in the lungs of WT and Mut rats administered vehicle, MMC or MMC and ISRIB were analyzed by RT–qPCR and are shown as mean ± s.e.m. n = 3 independent samples. g, The amount of RAD51 and VE-Cad in the plasma of rats treated with MMC with or without ISRIB was quantitated by ELISA and is shown as mean ± s.e.m. n = 3 independent samples. All data were analyzed by two-way ANOVA with Tukey’s post hoc test (a–g).
Next, we examined the effect of the PKR inhibitor C16 on MMC-mediated PVOD in WT rats. Administration of C16 prevented the MMC-induced increase in RVSP (25.4 ± 0.67 mmHg for vehicle, 34.9 ± 0.85 mmHg for MMC alone and 25.6 ± 0.81 mmHg for MMC and C16), RV/LV + S (0.22 ± 0.01 g/g for vehicle, 0.31 ± 0.01 g/g for MMC alone and 0.22 ± 0.01 g/g for MMC and C16) and the lung/body weight ratio (0.0019 ± 0.0004 g/g for vehicle, 0.0131 ± 0.0012 g/g for MMC alone and 0.0049 ± 0.0006 g/g for MMC and C16) (Fig. 7a), vascular remodeling, such as medial hypertrophy (Fig. 7b, hematoxylin and eosin (H&E) staining) and fibrous growth of the adventitia (Fig. 7b, trichrome) as well as the reduction of the density of distal pulmonary vessels mediated by MMC (Extended Data Fig. 6e). Perfusion of the pulmonary vasculature revealed that C16 treatment prevented the increase in vascular permeability (Extended Data Fig. 6a,b). MMC-mediated phosphorylation of eIF2α and the induction of PKR were both prevented by C16 (Fig. 7c), which confirms that PKR, but not GCN2, PERK or HRI, is the eIF2 kinase responsible for the activation of the ISR in MMC-treated rats. MMC-mediated ATF4 induction, the depletion of intracellular RAD51 and VE-Cad (Fig. 7c) and the increase in extracellular concentrations of RAD51 (from 2.9 ± 0.10 fold to 1.3 ± 0.03 fold with C16; P < 0.0001) and VE-Cad (from 3.5 ± 0.07 fold to 1.5 ± 0.03 fold with C16; P < 0.0001) (Fig. 7d) were all prevented by C16. These results support a model in which PKR-dependent ISR activation leads to vascular remodeling through disrupting junctional structures in ECs.
Fig. 7 |. The PKR antagonist C16 prevents PVOD phenotypes.

a, A scheme of C16 treatment in WT rats. RVSP, RV/LV + S ratio and the lung/body weight ratio in vehicle- or MMC-exposed WT rats treated with or without C16 are shown. The results are shown as mean ± s.e.m. n = 6 independent samples. b, H&E and trichrome staining of pulmonary vasculature in WT rats treated with vehicle or MMC with or without C16. The third column is a magnified image of the black rectangular area in the second column. Scale bars, 10 μm. c, Lung lysates from WT rats injected with vehicle or MMC with or without C16 were subjected to immunoblot analysis for the indicated proteins. The relative amount of proteins, normalized to β-actin values (loading control), and the p-eIF2α/t-eIF2α ratio are shown as mean ± s.e.m. Samples for each independent experiment were prepared simultaneously, and gels were run in parallel. n = 2–3 independent samples per condition. d, The amount of RAD51 and VE-Cad in the plasma of rats treated with MMC with or without C16 was quantitated by ELISA and is shown as mean ± s.e.m. n = 3 independent samples. Data were analyzed by one-way ANOVA with Tukey’s post hoc test (a) and by two-way ANOVA with Tukey’s post hoc test (c,d).
Delayed ISRIB treatment reverses PVOD
We next examined whether delayed administration of ISRIB could reverse MMC-induced vascular lesions after they had already developed. Because the elevation of RVSP (24% increase over control) and the RV/LV + S ratio (52% increase over control) (Extended Data Fig. 8a) as well as medial hypertrophy in PAs and PVs (Fig. 6f and Extended Data Fig. 8b) were evident as early as 8 d after MMC administration, we administered ISRIB for either 16 d or 8 d, starting on day 8 (Fig. 8a). In both 16-d and 8-d treatments, ISRIB reversed PVOD phenotypes, RVSP (24.6 ± 1.03 mmHg for vehicle, 34.5 ± 2.78 mmHg for MMC, 25.7 ± 1.02 mmHg (16-d ISRIB), 24.6 ± 0.77 mmHg (8-d ISRIB)) and RV/LV + S (0.21 ± 0.01 g/g for vehicle, 0.31 ± 0.02 g/g for MMC, 0.21 ± 0.01 g/g (16-d ISRIB), 0.20 ± 0.01 g/g (8-d ISRIB)) (Fig. 8a). Similarly, both treatments reduced vascular remodeling in PAs and PVs (Fig. 8b, H&E), vascular fibrosis in PAs (Fig. 8b, trichrome) and the lung/body weight ratio (Extended Data Fig. 8c). Rescue of VE-Cad and RAD51 in the vascular endothelium was also detected (Fig. 8c). Both treatments reduced the mRNA of ISR-induced genes in MMC-treated rats (Fig. 8d). Both treatments reversed the induction of ATF4 and PKR proteins, the p-PACT/t-PACT ratio and the reduction of RAD51 and VE-Cad proteins (Fig. 8e and Extended Data Fig. 8d). Staining with 5-ethynyl-2′-deoxyuridine (EdU) revealed a robust increase in EdU-positive (proliferating) cells within the vascular smooth muscle and adventitia layers but not in the CD31-positive vascular endothelium (Extended Data Fig. 9). When rats underwent ISRIB treatment, EdU-positive cells became evident in the endothelial layer but not in the smooth muscle or adventitia layers, indicating that ISRIB treatment promotes the proliferation of endothelial cells to restore the endothelial layer that was impaired by MMC (Extended Data Fig. 9). The elevated plasma RAD51 (from 3.3 ± 0.11 fold to 1.6 ± 0.13 fold (16-d); P < 0.0001 or 1.3 ± 0.05 fold (8-d); P < 0.0001) and VE-Cad (from 3.9 ± 0.14 fold to 1.7 ± 0.18 fold (16-d); P < 0.0001 or 1.0 ± 0.03 fold (8-d); P < 0.0001) levels were reduced by the delayed treatment with ISRIB (Fig. 8f). Thus, ISRIB reverses MMC-mediated vascular remodeling even after the lesions have been formed. The levels of ATF4 and p-PKR in lung samples from patients with PVOD, patients with idiopathic PAH (IPAH) and control (non-PAH) individuals were examined. Both ATF4 and p-PKR signals were detected in ECs and SMCs of PAs and PVs from patients with PVOD but not in control individuals or patients with IPAH (Fig. 8g). This is consistent with observations from the Sch-PH, CH-PH and MCT-PH animal models, in which no activation of the PKR–ISR axis was detected (Fig. 5h–j). Plasma concentrations of RAD51 (1.2 × 10⁻⁵ ± 3.9 × 10⁻⁶ signal intensity (si; control), 12.2 × 10⁻⁵ ± 3.0 × 10⁻⁵ si (PVOD)) and VE-Cad (3.2 × 10⁻⁵ ± 1.9 × 10⁻⁶ si (control), 48.1 × 10⁻⁵ ± 4.3 × 10⁻⁵ si (PVOD)) in patients with PVOD were 12-fold and 15-fold higher than in controls, respectively (Fig. 8h). Both plasma RAD51 and VE-Cad levels were higher than in patients with IPAH without BMPR2 mutations (IPAH) and in patients with PAH and BMPR2 mutations (PAH-BR2Mut) (RAD51, 2.3 × 10⁻⁵ ± 4.6 × 10⁻⁷ si (IPAH), 0.9 × 10⁻⁵ ± 5.7 × 10⁻⁶ si (PAH-BR2Mut); VE-Cad, 3.6 × 10⁻⁵ ± 7.3 × 10⁻⁶ si (IPAH), 5.8 × 10⁻⁵ ± 1.1 × 10⁻⁵ si (PAH-BR2Mut)) (Fig. 8h and Extended Data Fig. 10). The amount of the VRC in the plasma of patients with PVOD was 4.2-fold higher than in control individuals or in patients with IPAH or PAH-BR2Mut (Fig. 8i). The results in humans not only validate the findings of the rat PVOD model but also suggest that plasma VRC levels might serve as a specific biomarker for PVOD. In summary, this study provides evidence that the activation of the PKR–ISR axis plays a critical role in the development of PVOD phenotypes, and PKR and ISR antagonists effectively attenuate pulmonary vascular remodeling (Fig. 8j).
Fig. 8 |. Delayed ISRIB treatment reverses PVOD phenotypes in rats.

a, Scheme of the delayed ISRIB treatment (16-d and 8-d treatment). RVSP, the RV/LV + S ratio and LVSP in vehicle- or MMC-exposed WT rats with or without delayed ISRIB treatment (16 d and 8 d) are shown. The results are shown as mean ± s.e.m. n = 6 independent samples. b, H&E and trichrome staining of the pulmonary vasculature in WT rats treated with vehicle or MMC with or without delayed ISRIB treatment (16 d and 8 d). The third column is a magnified image of the black rectangular area in the second column. Scale bars, 10 μm. c, IF staining of pulmonary vasculature (PA and PV) in WT rats treated with vehicle or MMC with or without delayed ISRIB treatment (16 d and 8 d) with an anti-VE-Cad (red) antibody, an anti-RAD51 (green) antibody and DAPI (for nuclei). Scale bars, 10 μm. Asterisks indicate the location of the PA or the PV. d, The amount of the indicated mRNA species relative to Gapdh mRNA in the lungs of rats treated with MMC with or without delayed ISRIB treatment was analyzed by RT–qPCR and is shown as mean ± s.e.m. n, at least six independent samples. e, The amount of the indicated proteins relative to GAPDH protein in the lungs of rats treated with MMC with or without delayed ISRIB treatment was analyzed by immunoblot analysis and is shown as mean ± s.e.m. n = 3 independent samples per condition. f, The amount of RAD51 and VE-Cad in the plasma of rats treated with MMC with or without delayed ISRIB treatment was quantitated by ELISA and is shown as mean ± s.e.m. n = 3 independent samples. g, Human lung samples from control individuals and patients with PVOD and IPAH were stained with anti-ATF4 (green), anti-p-PKR (green), anti-CD31 (red), anti-α-SMA (red) and anti-RAD51 (green) or anti-FBH1 (green) antibodies, images of the PA and the PV were taken, and merged images are shown. Cell nuclei were stained with DAPI (blue). Asterisks indicate the location of the PA or the PV. Scale bars, 10 μm. h, Concentrations (ng ml−1) of RAD51 and VE-Cad in the plasma of control (non-PAH) individuals, patients with PVOD, patients with IPAH and patients with PAH-BR2Mut were measured in duplicate by ELISA and are plotted as mean ± s.e.m. n = 10 independent samples per group. i, Plasma from control individuals and patients with PVOD, IPAH and PAH-BR2Mut was subjected to IP with an anti-RAD51 antibody, followed by immunoblot analysis for VE-Cad (for the VRC) and RAD51. Plasma was also subjected to immunoblot analysis for RAD51 and TF (loading control). The relative amount of the VRC is shown as mean ± s.e.m. Samples for each independent experiment were prepared simultaneously, and gels were run in parallel. n = 5 independent samples per group. j, A schematic diagram of MMC-induced aberrant activation of the PKR–ISR pathway, and depletion of VE-Cad and RAD51 promotes the pathogenesis of PVOD, which is facilitated by deregulation of the BMPR2 signaling pathway. C16 and ISRIB are equally effective in attenuating MMC-induced PVOD phenotypes. All data were analyzed by one-way ANOVA with Tukey’s post hoc test (a,d–f,h,i).
Discussion
In this study, we demonstrate that MMC-mediated activation of PKR triggers the ISR and promotes pulmonary vascular remodeling and RV hypertrophy, resembling the conditions observed in human patients with PVOD. PKR is activated upon detecting viral and endogenous double-stranded RNA43. The mechanism by which PKR is activated in response to MMC treatment remains unclear. It remains unclear how GCN2 levels are reduced following MMC treatment and whether the depletion of GCN2 is associated with PKR activation. PH is a well-recognized complication of human immunodeficiency virus infection44. It is plausible that the activation of the PKR–ISR pathway plays a role in the pathogenesis of human immunodeficiency virus-associated PH, and the attenuation of this pathway by C16 or ISRIB might ameliorate the symptoms, as we have observed in PVOD model rats.
Endothelial cell–cell junctions are composed of AJs and TJs, each with their respective set of adhesion molecules20,24. VE-Cad is fundamental for forming AJs and controlling endothelial permeability through association with catenins and actin cytoskeleton45. MMC treatment leads to the depletion of VE-Cad and RAD51 from AJs, consequently disrupting barrier function. When CM containing the secreted VRC was added to ECs with junctions damaged by MMC, endothelial permeability and cellular levels of VE-Cad and RAD51 were restored. This suggests that the secreted VRC could be used therapeutically to repair endothelial damage and prevent vascular remodeling. The mechanisms underlying the release of the VRC and the identity and biological activities of other proteins released alongside the VRC remain unclear and require further investigation.
The nuclear function of RAD51, including DNA double-stranded break repair and DNA replication, is well established46; however, the cytoplasmic role of RAD51 remains unclear, despite a substantial fraction of RAD51 being localized in the cytoplasm47,48. We demonstrate that RAD51’s association with VE-Cad is required for VE-Cad protein stability at AJs and the protection of the EC barrier. The cytoplasmic region of VE-Cad that interacts with RAD51 overlaps with one of three LC3 motifs, which is known as an adaptor for the autophagosome membrane25. Thus, we speculate that the association of RAD51 protects VE-Cad from autophagosome-dependent degradation. All three LC3 motifs are 100% conserved among VE-Cad orthologs in vertebrate species25. Thus, we speculate that the RAD51–VE-Cad association in ECs and its role in protecting VE-Cad and EC junctional integrity are evolutionarily conserved. All 18 cadherin superfamily members contain three or four LC3 motifs25. This raises the possibility that RAD51 interacts with other cadherins and protects them from degradation.
Rats with the ΔCTD-BMPR2 mutation exhibit more severe PVOD phenotypes than their WT littermates, indicating that the truncation of the BMPR2 CTD and the impaired signaling pathway exacerbate vascular remodeling. We also demonstrate that small-molecule inhibitors targeting PKR or the ISR restore VE-Cad and RAD51 in the endothelium and reverse vascular remodeling in WT and Mut rats. Therefore, these inhibitors represent potential therapeutic options for patients with PVOD, irrespective of their BMPR2 gene status. Maladaptive ISR activation is linked to cognitive and neurodegenerative disorders, cancer and inflammation17,28. ISRIB administration has been found to restore memory impairment after traumatic brain injury49,50, alleviate cognitive impairments in Down syndrome51, mitigate the effects of aging52 and inhibit cancer growth53. Our study establishes a causal link between ISR activation and pulmonary vascular disease. Because ISRIB restores vascular endothelial homeostasis, it is plausible that cognitive improvements by ISRIB might be, in part, mediated by enhanced cerebrovascular function.
We show that introducing the ΔCTD-BMPR2 mutation exacerbates MMC-induced PVOD phenotypes, and ISRIB administration reverses PVOD phenotypes in MMC-treated Mut rats. These findings indicate possible crosstalk between the deregulated BMPR2 signaling pathway and an increase in the secretion of the VRC and/or activation of the ISR pathway. We showed previously that the depletion of BMPR2 is sufficient to diminish RAD51 levels in PMVECs, suggesting that BMPR2 mutation carriers might possess a reduced basal amount of RAD51 in the endothelium, which leads to reduced VE-Cad stability at AJs16.
While mutations in the BMPR2 gene account for ~70–80% of PAH7, a small number of patients with PVOD and the BMPR2 mutation have been reported9,54,55. Furthermore, a recent study found that 8.5% of patients with PAH carry biallelic EIF2AK4 mutations7. Biallelic LOF/E in EIF2AK4 decreases the expression of tribbles 3 (TRB3)56. We demonstrated previously that TRB3 binds to the BMPR2 CTD and protects BMPR2 from proteolytic degradation57. The depletion of TRB3 leads to the depletion of BMPR2 and inhibits its downstream signaling, suggesting a potential link between mutations in EIF2AK4 and the BMP signaling pathway via TRB3 (ref. 57) and hence a genetic overlap between PVOD and PAH. Finally, the observed genetic overlap between PVOD and PAH suggests that diagnosing PVOD or PAH based solely on genetic mutations may be imprecise. Notably, high levels of the VRC have been detected in the plasma of patients with PVOD, in contrast to patients with IPAH, patients with the BMPR2 mutation and PAH or control individuals, who showed no detectable levels of the VRC. This discovery underscores the potential of the circulating VRC as a diagnostic tool for PVOD, offering a more accurate method for distinguishing between these conditions.
Methods
Animal care and use
All animal experiments were conducted following the Institutional Animal Care and Use Committee guidelines of the University of California, San Francisco. The protocol number for the relevant animals and procedures approved by the Institutional Animal Care and Use Committee is AN200674–00 (title, Role of Growth Factor Signaling in Vascular Physiology; approval date, 5 July 2023). Sprague Dawley rats (8–9 weeks old) were housed at an ambient temperature of 25 ± 2 °C and 50% ± 5% relative humidity under a 12:12-h dark–light cycle in the institutional animal facility.
Generation of Bmpr2-mutant rats
Mut Sprague Dawley rats were constructed using TALEN technology at Taconic Biosciences. The sequences of the left and right arms of TALEN are listed in the Supplementary Information. Two lines of rats with monoallelic deletion of 2 bp (Δ2) in exon 13 (Bmpr2Δ2/+) or deletion of 26 bp (Δ26) in exon 13 (Bmpr2Δ26/+), resulting in frameshift mutations of Bmpr2 E503fs and Q495fs, respectively, were developed in parallel. Both strains and sexes were studied and compared to confirm the effects of Bmpr2 mutation on the development of PVOD with the analyzed parameters. WT (+/+) littermates were used as controls.
Administration of C16 and ISRIB to the PVOD animal model
Animals were housed in the vivarium of the cardiovascular research building at UCSF (San Francisco, USA). Both male and female Sprague Dawley rats (8–9 weeks old) were subjected to the following protocols to examine the effect of MMC and/or the small-molecule ISR inhibitor ISRIB or the PKR inhibitor C16. MMC was made by dissolving 2 mg MMC in 1 ml saline and was delivered to rats at 3 mg per kg through intraperitoneal (i.p.) injections. Saline was used as a vehicle solution for MMC treatment. The ISRIB solution was made by dissolving 5 mg ISRIB in 1 ml of dimethylsulfoxide (DMSO), followed by dilution to 1 mg ml−1, and was delivered to rats at 0.25 mg per kg through i.p. injections. The vehicle solution consisted of 1 ml DMSO and 4 ml saline. The C16 solution was made by dissolving 10 mg C16 in 1 ml DMSO, followed by dilution to a final concentration of 100 μg ml−1, and was delivered to rats at 33.5 μg per kg through i.p. injections. The vehicle solution consisted of 100 μl DMSO and 10 ml saline.
Protocol 1: MMC treatment.
Rats were randomly divided into MMC (3 mg per kg) or saline (vehicle)-exposed groups. MMC or saline was administered once by i.p. injection on day 0. Rats were euthanized 24 d after injecting MMC or vehicle (day 24). Hemodynamic measurements were made, RV hypertrophy was assessed, and tissue samples were collected.
Protocol 2: simultaneous MMC and ISRIB treatment for 24 d.
ISRIB (0.25 mg per kg) or vehicle (DMSO) was given i.p. at 30 min before the MMC (3 mg per kg) treatment on day 0. Rats were given ISRIB or vehicle i.p. three times a week until day 24 (total of nine injections) and euthanized on day 24. Hemodynamic measurements were made, right ventricle hypertrophy was assessed, and tissue samples were collected.
Protocol 3: simultaneous MMC and C16 treatment for 24 d.
C16 (33.5 μg per kg) or vehicle (DMSO) was given i.p. 30 min before the MMC (3 mg per kg) treatment on day 0, followed by C16 (33.5 μg per kg) or vehicle treatment on day 8 and day 16 (total of three injections) and euthanasia on day 24. Hemodynamic measurements were made, right ventricle hypertrophy was assessed, and tissue samples were collected.
Protocol 4: delayed ISRIB treatment for 8 or 16 d.
Rats were given MMC (3 mg per kg) or vehicle (saline) i.p. on day 0. For the 16-d treatment, ISRIB (0.25 mg per kg) or vehicle (DMSO) was given three times a week between day 8 and day 24 (total of six injections), and rats were euthanized on day 24. For the 8-d treatment, rats were given ISRIB (0.25 mg per kg) or vehicle three times a week between day 8 and day 16 (total of three injections) and euthanized on day 24. Hemodynamic measurements were made, RV hypertrophy was assessed, and tissue samples were collected.
Isolation of pulmonary artery smooth muscle cells
The PA was removed from anesthetized rats under sterile conditions and transferred to a culture dish with cold (4 °C) DMEM medium. After the fat tissue around the artery was removed, the artery was longitudinally cut and placed in another cell culture dish containing DMEM. We used a pair of ophthalmic curved tweezers to scrape the intima. The artery was cut into small tissue blocks. The ophthalmic curved tweezers were used to separate the medium from the artery by pressing and pushing the artery with its blunt back side. After half of the medium was removed, the same method was used to obtain another half. The medium was cut into squares of approximately 1 mm and transferred into cell culture plates. The plates were placed in a cell culture chamber for about 4 h to allow the small tissue blocks to adhere to the plates. DMEM containing 20% FBS was added, and the tissue blocks were incubated in the cell culture chamber without disturbance for the first 5 d. The PASMCs began to grow from the edge of the tissue blocks at about 8 d and became relatively confluent by approximately 16 d. PASMCs were identified through morphology and IF detection of α-SMA. The purity of the PASMCs was tested through multiple fluorescent staining with DAPI and an anti-α-SMA antibody (Supplementary Information).
Monocrotaline-induced rat pulmonary hypertension model
MCT was dissolved in 0.5 N HCl to 200 mg per kg (pH adjusted to 7.4 with 0.5 N NaOH) and then diluted with sterile water to 60 mg ml−1. MCT (60 mg per kg) or vehicle (PBS) was subcutaneously injected into the ventral thorax of rats. The animals were maintained under a 12-h light–dark cycle at 18–20 °C and 40–50% relative humidity for 32 d (food and water were provided ad libitum, and the animals were checked once daily), followed by phenotypic assessment.
Mouse models of pulmonary hypertension
Protein levels were quantified in whole-lung lysates and plasma samples of preclinical PH models: the Schistosoma mansoni-induced PH model and the CH-PH model, which are known to recapitulate critical features of PAH. For the Schistosoma model, S. mansoni eggs were obtained from infected mice from the Biomedical Research Institute (Rockville, MD). Mice (C57BL/6) were sensitized i.p. (240 eggs per g) and, 14 d later, intravenously (175 eggs per g) with S. mansoni eggs as described previously31. Seven days later, lung and plasma samples were collected for analysis. Mice that were not exposed to S. mansoni eggs were used as a control. For the CH model, mice (C57BL/6) were placed in a hypoxia chamber connected to a sensor that senses and maintains an oxygen concentration equivalent to 10% fraction of inspired oxygen (FiO2) inside the chamber by infusing nitrogen gas for 21 d. After hypoxia exposure, lung and plasma samples were collected for protein assessment. Mice in room air were used as a control.
Hemodynamic measurement and tissue histology
Animals were anesthetized with an i.p. injection of a ketamine–xylazine cocktail solution (1 ml ketamine (100 mg ml−1) and 100 μl xylazine (20 mg ml−1); injecting 300 μl per 250 g body weight). A tracheal cannula was then inserted, and the animals were ventilated with room air using a ventilator set to maintain respiration at 90 breaths per minute and tidal volume at 8 ml per kg body weight. The abdominal and thoracic cavities of the rat were opened carefully to avoid any blood loss, and a catheter was used for RVSP measurements. RVSP was measured while a consistently stabilized pressure wave was shown after the transducer was plugged into the RV apex. At the end of the experiments, hearts and lungs were perfused with PBS for blood removal. The Fulton index, or the weight ratio of the right ventricle divided by the sum of the left ventricle and the septum (RV/(LV + S)), was measured and calculated to determine the extent of RV hypertrophy. Lung, liver and heart tissues were fixed in 10% formalin for 24 h and then further processed for paraffin sectioning. Paraffinized lung tissue sections were used for H&E58 and Gomori’s trichrome staining59 according to the standard protocol. Images were acquired with a brightfield microscope with a color camera. Total areas of fibrotic lesions within each section were quantified using a threshold intensity program from ImageJ.
Assessment of vascular remodeling
To assess PA and PV muscularization, rat lung tissue sections (10 μm in thickness) were subjected to conventional H&E staining. External and internal diameters of a minimum of 50 transversally cut vessels in tissue blocks ranging from 25 to 80 μm were measured by determining the distance between the lamina elastica externa and the lumen in two perpendicular directions. The vessels were subdivided based on their diameter (microvessels, <50 μm; medium-sized vessels, 50–80 μm), and muscularization assessment was performed using ImageJ in a blinded fashion by a single researcher to reduce variability due to the operator, who was not aware of the group allocation of the samples being analyzed. The absolute value of the medial thickness was converted to a relative value by setting the medial thickness of vehicle-treated WT rats to 1. We also assessed the muscularization of PAs and PVs by the degree of α-SMA IF staining. IF signal intensity was quantitated with ImageJ, and the results are presented as a relative signal intensity by setting the value of vehicle-treated WT rats to 1. Images were acquired using a confocal microscope.
Casting of pulmonary vasculature with Microfil
Heparin (1,000 IU per kg) was injected intravenously 10 min before anesthesia. Rats were anesthetized using a ketamine–xylazine cocktail. After removing the anterior chest wall, a microperfusion tube was inserted and kept in the right ventricle for perfusion with PBS, which drained from the left atrium. The lungs were perfused to clear all blood, as evidenced by the lung tissue turning white. During the perfusion of PAs, a freshly dissolved Microfil polymer mixture (MV compound:MV diluent:MV agent, 5:5:1) was instilled via a 25G needle inserted into the PA from the incision through the RV wall by manual injection. The Microfil mixture was gently infused into the PA under a dissecting microscope until it reached the terminal branches of PAs and stopped within 2–3 s. The lungs were then kept at room temperature for approximately 90 min or overnight at 4 °C while covered with a wet paper towel to avoid desiccation. At the end of the experiment, the dissected lungs and hearts were rinsed with PBS for 10–15 min at room temperature. They were then dehydrated in 50%, 70%, 80%, 95% and 100% ethanol–water solutions (2 h each). After dehydration, the lungs were put into a methyl salicylate solution. They were photographed when the lungs became translucent and the Microfil was visible. The number of branches and junctions in the distal pulmonary vascular networks of five lobes were counted with ImageJ.
Perfusion of pulmonary vasculature with Evans blue dye
A 2% (wt/vol) EB solution was prepared by mixing EB in 0.9% NaCl, followed by filtering through a 0.22-μm filter. Rats were anesthetized with an isoflurane vaporizer set to 5% in 100% oxygen for 5 min. After the incision was made in the animal’s midline and the diaphragm was exposed, forceps were used to grasp the sternum and pull it toward the head of the animal, pressing the heart against the diaphragm until it was easily visible. A needle was inserted through the diaphragm into the LV, and 2% EB solution (6 μl per g) was injected with a 3-ml syringe capped with a 25G needle. We waited for ~5 min to allow the EB dye to circulate and confirmed successful administration of EB by observing the snout, paws and tail turning blue; the animals were euthanized, and we proceeded to tissue collection. The collected tissue was fixed in 4% paraformaldehyde overnight at 4 °C. After washing with 1× PBS with shaking at room temperature 3× for 30 min, the tissue was dehydrated with a methanol–water series: 20%, 40%, 60%, 80%, 100% (1 h each). After further washing with 100% methanol for 1 h, the tissue was incubated for 3 h with shaking in 66% dichloromethane–33% methanol at room temperature, followed by incubation in 100% dichloromethane 2× for 15 min with shaking. The tissue was then incubated in 100% dibenzyl ether approximately until the tissue became translucent and photographed. The permeability of the pulmonary vasculature of five lobes was examined by quantitating the intensity of EB staining with ImageJ.
Human plasma samples
All plasma samples were obtained following informed consent from the UK National Cohort Study of Idiopathic and Heritable Pulmonary Arterial Hypertension (ClinicalTrials.gov registration: NCT01907295; UK REC reference 13/EE/0203) following institutional guidelines and following informed consent. Healthy adult controls were recruited for comparison studies. Subsequent whole-blood sample collection was performed with written informed consent of the participants or their parents for use in gene-identification studies (UK Research Ethics Committee: 08/H0802/32) and processed as described before60. Blood samples for research were collected in 6-ml EDTA tubes using standard venepuncture protocols61. Plasma samples were subjected to centrifugation and stored at −80 °C before use. Patients diagnosed with IPAH (without BMPR2 mutation), PAH with BMPR2 mutation and PVOD, relatives of index patients and unrelated healthy controls were recruited at nine UK centers and followed up by a median of 7.9 years. All patients were diagnosed between March 1994 and November 2016, and diagnostic classification was made according to international guidelines62. Clinical, functional and hemodynamic characteristics at the time of PAH or PVOD diagnosis were prospectively entered into the database. The date of diagnosis corresponded to that of confirmatory right heart catheterization.
Human lung samples
Human lung tissues from patients with PH and control individuals were collected by the Pulmonary Hypertension Breakthrough Initiative (PHBI) in the US (http://www.ipahresearch.org/). Lung tissue from patients with PVOD and IPAH was obtained at the time of explant for lung transplantation. Control lung tissue was obtained from unsuccessful organ donors enrolled in the PHBI as control individuals. Clinical data for patients with PH have been published63. The present study was approved by both the Colorado Multiple Institutional Review Board (IRB) and the UCSF IRB. The collection of lung tissue was approved by the IRB at all lung transplant sites. The PHBI follows a standardized tissue-processing protocol for lung tissue processing, as detailed previously63.
Enzyme-linked immunosorbent assay
The amount of VE-Cad and RAD51 protein in the CM of PMVECs or human and rat plasma samples containing EDTA was quantitated using ELISA kits according to the manufacturer’s protocol. The Bradford protein estimation method was used to quantitate the relative concentration of total proteins in the CM or plasma, and the total protein amount was adjusted for sample volume. CM or plasma samples were diluted 1:50 and 1:20 in PBS before being applied to precoated ELISA plates. Plates were washed with PBS-T three times and incubated with respective secondary antibodies conjugated to streptavidin–horseradish peroxidase at room temperature for 2 h. The ELISA was developed in a dark room at room temperature with a colorimetric substrate comprising tetramethylbenzidine and stabilized hydrogen peroxide mixed in equal volumes. The absorbance was measured at 450 nm.
Cell culture and mitomycin C treatment
Human primary PMVECs were cultured in endothelial growth medium (EGM)-2 complete medium with supplements. All experiments were performed using low-passage cells (passages 3–8). Saline (vehicle) or MMC (150 μM) was added to the culture medium (EGM-2 medium supplemented with 0.02% FBS) of PMVECs at 60–70% confluency, and cells were treated for 2–14 h as indicated.
Transfection of small inhibitory RNA and plasmids
siRNA for the nontargeting control, RAD51, FBH1, NEDD4–1, NEDD4–2 and SMURF1 was transfected into PMVECs at 60–70% confluency. siRNA sequences are found in the Supplementary Information. Lipofectamine RNAiMAX 2000 (9.3 μl) was mixed with 750 μl Opti-MEM, followed by 5 min of incubation at room temperature. siRNA was mixed with 750 μl Opti-MEM at a final concentration of 100 nM. Furthermore, the Lipofectamine and siRNA mixtures were pooled and incubated for 20 min at room temperature. Following the incubation, the mixture was added to endothelial cells and placed at 37 °C. EGM-2 complete medium (10 ml) was added to endothelial cells after 5 h. Finally, the siRNA-transfected endothelial cells were collected after 48 h. Collected samples were subjected to either immunoblotting or RT–qPCR analysis to determine gene knockdown. For human FBH1 or RAD51 expression plasmid transfection, PMVECs were seeded in 6-well plates at a concentration of 270,000 cells per well; 24 h later, cells were transiently transfected with 1.5 μg of plasmid using FuGENE 6, according to the manufacturer’s instructions, for 2.5 h. The cells were washed twice with 1× PBS and allowed to rest at 37 °C for 40 h in complete EGM-2 medium. Transfected cells were treated with MMC (150 μM, 0.02% FBS) or vehicle (saline) for the indicated times. As a control, original pcDNA3.1(+) was used. Information regarding FBH1 and RAD51 expression plasmids is found in the Supplementary Information.
Alkaline comet (DNA damage) assay
To assess the extent of DNA damage in human PMVECs, we performed an alkaline comet assay using a commercial kit (Supplementary Information). Human PMVECs were transfected with siRad51 and siFbh1, treated with vehicle (saline) or MMC (150 μM) for 14 h and washed with ice-cold 1× PBS. Furthermore, cells were detached, centrifuged and suspended at 2 × 10⁵ cells per ml in ice-cold 1× PBS. A mixture of 50 μl of suspended cells and 500 μl LMAgarose was spread onto a slide and sited at 4 °C for 10 min in the dark. The slide was immersed in lysis solution for 60 min at room temperature. After careful removal of the lysis solution; slides were immersed in an alkaline unwinding solution for 30 min at room temperature in the dark. Following unwinding, electrophoresis was performed in an alkaline electrophoresis solution for 35 min at 4 °C. Electrophoresis run conditions were kept constant at 1 V cm−1 and 300 mA. Slides were carefully immersed in dH2O twice after removal of the alkaline electrophoresis buffer and then kept in 70% ethanol for 5 min in the dark at room temperature. Next, slides were air-dried at 37 °C for 15 min and stained with SYBR Gold for 30 min in the dark. Slides were viewed under a laser-scanning confocal microscope to detect nuclei with a comet-like elongated tail.
Nuclear and cytoplasmic fractionation
PMVECs were washed with 1× PBS twice, scraped off and pelleted by centrifuging at 4,500g for 5 min. Cells were then swelled by adding five volumes of lysis buffer (10 mM HEPES, pH 7.9, with 1.5 mM MgCl2, 10 mM KCl, 1 mM DTT and protease inhibitors) and homogenized. After centrifugation at 10,000g for 15 min, the supernatant was collected as a cytoplasmic fraction. The crude nuclear pellet was resuspended in 2/3 volume extraction buffer (20 mM HEPES, pH 7.9, with 1.5 mM MgCl2, 0.42 M NaCl, 0.2 mM EDTA, 25% (vol/vol) glycerol, 1 mM DTT and protease inhibitors) and homogenized with a tissue homogenizer. After centrifuging at 20,000g for 5 min, the supernatant was collected as a nuclear fraction.
Preparation of conditioned medium
PMVECs (passage 3–5) cultured in a 10-cm plate with 10 ml particle-free medium for 48 h at 70–80% confluency at the time of collection (3–4 × 10⁶ cells) were treated with vehicle (saline) or MMC for 14 h. Cells were then washed with 1× PBS three times. The culture medium was collected and centrifuged at 2,000g for 20 min at 4 °C to remove large cell debris. The supernatant was then filtered with a 0.22-μm-diameter filter and syringe to remove small cell debris and large vesicles and used as CM.
Immunoblot analysis
We used boiling lysis buffer (10 mM Tris-HCl, 1% SDS, 0.2 mM phenylmethylsulfonyl fluoride) to prepare whole protein cell lysates. Protease and phosphatase inhibitors (1:100) were added to the boiling lysis buffer. The boiling lysis buffer was directly added to cells, and samples were boiled for 10 min, followed by 35 min of centrifugation at 12,000 rpm. Rat tissue lysates were prepared in lysis buffer (1% Triton X-100, 150 mM NaCl, 50 mM Tris-Cl at pH 7.5, 1 mM EDTA). Supernatants were collected, and a NanoDrop was used to measure the total protein concentration. Protein samples were denatured in SDS sample buffer for 5 min at 95 °C, loaded onto a precast SDS–PAGE gel in equal amounts and subjected to electrophoresis. Nitrocellulose membranes were used to blot the gels and were blocked with 5% nonfat milk or 3% BSA in 1× Tris-buffered saline with 0.1% Tween-20 (1× TBST) for 1 h at room temperature. The membranes were incubated at 4 °C overnight with a primary antibody. Chemiluminescence signals were detected using SuperSignal West Dura Extended Duration and imaged using a LI-COR Imaging System. Antibody information is found in the Supplementary Information. The quantity of each protein was normalized to the amount of a loading control protein. Subsequently, its relative quantity was calculated by setting the amount of protein in the control (vehicle-treated) sample to 1.
Immunoprecipitation assay
Total cell lysates or CM of PMVECs treated with saline or MMC (150 nM) for 14 h, rat tissue samples or plasma samples were lysed in IP buffer (1% Triton X-100, 150 mM NaCl, 50 mM Tris-Cl at pH 7.5, 1 mM EDTA) supplemented with protease inhibitors (1:100 dilution) and phosphatase inhibitor (1:100 dilution). Lysates were nutated for 30 min at 4 °C, followed by centrifugation at 12,000g for 10 min, and supernatants were collected. One-tenth of the lysate was saved as an input sample for immunoblotting. The lysate was incubated with an anti-RAD51 antibody and anti-IgG (negative control) and nutated overnight at 4 °C, followed by adding protein A/G beads and rocking for 4 h at 4 °C. The magnetic beads were precipitated and rinsed three times with IP buffer for 5 min at 4 °C. The washed eluate was boiled at 95 °C for 8 min in sample-loading buffer and subjected to immunoblotting along with input. For the input samples, the quantity of the indicated protein was initially normalized to the amount of a loading control protein, such as β-actin or GAPDH. Subsequently, its relative quantity was calculated by setting the amount of protein in the vehicle-treated sample to 1. For IP samples, the amount of the indicated protein in the MMC-treated sample was presented with the protein amount in the control (vehicle-treated) sample set to 1.
RNA sequencing analysis
Total RNA was isolated from endothelial cells using a commercial kit. The quality of RNA was evaluated with a Bioanalyzer. RNA samples with RNA integrity number >8.0 were shipped to the Beijing Genome Institute for library preparation and sequencing. Around 70 million reads were obtained for each pooled sample. To read raw sequence data and set quality checks, we used FastQC version 0.72. FASTQ files were trimmed with Trimmomatic version 0.38.1 to remove low-quality reads and any adaptor sequences. The reads were mapped with HISAT2 version 2.1.0 to the human genome (hg38, GRCh38). After mapping, all BAM files were used as input for HTSeq-count version 0.91 to calculate transcript coverage. DESeq2 (version 2.11.40) was used to find deferentially expressed transcripts for each sequencing depth between samples. Deferentially expressed genes were kept if the adjusted P value was equal to or less than 0.05 and if a log2 (fold change) of 1 or more was observed. An integrative genomics viewer was used to analyze the data.
Chromatin immunoprecipitation
PMVECs treated with vehicle (saline) or MMC (150 nM) for 4 h were cross-linked with 1% formaldehyde for 15 min at room temperature, followed by quenching with 1 M glycine. Cells were washed with 1× PBS and lysed with lysis buffer (50 mM Tris-Cl, pH 8.1, 10 mM EDTA, 1% SDS and protease inhibitor). Genomic DNA was sheared to an average length of 200–500 bp by sonication, followed by clearing lysates by centrifugation at 12,000g for 10 min at 4 °C. The supernatant was incubated with protein A/G beads at 4 °C for 1 h, the pre-cleared sample was diluted 1:10 with dilution buffer (20 mM Tris-Cl, pH 8.1, 150 mM NaCl, 2 mM EDTA, 1% Triton X-100 and protease inhibitor), and 1/10 volume was kept as input before incubation with nonspecific IgG (control) or an anti-ATF4 antibody overnight at 4 °C, followed by incubation with protein A/G beads. Next, the beads were washed with buffer I (20 mM Tris-Cl, pH 8.1, 150 mM NaCl, 2 mM EDTA, 1% Triton X-100, 0.1% SDS), buffer II (20 mM Tris-Cl, pH 8.1, 500 mM NaCl, 2 mM EDTA, 1% Triton X-100, 0.1% SDS) and buffer III (10 mM Tris-Cl, pH 8.1, 250 mM LiCl, 1 mM EDTA, 1% NP-40, 1% deoxycholate) at 4 °C. The A/G beads were washed twice with cold TE buffer (10 mM Tris-Cl, pH 8.1, 1 mM EDTA) and incubated in 250 μl elution buffer (200 mM NaHCO3, 1% SDS) at room temperature twice for 15 min. The eluates were mixed with 1/25 volume 5 M NaCl and incubated at 65 °C for 4 h. One-fiftieth volume of 0.5 M EDTA, 1/25 volume of Tris-Cl, pH 6.5 and proteinase K (final concentration of 100 μg ml−1) were added, and samples were incubated at 45 °C for 1 h. Precipitated DNA fragments were purified with a commercial kit, followed by RT–qPCR analysis. PCR primer sequences and the DNA purification kit are found in the Supplementary Information.
Quantitative PCR with reverse transcription
Total RNA was isolated from PMVECs and rat lung tissue and subjected to cDNA preparation by the reverse transcription reaction with a commercial kit. qPCR analysis was performed in triplicate with a commercial kit. The relative expression values were determined by normalization to GAPDH or Gapdh transcript levels and calculated using the ΔΔCt method. RT–qPCR primer sequences and the kits are found in the Supplementary Information.
Proximity ligation assay
PMVECs were grown on coverslips and treated with vehicle (saline) or MMC (150 nM) for 14 h. Cells were washed three times with 1× PBS, fixed with 4% paraformaldehyde and permeabilized with 0.15% TBST for 30 min. Cells were then blocked using 5% goat serum in TBST for 1 h and subjected to the PLA with anti-RAD51 and anti-VE-Cad antibodies using a commercial kit, and a confocal microscope was used to capture images (Supplementary Information).
Treatment of PMVECs with ISRIB or C16
ISRIB (200 nM) or C16 (500 nM) was added to the culture medium of PMVECs 15 min before vehicle (saline) or MMC (150 nM) treatment for 14 h. For another experiment, 2 h after vehicle (saline) or MMC (150 nM) treatment, ISRIB (200 nM) or C16 (500 nM) was added to the culture medium of PMVECs, and samples were incubated for 14 h. After the indicated time, the cells were subjected to the TVP assay.
Transwell vascular permeability assay
PMVECs were seeded in the upper ‘apical’ chamber of a transwell insert coated with collagen IV. After culture for 5 d after confluence, PMVECs were treated with MMC (150 nM) or vehicle (saline) for the indicated times. One hour before the sampling time point, stock concentrations of molecular tracers were added to the upper chamber to bring the final concentration to 0.5 mg ml−1. For fluorometry analysis, samples were collected from the upper (luminal) and lower (abluminal) chambers. The molecular tracers were sodium fluorescein (molecular weight, ~0.4 kDa), EB (molecular weight, ~1 kDa) and FITC-dex (molecular weight, ~40 kDa). The contribution of the molecular tracers in the bottom chamber was used as a proxy to assess the barrier functionality of PMVECs. The concentration of each tracer was determined using a standard curve for FCI or Ps. The Ps value was calculated as follows: Ps = [A]/t × 1/A × V/[L], where [A] is the abluminal concentration, t is time (in seconds), A is the area of the membrane (in cm2), V is the volume of the abluminal chamber and [L] is the luminal concentration. FCI or Ps for each tracer is represented as the mean ± s.e.m. from three independent experiments.
Transendothelial electrical resistance assay
PMVECs’ barrier function was determined by measuring the cell–cell adhesive resistance to electric current. PMVECs were seeded onto a transwell precoated with collagen IV. After culturing for 5 d after confluency, the transwells were subjected to total electrical resistance measurement, and recorded TEER values were normalized to the baseline. The time when MMC (150 nM) or vehicle (saline) was added was set to zero. TEER changes were recorded and submitted for statistical analyses at specified time points.
Immunofluorescence
PMVECs were grown on coverslips till they reached 60–70% confluence and were transfected with siRNA species or the RAD51 expression plasmid followed by treatment with vehicle (saline) and MMC (150 nM), permeabilized, blocked and subjected to primary antibody incubation. Anesthetized rats were flushed with 1× PBS and perfused with 4% (wt/vol) paraformaldehyde. Organs such as the lung, the heart and the liver were post-fixed in 4% paraformaldehyde, transferred to 1× PBS after 24 h and subjected to paraffin embedding. The right bronchus of the flushed lungs was sutured, the left lung was inflated with 1% low melt agarose for fixation and paraffin embedding, and the right lung was split for snap freezing for protein and RNA studies. IF was performed using the antibodies listed in the Supplementary Information. For SMA and EC staining, sections were subjected to deparaffinization, antigen retrieval and permeabilization, followed by blocking and primary antibody incubation overnight at 4 °C. A solution of Alexa Fluor secondary antibodies was applied for 2 h at room temperature. IF images were acquired using a confocal microscope and a phase-contrast microscope and analyzed with ImageJ. Antibodies used are found in the Supplementary Information.
In vivo EdU labeling
To determine cellular proliferation, EdU (50 mg per kg body weight) was administered to rats by i.p. injection 24 h before killing following a previously published protocol64. After EdU incorporation, the lung was isolated and fixed in 4% paraformaldehyde, and paraffin-embedded sections were mounted on slides. Lung sections were permeabilized with 0.5% Triton X-100 in PBS, and EdU labeling was detected using a commercial kit according to the manufacturer’s protocol. The lung sections were co-stained for an endothelial cell marker, CD31 (Supplementary Information), and a phase-contrast microscope was used to detect signals.
Annexin V staining
To determine apoptosis, rat lung FFPE sections were stained with Annexin V (Supplementary Information) and co-stained for the endothelial cell marker CD31, and a phase-contrast microscope was used to detect IF signals.
GST fusion protein pulldown assay
Recombinant proteins, which contain the entire cytoplasmic region of mouse VE-Cad (Cyto; amino acids 621–789), the cytoplasmic region except with amino acids 780–784 deleted (Δ5), the proximal region (amino acids 621–689), the middle region (amino acids 661–730) and the distal region (amino acids 715–789), all fused to GST7, were used for mapping the RAD51-interaction site. Escherichia coli BL21 was transformed to express each GST fusion protein construct, and the expression of GST fusion protein was induced with 0.1 mM isopropyl-β-D-thiogalactoside at 37 °C for 4 h. After lysing bacteria, GST fusion protein was isolated by affinity chromatography on glutathione Sepharose 4B beads. PMVEC lysates (50 μg) were incubated with 30 μl of a 50% slurry of GST fusion protein-conjugated agarose beads for 2 h at 4 °C under constant agitation. After washing the beads five times with buffer (10 mM Tris, pH 8, 1 mM EDTA, pH 8, 150 mM NaCl, 5 mM DTT, 1% Triton X-100, 1× protease inhibitor cocktail), proteins associated with the GST fusion protein were eluted by boiling for 5 min in SDS sample buffer, subjected to SDS–PAGE and analyzed by immunoblotting with an anti-RAD51 antibody (Supplementary Information).
In vivo puromycin-incorporation assay
WT rats were injected once with either vehicle (saline) or MMC (3 mg per kg). Twenty-four days after injection, the rats were perfused with 100 μg ml−1 puromycin in 1× PBS via intracardiac injection. Ten minutes after the perfusion, lungs were harvested, and total lung lysates were subjected to SDS–PAGE. Immunoblotting was conducted using an anti-puromycin antibody.
Transmission electron microscopy
PMVECs were grown on a glass-bottom dish and fixed with 2 ml of fixative (2.5% glutaraldehyde and 2.5% paraformaldehyde in 1× PBS, pH 7.4) overnight. Samples were rinsed (three times, 5 min, room temperature) with 1× PBS and immersed in 1% osmium tetroxide with 1.6% potassium ferricyanide in 1× PBS for 30 min. Samples were rinsed (three times, 5 min, room temperature) with buffer and briefly washed with distilled water (once, 1 min, room temperature) before being subjected to an ascending ethanol gradient followed by pure ethanol. Samples were progressively infiltrated with Epon resin and polymerized at 60 °C for 24 h. After polymerization, glass coverslips were removed with razor blades. Samples were oriented for cross-section cutting of cells and mounted on a blank resin block with cyanoacrylate glue for sectioning. Thin sections (80 nm) were cut using a microtome and collected onto formvar-coated slot grids. The grids were post-stained with 2% uranyl acetate, followed by Reynolds’ lead citrate, for 5 min each. Sections were imaged using a transmission electron microscope, and data were recorded using a Gatan camera with its software.
Statistics and reproducibility
Each experiment was carried out independently at least three times. All numerical data are presented as mean ± s.e.m. Statistical analysis was performed using Microsoft Excel and GraphPad Prism. Datasets with two groups were subjected to Student’s t-test, unpaired, with equal variance. By contrast, a comparison among three or more groups was made by ANOVA followed by Tukey’s post hoc corrections. Analysis of variance was applied to experiments with multiple parameters, one way or two way, as appropriate. Significance was analyzed using a post hoc Tukey test and indicated as P values where required.
Extended Data
Extended Data Fig. 1 |. Overexpression of Rad51 prevents MMC-mediated DNA damage, and MMC does not induce apoptosis.

(a) PMVECs (5 × 10³ cells) transfected with empty vector (mock) or Rad51 expression plasmid (Rad51) were subjected to the comet assay. The bar graph indicates the levels of DNA damage as a percentage of nuclei with damaged DNA out of total nuclei as mean ± SEM. Approximately one hundred nuclei per condition were examined. n = 5 independent samples. (b) PMVECs (1 × 10⁶ cells) were transfected with empty vector (mock) or Rad51 expression plasmid (+Rad51), followed by vehicle or MMC treatment for 14 h. Total cell lysates were subjected to immunoblot of VE-Cad, Rad51, γH2AX, and β-actin (control). (c) PMVECs were treated with vehicle (Veh), MMC for 14 h or 0.4 mM hydrogen peroxide (H2O2) for 2 h, followed by fluorescence staining of Annexin V (green) and DAPI (blue). Annexin V-positive cells’ fraction (%) is shown as mean ± SEM. Scale bar=10 mm Approximately one hundred cells per condition were examined. A similar result was obtained by flow cytometric analysis of FITC-Annexin V staining. The number of Annexin V-positive cells is shown as mean ± SEM. About 300 cells and 1.5 × 10⁶ cells per condition were analyzed by fluorescent staining and flow cytometry. Because of the autofluorescence of PMVECs, the signals of unstained PMVECs were used to set the gate for FITC-Annexin V-positive cells. A green rectangle indicates Annexin V-positive cells. Data are analyzed by one-way ANOVA with Tukey’s post-hoc test (c, d); two-way ANOVA With Tukey’s post-hoc test (a).
Extended Data Fig. 2 |. Transfer of VE-Cad and Rad51 to PMVECs damaged by MMC and transcriptional activation of ATF4 target genes in MMC-treated PMVECs.

(a) The levels of intracellular VE-Cad, Rad51, and β-actin (loading control) protein in the MMC-treated PMVECs (recipient cells; 1 × 10⁶ cells) after the incubation with the CM from PMVECs (1 × 10⁶ cells) treated with vehicle (CMveh) or MMC (CMMMC) for 14 h were examined by immunoblot analysis. (b) IF staining of PMVECs treated with CMveh or CMMMC (5 × 10³ cells) with an anti-VE-Cad antibody (green). Cell nuclei were stained with DAPI (blue). Scale bar=10 mm. (c) CM was collected from PMVECs following two h of MMC treatment and was immediately reintroduced to the donor cells’ CM after MMC was removed from the CMMMC (−MMC, indicated in red), or it was added without removing MMC ( + MMC, indicated in blue). Duplicate samples were used. Non-specific IgG (IgG) was used as a negative control for IP. Subsequently, following a 14 h incubation period, the VRC amount in the donor cells was evaluated. (d) RNA-seq data (MMC 0 h vs 4 h) is plotted on a volcano map. X-axis and Y-axis indicate p-value (−Log10) and fold change (FC) (Log2). Annotated red dots indicate known ATF4 targets. n = 3 independent RNA samples per condition. Data are analyzed by one-way ANOVA with Tukey’s post-hoc test (c).
Extended Data Fig. 3 |. The analysis of apoptotic cells by Annexin V staining and PH phenotypes in Schistosomia-induced PH (Sch-PH).

(a) Schematic description of the experimental procedure. Lung samples of WT rats treated with vehicle or MMC were harvested on days 8, 16, and 24. IF staining of the apoptosis marker Annexin V (green) and CD31(red) for vascular endothelial cells. Hoechst (blue) is showing nuclei. Annexin V and CD31 stain images were merged and displayed in the “Merge” row. The intensity of the Annexin V signal in the CD31-positive endothelial layer was quantitated by ImageJ and shown as mean ± SEM. n = 4–7 independent samples per condition. White asterisks indicate pulmonary arteries. Scale bar= 10 μm. (b) Right ventricular (RV) systolic pressure (RVSP) and RV to left ventricular (LV)+septum weight ratio (RV/LV + S) were measured in control, Sch-PH, and CH-PH mice and shown as mean ± SEM. n = 5 independent samples per group. (c) The RVSP and RV/LV + S ratio in a vehicle or MCT-administered rats were measured and shown as mean ± SEM. n = 7–10 independent samples per group. Data are analyzed by two-sided unpaired student’s t-test (b, c); one-way ANOVA with Tukey’s post-hoc test (a).
Extended Data Fig. 4 |. Characterization of heterozygous BMPR2 mutant rats.

(a) The top 2 panels show BMPR2 gene sequencing results of E503fs (Δ2/+) rat and Q495fs (Δ26/+) rat, where the bases shown in red or in the red rectangle are mutations introduced. Blue letters show the protein sequence after the mutation. Asterisks indicate stop codons. (b) WT or Mut cells were treated with increasing concentrations of BMP4 for 2 h, and total cell lysates from 1 × 10⁶ cells were subjected to immunoblot with anti-phospho-Smad1/5/8 (p-Smad1/5/8), anti-total Smad1 (t-Smad1), anti-GAPDH (loading control), and anti-BMPR2(CTD) antibody. (c) WT or Mut cells (1 × 10⁶ cells) were treated with 100 pM of BMP4 for the indicated time (h), and total cell lysates were subjected to immunoblot with anti-p-Smad1/5/8, anti-t-Smad1, anti-GAPDH (loading control), and anti-BMPR2(CTD) antibody. Total RNAs isolated from the same cells were subjected to qRT-PCR of BMP-Smad1/5/8 target genes, Id3 and Smad6. Levels of Id3 and Smad6 mRNAs relative to GAPDH are shown by mean ± SEM. n = 3. Data are analyzed by one-way ANOVA with Tukey’s post-hoc test (c).
Extended Data Fig. 5 |. ISRIB does not affect the p-eIF2α amount, PH phenotypes in males and females are indistinguishable, physiological measurements of WT and Mut rats and lack of vascular remodeling and ISR activation in the heart and liver after MMC treatment.

(a) Lung lysates from vehicle-, MMC-, or MMC + ISRIB-treated WT and Mut rats were subjected to immunoblot analysis of p-eIF2α, t-eIF2α, and β-actin (loading control) in triplicate. n = 3 independent samples per condition. (b) p-eIF2α/t-eIF2α ratio is shown as mean ± SEM. n = 3 independent samples per condition. (c) RVSP and RV/LV + S ratio in female (orange) and male (blue) WT and Mut rats were measured 24 days after the administration of the vehicle of MMC and shown as mean ± SEM. M and F stand male and female. n = 3–5 independent samples per condition. The two-way analysis of variance was performed. (d) lung weight, lung weight/body weight ratio, % body weight change, liver weight/body weight ratio, heart weight/body weight ratio, and kidney weight/body weight ratio of WT or Mut rats subjected to ISRIB (24-days treatment) are shown as mean ± SEM. n = 4–44 independent samples per group. (e) Heart and liver were harvested from WT rats 24 days after injecting vehicle (saline) or MMC (3 mg/kg), followed by H&E staining. Arrows indicate vessels. Scale bar=10 μm. (f) Immunoblot analysis of ATF4, cardiac troponin T (cTnT; loading control for the heart), and β-actin (loading control for liver) using heart and liver lysates harvested from WT and Mut rats 24 days after the treatment with the vehicle of MMC. n = 3 independent samples per group. (g) Heart and liver lysates from WT rats treated with vehicle (24d) or MMC (8d or 24d) were subjected to anti-puromycin immunoblot and anti-GAPDH blot (loading control). The relative levels of puromycin-labeled proteins normalized by GAPDH were quantitated and shown as mean ± SEM. n = 4 independent samples. (h) Pulmonary vasculature of WT and Mut rats treated with vehicle or MMC with or without ISRIB was cast by Microfil on day 24 (d24), and holistic images of a lobe are shown as black and white images. Scale bar= 0.5 cm. The number of branches and junctions (per cm2) of distal pulmonary vessels was counted and shown as mean ± SEM. n = 3 independent samples per group. Data are analyzed by one-way ANOVA with Tukey’s post-hoc test (b, c, d, g, h).
Extended Data Fig. 6 |. Examining the pulmonary vascular permeability in vivo, the amount of Rad51 and VE-Cad in the plasma of WT and Mut rats after MMC treatment, ATF4 recruitment to the PKR gene upon MMC treatment is diminished by ISRIB, and administration of C16 prevents reduction of the distal pulmonary vessel density mediated by MMC.

(a) The permeability of pulmonary vasculature was assessed by injecting Evans Blue dye in WT and Mut rats administered with vehicle or MMC with or without ISRIB or C16. The lung was harvested on day 24, and the image was taken after the lung became translucent. Scale bar=0.5 cm. (b) The relative intensity of EB staining of the lung in WT and Mut rats was quantitated by ImageJ and shown as mean ± SEM. n = 4 independent samples. (c) The amount of VE-Cad and Rad51 in the plasma of WT and Mut rats after MMC treatment (24d) were measured by ELISA and plotted as mean ± SEM. n = 9 independent samples per group. (d) ChIP assay was performed in PMVECs (1 × 10⁶ cells) treated with vehicle, MMC, or MMC + ISRIB for four h with anti-ATF4 antibody, followed by PCR amplification of intron 1 of the PKR gene that contains three ATF4 consensus binding motifs. The result is shown as fold enrichment over the input sample as mean ± SEM. n = 6 independent samples. (e) The pulmonary vessels in WT rats treated with vehicle or MMC with or without C16 were cast with Microfil. After harvesting the lung, the image of the lobe was taken and presented after converting it to the black and white image. Distal pulmonary vessels in the area indicated by the orange box are magnified and shown below. Scale bar=0.5 cm. The number of branches and junctions (per cm2) of distal pulmonary vessels was counted and shown as mean ± SEM. n = 3 independent samples per group. Data are analyzed by one-way ANOVA with Tukey’s post-hoc test (b, c, d, e).
Extended Data Fig. 7 |. The pulmonary vascular phenotypes of two lines of BMPR2 mutant rats following MMC treatment are indistinguishable.
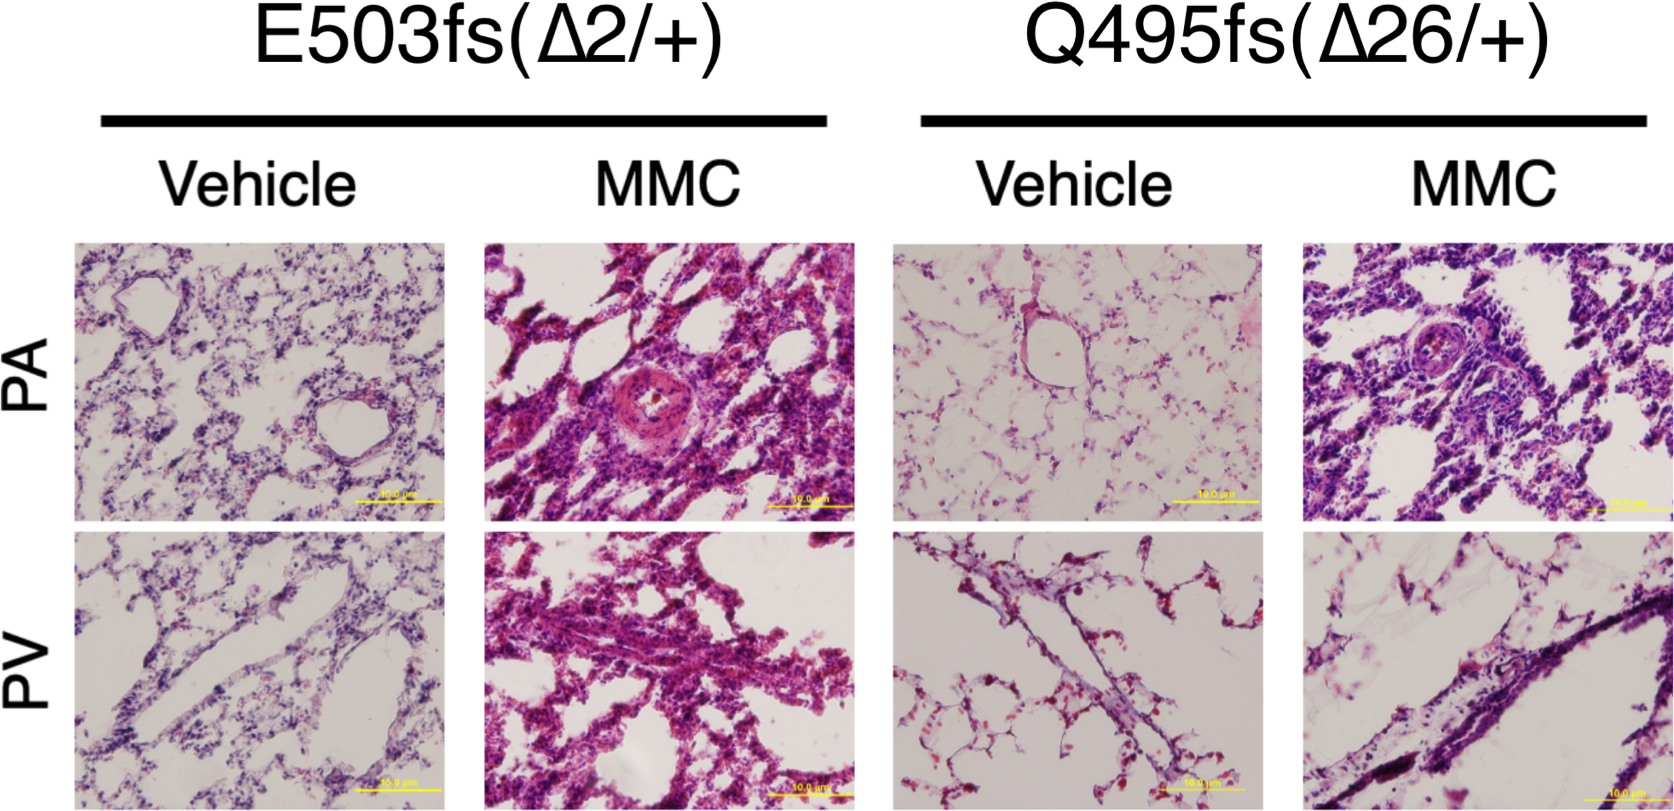
Representative H&E images of pulmonary vasculature exhibit similar phenotypes in E503fs (Δ2/+) and Q495fs (Δ26/+) rats 24 days after vehicle or MMC administration. Scale bar=10 μm.
Extended Data Fig. 8 |. PVOD phenotypes are evident as early as eight days after MMC administration, and delayed treatment with ISRIB attenuates ISR activation and vascular phenotypes.

(a) RVSP and RV/LV + S ratio in WT rats was measured eight days after the administration of vehicle or MMC and shown as mean ± SEM. n = 6 independent samples. (b) To examine the morphology of the pulmonary arteries (PAs) and veins (PVs), lungs were harvested from WT rats eight days after administering vehicle or MMC and subjected to H&E staining. An asterisk indicates the location of the vessels. Scale bar=10 mm. (c) WT rats administered with vehicle or MMC with or without 16-day (16d) or 8-day (8d) treatment with ISRIB were harvested on day 24, and the lung weight/body weight ratio was examined. n = 5–11 per condition. (d) The lung lysates of vehicle- or MMC-treated WT rats with or without 16-day or 8-day treatment with ISRIB were subjected to immunoblot of indicated proteins. β-actin is loading control. Quantitation of these blots is shown in Fig. 8e. n = 2–3 per condition. Data are analyzed by two-sided unpaired student’s t-test (a); one-way ANOVA with Tukey’s post-hoc test (c).
Extended Data Fig. 9 |. ISRIB promotes the proliferation of vascular endothelial cells in the MMC-treated rats.

Scheme of delayed ISRIB treatment and EdU staining (16d and 8d treatment). WT rats were administered with vehicle or MMC on day 0 and treated with ISRIB starting on day 8 for 8 days (8d) or 16 days (16d). The EdU staining (green) was performed on day 8 (d8) or day 24 (d24). The lung section was co-stained with the endothelial marker CD31 (red) and Hoechst (blue for nuclei staining). The EdU and CD31 stain images were merged and shown in the “Merge” row. The intensity of the EdU signal in the CD31-positive vascular endothelial layer was quantitated by ImageJ and shown as mean + SEM. n = 7–14 independent samples per condition. White asterisks indicate pulmonary arteries. Scale bar= 10 μm. Data are analyzed by one-way ANOVA with Tukey’s post-hoc test.
Extended Data Fig. 10 |. Release of VE-Cad and Rad51 into the plasma in patients with PVOD.

Human patients with PVOD, IPAH, and PAH with BMPR2 mutations (PAH-BR2Mut) and non-PAH control individuals (n = 10 per group) were subjected to immunoblot with anti-VE-Cad, anti-Rad51, and anti-Transferrin (loading control) antibody. #1–10 indicate plasma samples from ten individuals. The relative amounts of VE-Cad and Rad51 normalized by transferrin are quantitated and shown as mean ± SEM. n = 10 independent samples per condition. Data are analyzed by one-way ANOVA with Tukey’s post-hoc test.
Supplementary Material
Acknowledgements
We thank R.M. Tuder, A. Gandjeva (University of Colorado Anschutz Medical Campus) and the PHBI for providing human lung samples and the UK National Cohort of Idiopathic and Heritable PAH for providing human plasma samples. We thank D. Jorgens and R. Zalpuri at the University of California Berkeley Electron Microscope Laboratory for their advice and assistance in experiment planning, electron microscopy sample preparation and data collection. Other microscopy data were acquired at the Center for Advanced Light Microscopy—CVRI Microscopy Core on microscopes. We also thank X. Jiang (San Yat-Sen University), S. Vattulainen-Collanus (Blueprint Genetics), T.A. Desai (UCSF and Brown University), A. Arvind (UCB), S. Gupta (UCSB), S. Dhami (Santa Clara University) and Y. Yao (Tsinghua University) for technical advice and support. We thank K. Ebnet (University of Münster) for the gift of GST-VE-Cad fusion constructs; K. Atabai, B. Wang and G. Huang (UCSF) for sharing reagents; and members of Hata laboratory for critical discussion. Grant funding was provided by the National Heart, Lung, and Blood Institute (R01HL132058, R01HL153915 and R01HL164581) and the Tobacco-Related Disease Research Program (28IR-0047) to A.H.; by the American Heart Association (19CDA34730030), the Cardiovascular Medical Research Fund and a United Therapeutics Jenesis Innovative Research Award to R.K.; and by the National Heart, Lung, and Blood Institute (R01HL135872 and P01HL152961) to B.B.G. N.W.M. is supported by a Programme Grant from the British Heart Foundation (RG/19/3/34265) and a Personal Chair Award (CH/09/001/25945). The UK National Cohort of Idiopathic and Heritable PAH is supported by the British Heart Foundation (SP/12/12/29836), the BHF Cambridge Centre of Cardiovascular Research Excellence and the UK Medical Research Council (MR/K020919/1). The PHBI is supported by the Cardiovascular Medical Research and Education Fund and R24HL123767.
Footnotes
Competing interests
The authors declare no competing interests.
Extended data is available for this paper at https://doi.org/10.1038/s44161-024-00495-z.
Supplementary information The online version contains supplementary material available at https://doi.org/10.1038/s44161-024-00495-z.
Peer review information Nature Cardiovascular Research thanks Lena Claesson-Welsh, Rienk Nieuwland, Paul Yu and the other, anonymous, reviewer(s) for their contribution to the peer review of this work.
Reprints and permissions information is available at www.nature.com/reprints.
Reporting summary
Further information on research design is available in the Nature Portfolio Reporting Summary linked to this article.
Data availability
All data supporting the findings in this study are included in the main article and its associated files. All RNA-seq data can be found under the accession number GSE229404 in the NCBI Gene Expression Omnibus database. Source data are provided with this paper.
References
- 1.Montani D et al. Pulmonary veno-occlusive disease. Eur. Respir. J. 47, 1518–1534 (2016). [DOI] [PubMed] [Google Scholar]
- 2.Shackelford GD, Sacks EJ, Mullins JD & McAlister WH Pulmonary venoocclusive disease: case report and review of the literature. AJR Am. J. Roentgenol. 128, 643–648 (1977). [DOI] [PubMed] [Google Scholar]
- 3.Eyries M et al. EIF2AK4 mutations cause pulmonary veno-occlusive disease, a recessive form of pulmonary hypertension. Nat. Genet. 46, 65–69 (2014). [DOI] [PubMed] [Google Scholar]
- 4.Best DH et al. EIF2AK4 mutations in pulmonary capillary hemangiomatosis. Chest 145, 231–236 (2014). [DOI] [PMC free article] [PubMed] [Google Scholar]
- 5.Morrell NW et al. Targeting BMP signalling in cardiovascular disease and anaemia. Nat. Rev. Cardiol. 13, 106–120 (2016). [DOI] [PMC free article] [PubMed] [Google Scholar]
- 6.Morrell NW et al. Genetics and genomics of pulmonary arterial hypertension. Eur. Respir. J. 53, 1801899 (2019). [DOI] [PMC free article] [PubMed] [Google Scholar]
- 7.Aldred MA, Morrell NW & Guignabert C New mutations and pathogenesis of pulmonary hypertension: progress and puzzles in disease pathogenesis. Circ. Res. 130, 1365–1381 (2022). [DOI] [PMC free article] [PubMed] [Google Scholar]
- 8.Oriaku I et al. A novel BMPR2 mutation with widely disparate heritable pulmonary arterial hypertension clinical phenotype. Pulm. Circ. 10, 2045894020931315 (2020). [DOI] [PMC free article] [PubMed] [Google Scholar]
- 9.Runo JR et al. Pulmonary veno-occlusive disease caused by an inherited mutation in bone morphogenetic protein receptor II. Am. J. Respir. Crit. Care Med. 167, 889–894 (2003). [DOI] [PubMed] [Google Scholar]
- 10.Ranchoux B et al. Chemotherapy-induced pulmonary hypertension: role of alkylating agents. Am. J. Pathol. 185, 356–371 (2015). [DOI] [PubMed] [Google Scholar]
- 11.Perros F et al. Mitomycin-induced pulmonary veno-occlusive disease: evidence from human disease and animal models. Circulation 132, 834–847 (2015). [DOI] [PubMed] [Google Scholar]
- 12.Doll DC, Ringenberg QS & Yarbro JW Vascular toxicity associated with antineoplastic agents. J. Clin. Oncol. 4, 1405–1417 (1986). [DOI] [PubMed] [Google Scholar]
- 13.Manaud G et al. Comparison of human and experimental pulmonary veno-occlusive disease. Am. J. Respir. Cell Mol. Biol. 63, 118–131 (2020). [DOI] [PubMed] [Google Scholar]
- 14.Chen Z, Zhang J, Wei D, Chen J & Yang J GCN2 regulates ATF3–p38 MAPK signaling transduction in pulmonary veno-occlusive disease. J. Cardiovasc. Pharmacol. Ther. 26, 677–689 (2021). [DOI] [PubMed] [Google Scholar]
- 15.Zhang C et al. Mitomycin C induces pulmonary vascular endothelial-to-mesenchymal transition and pulmonary veno-occlusive disease via Smad3-dependent pathway in rats. Br. J. Pharmacol. 178, 217–235 (2021). [DOI] [PubMed] [Google Scholar]
- 16.Vattulainen-Collanus S et al. Bone morphogenetic protein signaling is required for RAD51-mediated maintenance of genome integrity in vascular endothelial cells. Commun. Biol. 1, 149 (2018). [DOI] [PMC free article] [PubMed] [Google Scholar]
- 17.Costa-Mattioli M & Walter P The integrated stress response: from mechanism to disease. Science 368, eaat5314 (2020). [DOI] [PMC free article] [PubMed] [Google Scholar]
- 18.Donnelly N, Gorman AM, Gupta S & Samali A The eIF2α kinases: their structures and functions. Cell. Mol. Life Sci. 70, 3493–3511 (2013). [DOI] [PMC free article] [PubMed] [Google Scholar]
- 19.Ueda H et al. Association of the T-cell regulatory gene CTLA4 with susceptibility to autoimmune disease. Nature 423, 506–511 (2003). [DOI] [PubMed] [Google Scholar]
- 20.Vestweber D VE-cadherin: the major endothelial adhesion molecule controlling cellular junctions and blood vessel formation. Arterioscler. Thromb. Vasc. Biol. 28, 223–232 (2008). [DOI] [PubMed] [Google Scholar]
- 21.Lampugnani MG, Dejana E & Giampietro C Corrigendum: vascular endothelial (VE)-cadherin, endothelial adherens junctions, and vascular disease. Cold Spring Harb. Perspect. Biol. 9, a029322 (2017). [DOI] [PMC free article] [PubMed] [Google Scholar]
- 22.Beard RS Jr. et al. Non-muscle Mlck is required for β-catenin- and FoxO1-dependent downregulation of Cldn5 in IL-1β-mediated barrier dysfunction in brain endothelial cells. J. Cell Sci. 127, 1840–1853 (2014). [DOI] [PMC free article] [PubMed] [Google Scholar]
- 23.Alam MS Proximity ligation assay (PLA). Methods Mol. Biol. 2422, 191–201 (2022). [DOI] [PubMed] [Google Scholar]
- 24.Giannotta M, Trani M & Dejana E VE-cadherin and endothelial adherens junctions: active guardians of vascular integrity. Dev. Cell 26, 441–454 (2013). [DOI] [PubMed] [Google Scholar]
- 25.Gugnoni M et al. Cadherin-6 promotes EMT and cancer metastasis by restraining autophagy. Oncogene 36, 667–677 (2017). [DOI] [PubMed] [Google Scholar]
- 26.Lamark T & Johansen T Mechanisms of selective autophagy. Annu. Rev. Cell Dev. Biol. 37, 143–169 (2021). [DOI] [PubMed] [Google Scholar]
- 27.Herren B, Levkau B, Raines EW & Ross R Cleavage of β-catenin and plakoglobin and shedding of VE-cadherin during endothelial apoptosis: evidence for a role for caspases and metalloproteinases. Mol. Biol. Cell 9, 1589–1601 (1998). [DOI] [PMC free article] [PubMed] [Google Scholar]
- 28.Pakos-Zebrucka K et al. The integrated stress response. EMBO Rep. 17, 1374–1395 (2016). [DOI] [PMC free article] [PubMed] [Google Scholar]
- 29.Romano PR et al. Autophosphorylation in the activation loop is required for full kinase activity in vivo of human and yeast eukaryotic initiation factor 2α kinases PKR and GCN2. Mol. Cell. Biol. 18, 2282–2297 (1998). [DOI] [PMC free article] [PubMed] [Google Scholar]
- 30.Singh M & Patel RC Increased interaction between PACT molecules in response to stress signals is required for PKR activation. J. Cell. Biochem. 113, 2754–2764 (2012). [DOI] [PubMed] [Google Scholar]
- 31.Kumar R et al. TGF-β activation by bone marrow-derived thrombospondin-1 causes Schistosoma- and hypoxia-induced pulmonary hypertension. Nat. Commun. 8, 15494 (2017). [DOI] [PMC free article] [PubMed] [Google Scholar]
- 32.Jammi NV, Whitby LR & Beal PA Small molecule inhibitors of the RNA-dependent protein kinase. Biochem. Biophys. Res. Commun. 308, 50–57 (2003). [DOI] [PubMed] [Google Scholar]
- 33.Zyryanova AF et al. ISRIB blunts the integrated stress response by allosterically antagonising the inhibitory effect of phosphorylated eIF2 on eIF2B. Mol. Cell 81, 88–103 (2021). [DOI] [PMC free article] [PubMed] [Google Scholar]
- 34.Rabouw HH et al. Small molecule ISRIB suppresses the integrated stress response within a defined window of activation. Proc. Natl Acad. Sci. USA 116, 2097–2102 (2019). [DOI] [PMC free article] [PubMed] [Google Scholar]
- 35.Zhang T et al. Small-molecule integrated stress response inhibitor reduces susceptibility to postinfarct atrial fibrillation in rats via the inhibition of integrated stress responses. J. Pharmacol. Exp. Ther. 378, 197–206 (2021). [DOI] [PubMed] [Google Scholar]
- 36.Anand AA & Walter P Structural insights into ISRIB, a memory-enhancing inhibitor of the integrated stress response. FEBS J. 287, 239–245 (2020). [DOI] [PubMed] [Google Scholar]
- 37.Soubrier F et al. Genetics and genomics of pulmonary arterial hypertension. J. Am. Coll. Cardiol. 62, D13–D21 (2013). [DOI] [PubMed] [Google Scholar]
- 38.Austin ED & Loyd JE The genetics of pulmonary arterial hypertension. Circ. Res. 115, 189–202 (2014). [DOI] [PMC free article] [PubMed] [Google Scholar]
- 39.Machado RD et al. Mutations of the TGF-β type II receptor BMPR2 in pulmonary arterial hypertension. Hum. Mutat. 27, 121–132 (2006). [DOI] [PubMed] [Google Scholar]
- 40.Long L et al. Selective enhancement of endothelial BMPR-II with BMP9 reverses pulmonary arterial hypertension. Nat. Med. 21, 777–785 (2015). [DOI] [PMC free article] [PubMed] [Google Scholar]
- 41.Schoof M et al. eIF2B conformation and assembly state regulate the integrated stress response. eLife 10, e65703 (2021). [DOI] [PMC free article] [PubMed] [Google Scholar]
- 42.Tian W et al. Phenotypically silent bone morphogenetic protein receptor 2 mutations predispose rats to inflammation-induced pulmonary arterial hypertension by enhancing the risk for neointimal transformation. Circulation 140, 1409–1425 (2019). [DOI] [PMC free article] [PubMed] [Google Scholar]
- 43.Gal-Ben-Ari S, Barrera I, Ehrlich M & Rosenblum K PKR: a kinase to remember. Front. Mol. Neurosci. 11, 480 (2018). [DOI] [PMC free article] [PubMed] [Google Scholar]
- 44.Hon SM, Alpizar-Rivas RM & Farber HW Pulmonary arterial hypertension in patients infected with the human immunodeficiency virus. Cardiol. Clin. 40, 45–54 (2022). [DOI] [PubMed] [Google Scholar]
- 45.Navarro P et al. Catenin-dependent and -independent functions of vascular endothelial cadherin. J. Biol. Chem. 270, 30965–30972 (1995). [DOI] [PubMed] [Google Scholar]
- 46.Bonilla B, Hengel SR, Grundy MK & Bernstein KA RAD51 gene family structure and function. Annu. Rev. Genet. 54, 25–46 (2020). [DOI] [PMC free article] [PubMed] [Google Scholar]
- 47.Okimoto S et al. hCAS/CSE1L regulates RAD51 distribution and focus formation for homologous recombinational repair. Genes Cells 20, 681–694 (2015). [DOI] [PubMed] [Google Scholar]
- 48.Plo I et al. AKT1 inhibits homologous recombination by inducing cytoplasmic retention of BRCA1 and RAD51. Cancer Res. 68, 9404–9412 (2008). [DOI] [PubMed] [Google Scholar]
- 49.Chou A et al. Inhibition of the integrated stress response reverses cognitive deficits after traumatic brain injury. Proc. Natl Acad. Sci. USA 114, E6420–E6426 (2017). [DOI] [PMC free article] [PubMed] [Google Scholar]
- 50.Frias ES et al. Aberrant cortical spine dynamics after concussive injury are reversed by integrated stress response inhibition. Proc. Natl Acad. Sci. USA 119, e2209427119 (2022). [DOI] [PMC free article] [PubMed] [Google Scholar]
- 51.Zhu PJ et al. Activation of the ISR mediates the behavioral and neurophysiological abnormalities in Down syndrome. Science 366, 843–849 (2019). [DOI] [PMC free article] [PubMed] [Google Scholar]
- 52.Krukowski K et al. Small molecule cognitive enhancer reverses age-related memory decline in mice. eLife 9, e62048 (2020). [DOI] [PMC free article] [PubMed] [Google Scholar]
- 53.Nguyen HG et al. Development of a stress response therapy targeting aggressive prostate cancer. Sci. Transl. Med. 10, eaar2036 (2018). [DOI] [PMC free article] [PubMed] [Google Scholar]
- 54.Zeng Q et al. Clinical characteristics and survival of Chinese patients diagnosed with pulmonary arterial hypertension who carry BMPR2 or EIF2KAK4 variants. BMC Pulm. Med. 20, 150 (2020). [DOI] [PMC free article] [PubMed] [Google Scholar]
- 55.Montani D et al. Pulmonary veno-occlusive disease: clinical, functional, radiologic, and hemodynamic characteristics and outcome of 24 cases confirmed by histology. Medicine 87, 220–233 (2008). [DOI] [PubMed] [Google Scholar]
- 56.Carraro V et al. Amino acid availability controls TRB3 transcription in liver through the GCN2/eIF2α/ATF4 pathway. PLoS ONE 5, e15716 (2010). [DOI] [PMC free article] [PubMed] [Google Scholar]
- 57.Chan MC et al. Molecular basis for antagonism between PDGF and the TGFβ family of signalling pathways by control of miR-24 expression. EMBO J. 29, 559–573 (2010). [DOI] [PMC free article] [PubMed] [Google Scholar]
- 58.Fischer AH, Jacobson KA, Rose J & Zeller R Hematoxylin and eosin staining of tissue and cell sections. Cold Spring Harb. Protoc. 10.1101/pdb.prot4986 (2008). [DOI] [PubMed] [Google Scholar]
- 59.Xie LW & Wang J Evaluating three elastic-fiber staining methods for detecting visceral pleural invasion in lung adenocarcinoma patients. Clin. Lab. 10.7754/Clin.Lab.2020.200851 (2021). [DOI] [PubMed] [Google Scholar]
- 60.Rhodes CJ et al. Whole-blood RNA profiles associated with pulmonary arterial hypertension and clinical outcome. Am. J. Respir. Crit. Care Med. 202, 586–594 (2020). [DOI] [PMC free article] [PubMed] [Google Scholar]
- 61.Beeton C, Garcia A & Chandy KG Drawing blood from rats through the saphenous vein and by cardiac puncture. J. Vis. Exp. 10.3791/266 (2007). [DOI] [PMC free article] [PubMed] [Google Scholar]
- 62.Galie N et al. Guidelines on diagnosis and treatment of pulmonary arterial hypertension. The Task Force on Diagnosis and Treatment of Pulmonary Arterial Hypertension of the European Society of Cardiology. Eur. Heart J. 25, 2243–2278 (2004). [DOI] [PubMed] [Google Scholar]
- 63.Stacher E et al. Modern age pathology of pulmonary arterial hypertension. Am. J. Respir. Crit. Care Med. 186, 261–272 (2012). [DOI] [PMC free article] [PubMed] [Google Scholar]
- 64.Flomerfelt FA & Gress RE Analysis of cell proliferation and homeostasis using EdU labeling. Methods Mol. Biol. 1323, 211–220 (2016). [DOI] [PMC free article] [PubMed] [Google Scholar]
Associated Data
This section collects any data citations, data availability statements, or supplementary materials included in this article.
Supplementary Materials
Data Availability Statement
All data supporting the findings in this study are included in the main article and its associated files. All RNA-seq data can be found under the accession number GSE229404 in the NCBI Gene Expression Omnibus database. Source data are provided with this paper.