

Abstract
Leptin (LEP) can cross the blood–brain barrier and facilitate cross-talk between the adipose tissue and central nerve system (CNS). This study aimed to investigate the effect of 8-week high-intensity interval training (HIIT) on the LEP signaling in the hippocampus of rats with type 2 diabetes. 20 rats were randomly divided into four groups: (i) control (Con), (ii) type 2 diabetes (T2D), (iii) exercise (EX), and (iv) type 2 diabetes + exercise (T2D + EX). The rats in the T2D and T2D + EX were fed a high-fat diet for two months, then a single dose of STZ (35 mg/kg) was injected to induce diabetes. The EX and T2D + EX groups performed 4–10 intervals of treadmill running at 80–100% of Vmax. Serum and hippocampal levels of LEP as well as hippocampal levels of LEP receptors (LEP-R), Janus kinase 2 (JAK-2), signal transducer and activator of transcription 3 (STAT-3), activated protein kinase (AMP-K), proxy zoster receptor α (PGC-1α), beta-secretase 1 (BACE1), Beta-Amyloid (Aβ), Phosphoinositide 3-kinases (PI3K), protein kinase B (AKT), mammalian target of rapamycin (mTOR), Glycogen Synthase Kinase 3 Beta (GSK3β), and hyperphosphorylated tau proteins (TAU) were measured. One-way ONOVA and Tukey post-hoc tests were used to analyze the data. Serum and hippocampal levels of LEP as well as hippocampal levels of LEP-R, JAK-2, STAT-3, AMP-K, PGC1α, PI3K, AKT, and mTOR were increased while hippocampal levels of BACE1, GSK3B, TAU, and Aβ were decreased in T2D + EX compared with T2D group. Serum LEP and hippocampal levels of LEP, LEP-R, JAK-2, STAT-3, AMP-K, PGC1α, PI3K, AKT, and mTOR were decreased. Conversely hippocampal levels of BACE1, GSK3B, TAU, and Aβ were increased in T2D group compared with CON group. HIIT could improve LEP signaling in the hippocampus of rats with type 2 diabetes and decrease the accumulation of Tau and Aβ, which may reduce the risk of memory impairments.
Graphical Abstract

Supplementary Information
The online version contains supplementary material available at 10.1007/s10571-023-01357-1.
Keywords: Cognitive function, Leptin resistance, Obesity, HIIT
Introduction
Technological advances have provided many benefits to human; nevertheless, it has also led to a considerable reduction in physical activity. While physical activity was part of routine life previously machines make our life less active (Jin et al. 2022; Khoramipour et al. 2020). A common feature in most diseases associated with the new lifestyle is obesity (Brown et al., 2021). According to the World Health Organization (WHO), more than 1 billion people are obese worldwide in 2021; 650 million adults, 340 million adolescents, and 39 million children (Brown et al. 2021). WHO has identified obesity as the most important risk factor for type 2 diabetes (T2D), and the U.S.A. Centers for Disease Control and Prevention (CDC) reported that 85% of patients with T2D are overweight and 50% are obese (Bhupathiraju & Hu 2016). T2D causes disorders in various organs, including adipose tissue. Unlike past, adipose tissue is, henceforth, considered active endocrine tissue as it secures bioactive proteins called adipokines. These proteins play a vital role in metabolic homeostasis, with leptin (LEP) as one of the most important ones (Folch et al. 2015). LEP is generally considered the satiety hormone (Suriagandhi & Nachiappan 2022). Insulin stimulates the production of LEP when adipocytes are exposed to glucose to encourage satiety; however, LEP, via negative feedback, decreases the secretion of insulin and enhances tissue sensitivity to it, leading to glucose uptake for energy utilization or storage (Amitani et al. 2013). Insulin resistance (IR) in patients with T2D leads to increase blood insulin levels which can stimulate further secretion of LEP, ending up with LEP resistance (LR) (Yadav et al., 2013). High levels of insulin and increased LEP receptors have been reported in the hippocampus, a part of the brain responsible for learning and memory; thus, peripheral IR and LR could happen in the hippocampus of T2D patients (Dutta et al., 2022). IR and LR are responsible for impaired glucose homeostasis seen in the hippocampus of patients with T2D, which can lead to learning and memory impairments (Erichsen et al. 2022).
LEP crosses the blood–brain barrier (BBB) and modifies Beta-Amyloid (Aβ) and hyperphosphorylated tau (TAU) accumulation. The latter are leading players in memory impairments, through Janus kinase 2 (JAK-2)/signal transducer and activator of transcription 3 (STAT-3) signaling pathways. After binding to its receptor, LEP phosphorylates JAK-2 and STAT-3, which can then activate the activated protein kinase (AMP-K) and phosphoinositide three kinases (PI3K) (Folch et al. 2015). AMP-K is then phosphorylated and directly activates Peroxisome gamma coactivator 1-alpha (PGC-1α), which deactivates beta secretes 1 (BACE1), a stimulator of Aβ production. Reducing Aβ could reduce the overall incidence rate of memory impairments (Marwarha & Ghribi 2012). PI3K can also phosphorylate and activate protein kinase B (AKT), which can then phosphorylate and activate the mammalians target of rapamycin (mTOR). mTOR mediates the synthesis and aggregation of TAU. Furthermore, AKT dephosphorylates and deactivates glycogen synthase kinase three beta (GSK3β), another stimulator of TAU production (Folch et al. 2015; Marwarha & Ghribi 2012).
Therefore, reducing peripheral and hippocampal IR and LR could be a promising novel therapy for memory impairments in T2D patients. Exercise training has been suggested as one of the most potent stimulators of LEP secretion. In this regard, Kang et al. (S. Kang et al. 2013) showed that eight weeks of exercise training improved the sensitivity to peripheral and central LEP. York et al. (Yook et al. 2019) showed that low-intensity training with long duration (e.g., 60 min) might reduce LEP secretion. Moreover, another group reported that high-intensity (e.g., 95–95% Vmax) training with lower duration (e.g., 20–30 min) could increase LEP levels in serum and hippocampus (Uysal et al. 2017). Thus, a dose-dependent pattern could be considered for describing the effects of exercise on LEP, with intensity appearing as the most important variable (Yi 2015).
Thus, the present study investigated the effects of 8-week high-intensity interval training (HIIT) on LEP signaling in the hippocampus of rats with T2D. We hypothesized that HIIT could improve LEP signaling in the hippocampus because of the high intensity and interval nature, thereby reducing the possibility of TAU and Aβ accumulation.
Material & Methods
In this study, 20 male Wister rats with an average weight of 200 ± 10.25 g and an age of 8 weeks were purchased from the animal farm of Kerman University of Medical Sciences. The animals were kept in polycarbonate cages with controlled temperature (22 ± 1.4 °C), humidity (50 ± 4), and light (12-h light/dark cycle), with free access to water and food. This study was approved by the Kerman University of Medical Sciences (IR.UK.REC.1400.008).
Animal Grouping
First, the animals were introduced to the laboratory environment, and then they were randomly divided into four groups (5 rats per group) as follows: (i) healthy Control (CON), (ii) T2D (type 2 diabetes), (iii) EX (exercise), and (iv) type2 diabetes + exercise (T2D + EX).
Type 2 Diabetes Induction
In the first eight weeks, animals in the T2D and T2D + EX groups were fed a high-fat diet (HFD) (Table 1) (Lee et al. 2019; Shimizu et al. 2017). After eight weeks, the rats fasted for 12 h, and then a single dose of 35 mg/kg streptozotocin (STZ) was injected intraperitoneally. Rats’ blood glucose was measured three days after injection with a glucometer (Eliza et al., 2009). The criterion for diabetes and rats entering the study was fasting blood glucose (FBG) above 300 mg/dl (Speisman et al. 2013).
Table 1.
High-fat and regular diets ingredients
| Diet ingredients | Fat | Carbohydrate | Protein | Fiber/Mineral/Vitamin | Total calorie intake |
|---|---|---|---|---|---|
| Regular diet | 10% | 70% | 19% | 1% | 341 |
| High-fat diet | 60% | 20% | 19% | 1% | 429 |
Exercise Protocol
All rats underwent a five days familiarization with a treadmill (running for 10 min with a speed of 8 m/min). At the end of the familiarization period, an incremental test was performed to measure rats’ maximum velocity (Vmax) (Bejeshk et al., 2022; Orumiyehei et al. 2022). In this test, the rats ran for 2 min first at 6 m/min, and every 2 min, 2 m/min was added to the treadmill speed until they were exhausted. The last tolerated speed was considered as Vmax. The primary exercise protocol based on the rats' Vmax was performed for 8 weeks and 5 times a week. This protocol has been designed in our lab, and we named it the K1 protocol (Table 2). Animals Vmax was re-measured every 2 weeks and used to adjust the training protocol for the next 2 weeks’ period.
Table 2.
HIIT protocol
| week | Slope | Frequency (time per week) | Intervals | High-intensity interval duration (min) | Low-intensity interval duration (min) | High-intensity interval velocity (Vmax) | Low-intensity interval velocity (Vmax) | Total exercise time in a session (min) |
|---|---|---|---|---|---|---|---|---|
| 1 | 0 | 5 | 4 | 2 | 1 | 80 | 50 | 12 |
| 2 | 0 | 5 | 4 | 2 | 1 | 85 | 50 | 12 |
| 3 | 0 | 5 | 6 | 2 | 1 | 85 | 50 | 18 |
| 4 | 0 | 5 | 6 | 2 | 1 | 90 | 50 | 18 |
| 5 | 0 | 5 | 8 | 2 | 1 | 90 | 50 | 24 |
| 6 | 0 | 5 | 8 | 2 | 1 | 95 | 50 | 24 |
| 7 | 0 | 5 | 10 | 2 | 1 | 95 | 50 | 30 |
| 8 | 0 | 5 | 10 | 2 | 1 | 100 | 50 | 30 |
Sampling
Blood Sample
Forty-eight hours after the last training session, the rats have been sacrified by an anesthesia by intraperitoneal injection of a combination of ketamine 8 mg/kg and xylazine 10 mg/kg, and then blood samples were taken from the heart. Blood samples were then placed at room temperature (25 °C) for ~ 30 min and then centrifuged at 1000 × g for 20 min at 4 °C, and then serum samples were stored at a temperature of − 80 °C until analysis (Bejeshk et al. 2022; Orumiyehei et al. 2022).
Hippocampus Sample
Furthermore, the rats’ hippocampus was removed. The hippocampus was washed in PBS solution. An ultrasonic homogenizer performed homogenization in Ripa buffer solution with protease inhibitor on ice. The homogenate was then centrifuged at four °C at 13,000 rpm for 20 min, and the supernatant was kept at − 80 °C until analysis (Bejeshk et al. 2022; Orumiyehei et al. 2022).
Western Blot
The western blotting method was used to evaluate the concentrations of LEP-R (SANTA CRUZ BIOTECHNOLOGY, INC/United States/Catalog No. sc-8391), JAK-2 (SANTA CRUZ BIOTECHNOLOGY, INC/United States/Catalog No. sc-21870), STAT-3 (SANTA CRUZ BIOTECHNOLOGY,/United States/Catalog No. sc-8059), AMP-K (SANTA CRUZ BIOTECHNOLOGY, INC/United States/Catalog No. sc-33524), PGC1α (United States Biological/United States/Catalog No. P3363-03C), BACE1 (Elabscience/United States/ Catalog No. E-AB-13945), Aβ (SANTA CRUZ BIOTECHNOLOGY, INC/United States/ Catalog No. sc-28365), PI3K (abcam/ United States/Catalog No. ab182651), AKT (Elabscience/United States/Catalog No. E-AB-30471), GSK3B (SANTA CRUZ BIOTECHNOLOGY, INC/United States/Catalog No. sc-81462), and Tau hyperphosphorylated proteins (SANTA CRUZ BIOTECHNOLOGY, INC/United States/Catalog No. sc-21796). To perform this test, samples were prepared, and the target protein separated on the gel was transferred to nitrocellulose paper with a pore of 0.45 μm at a current of 0.5 amps for 1.5 h. For this purpose, first, we poured some buffer into a clean container and put the gel in the buffer for at least 10 min after cutting the compacting part. Then, with the help of pliers, we cut nitrocellulose paper and several filter pads precisely the same size as the gel, placed the two sponges placed on the sides of the membrane and gel, and transferred them to the buffer until they were completely wet. Then did put the above components on top of each other, fastened the blot sandwich in the relevant plastic frame, and placed it in the blot tank filled with buffer to the appropriate height. The specified amount of primary antibodies is (1: 1000), was diluted, and incubated for 16 to 18 h. The membrane in the secondary antibody solution with an appropriate concentration in EIA buffer for 1.5 h was shaken twice with TBST and once with PBS. The membrane was placed in an acceptable TMB substrate solution until bands appeared. The reaction has been stopped by adding distilled water. Next, the safety diagnosis was recorded using the Chemi Doc XRS + imaging system (Bio-Rad, USA) and analyzed using image J software. Beta-actin protein was used as a control (Frankenberg, Reis, & Gerchman, 2017; MAGALHÃES et al. 2019).
ELISA
The ELISA method was used to measure LEP (in serum and hippocampus) and insulin concentration (in serum) according to the commercial kit standard. In this method, the concentration of LEP in hippocampal tissue and serum was divided into the total protein concentration (mg/ml) of the respective homogenates. After washing with saline solution and Trigger buffer (Sigma), the hippocampus was homogenized using a 5000 rpm homogenizer for 5 min. The homogenized solution was centrifuged by refrigerated centrifugation. All steps were performed at 4 °C to prevent the degradation of enzymes and proteins. 0.5 mM phenylmethylsulfonyl fluoride solution was used as a protease inhibitor. After centrifugation, the upper part was removed with a sampler, and then the amount of LEP tissue was measured by the ELISA method and ELISA reader device, and data were given. Calculations were presented in nanograms per milligram of protein LEP (Rat ELISA Kit, Eastbiopharm) (Frankenberg et al. 2017; Magalhães et al. 2019).
Insulin Resistance Index
The homeostasis model assessment (HOMA) was used to assess insulin resistance (HOMA-IR). HOMA-IR score was calculated using the following formula (Orumiyehei et al. 2022):
Statistical Analysis
First, sample size was determined using G-power app (n = 5) and the normality and homogeneity of the data were evaluated using Shapirovilk and Levin tests, respectively. One-way ANOVA was used to compare the variables, and the Tukey post-test was used to determine the significant differences between the groups. All data are reported as mean ± standard deviation (SD). A P value less than 0.05 was considered as the criterion for statistical significance. All statistical analysis was performed using Graph Pad Prism 9. We were blinded to the experimental protocol while performing the statistical calculations.
Results
Vmax
To adjust the training intensity and show the effectiveness of the exercise training protocol, rats’ Vmax was re-measured every 2 weeks. The statistical analysis showed that Vmax was significantly different in week 7 and 9 compared to week 1 in both EX and T2D + EX groups (Fig. 1).
Fig. 1.

Rats’ Vmax was re-measured every 2 weeks with incremental test.*significant different with week 1
Animal Weight and Blood Glucose
Our results showed that blood glucose was significantly increased after diabetes induction (month 2) in T2D and T2D + Ex groups compared to other groups (P ≤ 0.001), with no significant difference between these groups. In addition, HIIT reduced blood glucose significantly (P ≤ 0.001, Fig. 2).
Fig. 2.

Blood glucose levels before the high-fat diet (month 0), after the high-fat diet and STZ injection (month 2), and 48 h after HIIT (month 4) in all groups. CON: control, T2D: Type 2 diabetic, Ex: exercise only, and T2D + Ex: Type 2 diabetic + exercise. *shows a significant difference between T2D and T2D + Ex with other groups (n = 5)
After two months of a high-fat diet and STZ injection, rats’ weight in T2D and EX + T2D groups increased significantly (P ≤ 0.001). In addition, the weight of rats in the T2D group decreased significantly at month 4 (P ≤ 0.01, Fig. 3).
Fig. 3.
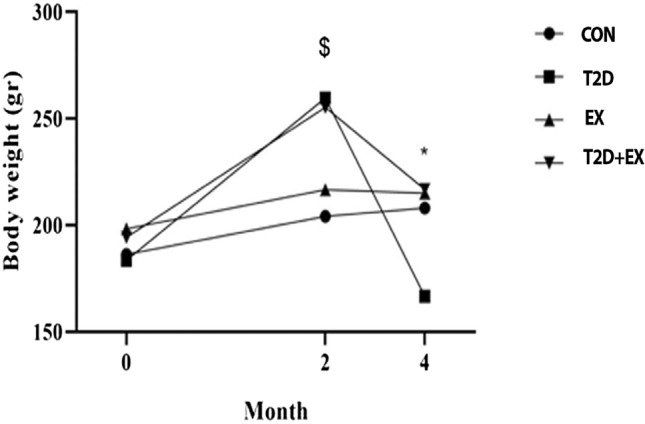
Animals’ Body weight before the high-fat diet (month 0), after the high-fat diet and STZ injection (month 2), and 48 h after HIIT (month 4). CON: control, T2D: Type 2 diabetic, EX: exercise, and EX + T2D: Type 2 diabetes + exercise. *Shows a significant difference between T2D with other groups. $shows a significant difference between T2D and T2D + Ex with other groups (n = 5)
Molecular Changes
Insulin Level in Serum, HOMA-IR, LEP Levels in Serum and Hippocampus
One-way ANOVA showed that serum insulin (INS-S) level (f3,16 = 32.27, P < 0.0001) and HOMA-IR (f3,16 = 159.1, P < 0.0001) were different between groups significantly and the Tukey post-test showed that INS-S level was significantly different in CON from T2D group (P < 0.0001). In addition, T2D + Ex group showed significantly higher levels of serum insulin than the T2D group (P < 0.0001). Our results showed that T2D had higher HOMA-IR than CON group (P < 0.0001); however, no significant difference was found between EX and CON groups (P < 0.0001). A significant difference was shown between T2D and T2D + EX groups (P < 0.0001). In addition, One-way ANOVA showed that LEP levels in serum (f3,16 = 34.518, P < 0.0001) and hippocampus (f3,16 = 16.514, P < 0.0001) were different between groups significantly and the Tukey post-test showed that LEP levels in serum and hippocampus were significantly different in the CON group compared with other groups (P < 0.0001). Exercise and diabetes increased and decreased LEP levels in serum and hippocampus, respectively (P < 0.0001). In addition, the T2D + EX group showed higher LEP levels in both serum and hippocampus than the T2D group (P < 0.0001, Fig. 4).
Fig. 4.

INS-S levels in serum (A), HOMA-IR (B), LEP levels in serum (C) and LEP levels in hippocampus (D). INS-S: insulin in serum, HOMA-IR: insulin resistance index, LEP-S: leptin serum, LEP-H: leptin hippocampus, CON: control, T2D: Type 2 diabetic, Ex: exercise, and T2D + Ex: Type 2 diabetic + exercise. *Significant difference compared to other groups, & Significant difference compared to T2D group (n = 5)
LEP-R Levels in the Hippocampus
One-way ANOVA showed that hippocampal LEP-R expression (f3,16 = 25.477, P < 0.0001) was different between groups significantly and the Tukey post-test showed that hippocampal LEP-R expression was significantly different in the CON group compared with other groups (P < 0.0001). Furthermore, Ex and T2D groups showed the highest and lowest hippocampal LEP-R levels (P < 0.0001, Fig. 5).
Fig. 5.

LEP-R levels in the hippocampus. LEP-R: leptin receptor, CON: control, T2D: type2 diabetes, EX: exercise, T2D + EX: type2 diabetes + exercise. *Significant difference compared to other groups (n = 5)
JAK-2 and STAT-3 Levels in the Hippocampus
One-way ANOVA showed that hippocampal expression of JAK-2 (f3,16 = 11.364, P < 0.0001) and STAT-3 (f3,16 = 5.644, P < 0.0001) were different between groups significantly and the Tukey post-test showed that JAK-2 and STAT-3 levels in the hippocampus were significantly different between groups, with the highest and lowest in EX and T2D groups, respectively (P < 0.0001). Furthermore, JAK-2 and STAT-3 levels were significantly higher in T2D + EX compared with the T2D group (P < 0.0001, Fig. 6).
Fig. 6.

JAK-2 (A), STAT-3 (B) levels in the hippocampus. CON: control, T2D: type2 diabetes, EX: exercise, T2D + EX: type2 diabetes + exercise. *Significant difference compared to other groups (n = 5)
AMP-K, PI3K Pathway in the Hippocampus
One-way ANOVA showed that hippocampal expression of AMP-K (f3,16 = 16.484, P < 0.0001), PGC11α (f3,16 = 37.485, P < 0.0001), PI3K (f3,16 = 34.496, P < 0.0001), AKT (f3,16 = 137.862, P < 0.0001), and MTOR (f3,16 = 35.82, P < 0.0001) were different between groups significantly and the Tukey post-test showed that AMP-K, PGC11α, PI3K, AKT, and MTOR levels were higher and lower in EX and T2D groups compared to CON, respectively (P < 0.001). Furthermore, their levels were significantly higher in T2D + EX compared with the T2D group (P < 0.001, Fig. 7).
Fig. 7.

AMP-K (A), PGC11α (C), PI3K (B), AKT (D), MTOR (E) levels in the hippocampus. CON: control, T2D: type2 diabetes, EX: exercise, T2D + EX: type2 diabetes + exercise. *Significant difference compared to other groups (n = 5)
BACE1, GSK3β Levels in the Hippocampus
One-way ANOVA showed that BACE1 (f3,16 = 8.325, P < 0.0001) and GSK3β levels (f3,16 = 29.854, P < 0.0001) were different between groups significantly and the Tukey post-test showed that BACE1 and GSK3β levels in the hippocampus were lower and higher in EX and T2D groups compared to CON, respectively (P < 0.0001). Furthermore, BACE1 and GSK3β levels were significantly higher in T2D compared with the T2D + EX group (P < 0.0001, Fig. 8).
Fig. 8.

BACE1 (A), GSK3β (B) levels in the hippocampus. CON: control, T2D: type2 diabetes, EX: exercise, T2D + EX: type2 diabetes + exercise. *Significant difference compared to other groups (n = 5)
Aβ and TAU Levels in the Hippocampus
One-way ANOVA showed that Aβ (f3,16 = 8.325, P < 0.0001) and TAU (f3,16 = 8.325, P < 0.0001) levels were different between groups significantly and the Tukey post-test showed that Aβ and TAU levels in the hippocampus were significantly different in CON from other groups (P < 0.05). Aβ and TAU levels were highest and lowest in the T2D and EX groups, respectively (P < 0.001). In addition, the T2D + EX group showed lower Aβ and TAU levels than the T2D group (P < 0.001, Fig. 9).
Fig. 9.

Aβ (A), TAU (B) levels in the hippocampus. CON: control, T2D: type2 diabetes, EX: exercise, T2D + EX: type2 diabetes + exercise. *Significant difference with other groups (n = 5)
Discussion
We studied the effect of 8-week HIIT on LEP signaling in the hippocampus of rats with T2D. We showed in EX and T2D + EX groups post-training increase in serum and hippocampal levels of LEP as well as hippocampal levels of LEP-R, JAK-2, STAT-3, AMP-K, PGC1α, PI3K, and AKT and decrease in hippocampal levels of BACE1, GSK3B, TAU, and Aβ compared to the CON and EX groups.
LEP facilitates the cross-talk between adipose tissue and CNS, with high levels of LEP-R reported in the hippocampus and hypothalamus (Marwarha & Ghribi 2012). When LEP enters the hypothalamus, it could decrease appetite and food intake (Zhao et al. 2011). Consistent with our results, several studies showed that different kinds of exercise (i.e., long-term aerobic, resistance, or HIIT) increased serum leptin levels despite body fat reduction (Koga et al. 2014a, b; Uysal et al. 2017). In contrast, Sun et al. (Sun et al. 2013) and Jenkins et al. (Jenkins et al. 2012) showed a significant decrease in LEP levels after exercise. Probably the reason for this inconsistency is the low intensity of the exercise protocol used in these studies as it seems that LEP is sensitive to exercise intensity (Uysal et al. 2017; Yi 2015); thus, low- and moderate-intensity training may not be able to stimulate its secretion (Jenkins et al. 2012; Sun et al. 2013; Yook et al. 2019).
We observed that diabetes reduced serum levels of LEP and hippocampal LEP-R levels due mainly to IR. Under normal conditions, insulin helps glucose uptake by adipose tissue via glucose transporter 4 (Glut 4) (Van Doorn et al. 2017). Glucose acts as an intracellular signal and stimulates the secretion of LEP from adipose tissue. Therefore, IR could disrupt LEP secretion (Amitani et al. 2013; Yadav et al. 2013). In addition, IR could lead to LR (Dutta et al. 2022; Park et al. 2005). Diabetes, by disrupting the secretion of LEP and reducing the sensitivity of its target tissues, reduces the LEP-R sensitivity and LEP concentration (Ruegsegger & Booth 2017; Zhou & Rui 2013). But in our study, exercise has increased LEP-R levels in the hippocampus and improved LR. All other studies confirm the positive effect of exercise on LEP-R, especially in diabetic rats (Farr et al. 2015; Koga et al. 2014a, b; Liu et al. 2017; Uysal et al. 2017). Increased serum LEP levels and decreased hippocampal LEP-R could lead to more LEP entrance into the hippocampus and increase hippocampal LEP levels, which is confirmed by our results and other studies (Koga et al. 2014a, b; Speisman et al. 2013; Uysal et al. 2017). Uysal et al. (Uysal et al. 2017) investigated the effects of 8-week exercise training on LEP levels in the blood and hippocampus. In the latter study, 23 rats ran on a treadmill five days a week for 30 min at a speed of 8 m/min. The researchers reported an increase in the levels of LEP and LEP-R in the hippocampus of both male and female training groups (Uysal et al. 2017).
After binding to its receptor in the hippocampus, LEP phosphorylates and activates JAK-2 and STAT-3, the initiators of AMP-K/BACE1 and PI3K/AKT pathways (Folch et al. 2015); thus, we observed increased JAK-2 and STAT-3 levels after 8-week HIIT. Nevertheless, Lin et al. (Lin et al. 2022) observed reduction of these two proteins after 12 weeks of aerobic exercise. In addition, Liu et al. (Liu et al. 2017) suggested that LEP could suppress the JAK-2 and STAT-3 inhibitors (i.e., cytokine signaling (SOCS), protein inhibitors of activated STATs (PIAS), and protein tyrosine phosphatases (PTP)). Recent studies (Park et al. 2005; Shapiro et al. 2011) – in line with our results – showed that diabetes could decrease JAK-2 and STAT-3 levels by disrupting the regulation of insulin and LEP secretion.
STAT-3 can phosphorylate and activate AMP-K, as reported by us and another study (Lin et al. 2022). AMP-K, in turn, increases PGC1α and decreases BACE1. It is the primary regulator of the Aβ aggregation. Decreased BACE1 levels can finally lead to decrease Aβ accumulation (Marwarha & Ghribi 2012). Our results showed that the levels of PGC1α were higher in T2D + EX than in T2D group, and consequently, the levels of BACE1 and Aβ were lower in T2D + EX than in T2D.
As mentioned earlier, STAT-3 can also phosphorylate and activates PI3K. PI3K is a family of enzymes involved in various cellular functions such as cell growth, proliferation, differentiation, motility, survival, and intracellular trafficking (Knight et al. 2006). PI3K can phosphorylate and activate AKT, a stimulator of mTOR. Furthermore, Akt could dephosphorylate GSK3B and subsequently decrease the accumulation of hyperphosphorylated Tau (Folch et al. 2015). Our results, in line with other studies (Belarbi et al. 2011; Jeong & Kang 2018; E.-B. Kang & Cho 2015), confirm this process because we observed higher levels of PI3K, Akt, and mTOR as well as low levels of dephosphorylated GSK3B and hyperphosphorylated Tau in the T2D + EX group than T2D.
Decreased Aβ and Tau accumulation could be translated into lower memory impairment, the common complication seen in T2D. This was documented by several studies (Belarbi et al. 2011; Jeong & Kang 2018; E.-B. Kang & Cho 2015; Mohammadi et al., 2012), which reported a high correlation between the levels of Tau and Aβ with the results of Morris water maze, open field, Novel object recognition, and Shuttle box tests (Belarbi et al. 2011; Wu et al. 2020).
Study Limitations and Suggestion for Future Studies
Due to financial limitation, we could not include more animal in our study which may limit statistical power. As LEP secreted by adipose tissue, the adipose tissue content should be considered in the prospective studies. Moreover, because PPARα stimulate BACE1 transcription, measuring PPARα levels is recommended in future studies.
Conclusion
Diabetes causes peripheral and central LR by disrupting adipose tissue metabolism. LR in the hippocampus causes LEP signaling malfunction and, as a result, accumulation of Aβ and TAU, the two leading players in memory impairments. HIIT, as a promising non-pharmacological intervention, could improve LEP signaling and thereby reduce the accumulation of Aβ and TAU in the hippocampus. Further research is warranted in the field, hoping that our research will inspire others working in humans.
Supplementary Information
Below is the link to the electronic supplementary material.
Acknowledgements
The authors would like to thank Neuroscience Research Center, Kerman University of Medical Sciences for its financial support.
Abbreviations
- AMP
Activated protein kinase
- Aβ
Beta-amyloid
- BACE1
Beta-secretase 1
- BBB
Blood–brain barrier
- CDC
Centers for disease control and prevention
- CNS
Central nerve system
- CO
Control
- EX
Exercise
- GSK3β
Glycogen synthase kinase 3 Beta
- JAK-2
Janus kinase 2
- IR
Insulin resistance
- LEP
Leptin
- LEP-R
Leptin receptor
- LR
Leptin resistance
- MTOR
Mammalian target of rapamycin
- PKB/AKT
Protein kinase B
- PI3K
Phosphoinositide 3-kinases
- PGC1α
Proxy zoster receptor α
- STAT-3
Signal transducer and activator of transcription 3
- TAU
Hyperphosphorylated tau proteins
- T2D
Type 2 diabetes
- T2D + EX
Type2 diabetes + exercise
- WHO
World Health Organization
Author Contributions
Conceptualization, KK, Methodology, KK, Software, MA, Validation, MH, Formal Analysis, M.A, KC; Investigation, MH, Resources, EM, Data Curation, MA, Writing—Original Draft Preparation, EM, Writing—Review & Editing, KK, KC, Visualization, MA, KC, Supervision, KK, KC; Project Administration, KK, Funding Acquisition, KK.
Funding
This research was funded by Neuroscience Research Center, Kerman University of Medical Sciences.
Data Availability
Data that support the findings of this study are available at Kerman University of Medical Sciences.
Declarations
Competing interests
The authors declare that they have no competing interests.
Ethical Approval
This study was approved by the Kerman University of Medical Sciences (IR.UK.REC.1400.008).
Consent to Participate
Not applicable.
Consent for Publication
Not applicable.
Footnotes
Publisher's Note
Springer Nature remains neutral with regard to jurisdictional claims in published maps and institutional affiliations.
Maryam Hossein Rezaei and Elham Madadizadeh have contributed equally to this work.
Mohsen Aminae and Mehdi Abbaspour have contributed equally to this work.
References
- Amitani M, Asakawa A, Amitani H, Inui A (2013) The role of leptin in the control of insulin-glucose axis. Front Neurosci 7:51 [DOI] [PMC free article] [PubMed] [Google Scholar]
- Bejeshk, M. A., Rajizadeh, M. A., Najafipour, H., & Dehghan, P. (2022). High-intensity interval training ameliorate diabetes-induced disturbances in Alzheimer’s-related factors in the hippocampus through adiponectin signaling.
- Belarbi K, Burnouf S, Fernandez-Gomez F-J, Laurent C, Lestavel S, Figeac M, Caillierez R (2011) Beneficial effects of exercise in a transgenic mouse model of Alzheimer’s disease-like Tau pathology. Neurobiol Dis 43(2):486–494 [DOI] [PubMed] [Google Scholar]
- Bhupathiraju SN, Hu FB (2016) Epidemiology of obesity and diabetes and their cardiovascular complications. Circ Res 118(11):1723–1735 [DOI] [PMC free article] [PubMed] [Google Scholar]
- Brown JC, Carson TL, Thompson HJ, Agurs-Collins T (2021) The triple health threat of diabetes, obesity, and cancer—epidemiology, disparities, mechanisms, and interventions. Obesity 29(6):954–959 [DOI] [PMC free article] [PubMed] [Google Scholar]
- Dutta BJ, Singh S, Seksaria S, Gupta GD, Singh A (2022) Inside the diabetic brain: Insulin resistance and molecular mechanism associated with cognitive impairment and its possible therapeutic strategies. Pharmacol Res. 10.1016/j.phrs.2022.106358 [DOI] [PubMed] [Google Scholar]
- Eliza J, Daisy P, Ignacimuthu S, Duraipandiyan V (2009) Antidiabetic and antilipidemic effect of eremanthin from Costus speciosus (Koen.) Sm. STZ-induced diabetic rats. Chemico-Biol Interactions 182(1):67–72 [DOI] [PubMed] [Google Scholar]
- Erichsen JM, Fadel JR, Reagan LP (2022) Peripheral versus central insulin and leptin resistance: Role in metabolic disorders, cognition, and neuropsychiatric diseases. Neuropharmacology 203:108877 [DOI] [PMC free article] [PubMed] [Google Scholar]
- Farr OM, Tsoukas MA, Mantzoros CS (2015) Leptin and the brain: influences on brain development, cognitive functioning and psychiatric disorders. Metabolism 64(1):114–130 [DOI] [PubMed] [Google Scholar]
- Folch J, Patraca I, Martínez N, Pedrós I, Petrov D, Ettcheto M, Camins A (2015) The role of leptin in the sporadic form of Alzheimer’s disease. Interactions with the adipokines amylin, ghrelin and the pituitary hormone prolactin. Life Sci 140:19–28 [DOI] [PubMed] [Google Scholar]
- Frankenberg AD, v., Reis, A. F., & Gerchman, F. (2017) Relationships between adiponectin levels, the metabolic syndrome, and type 2 diabetes: a literature review. Arch Endocrinol Metab 61:614–622 [DOI] [PMC free article] [PubMed] [Google Scholar]
- Jenkins NT, Padilla J, Arce-Esquivel AA, Bayless DS, Martin JS, Leidy HJ, Laughlin MH (2012) Effects of endurance exercise training, metformin, and their combination on adipose tissue leptin and IL-10 secretion in OLETF rats. J Appl Physiol 113(12):1873–1883 [DOI] [PMC free article] [PubMed] [Google Scholar]
- Jeong J-H, Kang E-B (2018) Effects of treadmill exercise on PI3K/AKT/GSK-3β pathway and tau protein in high-fat diet-fed rats. J Exerc Nutr Biochem 22(1):9 [DOI] [PMC free article] [PubMed] [Google Scholar]
- Jin D, Halvari H, Maehle N, Olafsen AH (2022) Self-tracking behaviour in physical activity: a systematic review of drivers and outcomes of fitness tracking. Behav Inform Technol 41(2):242–261 [Google Scholar]
- Kang E-B, Cho J-Y (2015) Effect of treadmill exercise on PI3K/AKT/mTOR, autophagy, and Tau hyperphosphorylation in the cerebral cortex of NSE/htau23 transgenic mice. J Exerc Nutr Biochem 19(3):199 [DOI] [PMC free article] [PubMed] [Google Scholar]
- Kang S, Kim KB, Shin KO (2013) Exercise training improve leptin sensitivity in peripheral tissue of obese rats. Biochem Biophys Res Commun 435(3):454–459 [DOI] [PubMed] [Google Scholar]
- Khoramipour K, Hekmatikar AA, Sotvan H (2020) An overview of Fatmax and MFO in exercise. Razi J Med Sci 27:49–59 [Google Scholar]
- Knight ZA, Gonzalez B, Feldman ME, Zunder ER, Goldenberg DD, Williams O, Toth B (2006) A pharmacological map of the PI3-K family defines a role for p110α in insulin signaling. Cell 125(4):733–747 [DOI] [PMC free article] [PubMed] [Google Scholar]
- Koga S, Kojima A, Ishikawa C, Kuwabara S, Arai K, Yoshiyama Y (2014a) Effects of diet-induced obesity and voluntary exercise in a tauopathy mouse model: implications of persistent hyperleptinemia and enhanced astrocytic leptin receptor expression. Neurobiol Dis 71:180–192 [DOI] [PubMed] [Google Scholar]
- Koga S, Kojima A, Kuwabara S, Yoshiyama Y (2014b) Immunohistochemical analysis of tau phosphorylation and astroglial activation with enhanced leptin receptor expression in diet-induced obesity mouse hippocampus. Neurosci Lett 571:11–16 [DOI] [PubMed] [Google Scholar]
- Lee MR, Kim JE, Choi JY, Park JJ, Kim HR, Song BR, Hwang DY (2019) Anti-obesity effect in high-fat-diet-induced obese C57BL/6 mice: Study of a novel extract from mulberry (Morus alba) leaves fermented with Cordyceps militaris. Exp Ther Med 17(3):2185–2193 [DOI] [PMC free article] [PubMed] [Google Scholar]
- Lin L, Wang Y, Xu W, Huang C, Hu J, Chen X, Li H (2022) Aerobic exercise improves type 2 diabetes mellitus-related cognitive impairment by inhibiting JAK2/STAT3 and enhancing AMPK/SIRT1 pathways in mice. Dis Markers. 10.1155/2022/6010504 [DOI] [PMC free article] [PubMed] [Google Scholar]
- Liu W, Liu J, Xia J, Xue X, Wang H, Qi Z, Ji L (2017) Leptin receptor knockout-induced depression-like behaviors and attenuated antidepressant effects of exercise are associated with STAT3/SOCS3 signaling. Brain Behav Immun 61:297–305 [DOI] [PubMed] [Google Scholar]
- Magalhães D, Willuant Kume T, Francyele SC, Thaís SQ, Edgar WA, Maísa PDS, Nair HK, Suélem ADF DE (2019) High-fat diet and streptozotocin in the induction of type 2 diabetes mellitus: a new proposal. An Acad Bras Ciênc. 10.1590/0001-3765201920180314 [DOI] [PubMed] [Google Scholar]
- Marwarha G, Ghribi O (2012) Leptin signaling and Alzheimer’s disease. Am J Neurodegener Dis 1(3):245 [PMC free article] [PubMed] [Google Scholar]
- Mohammadi ZF, Khezri A, Ebrahimzadeh M (2012) The effects of voluntary exercise on a running wheel and allium paradoxum on tau protein in the cerebellum of diabetic rats. J Isfahan Med School 30(185):1–11 [Google Scholar]
- Orumiyehei A, Khoramipour K, Rezaei MH, Madadizadeh E, Meymandi MS, Mohammadi F, Suzuki K (2022) High-intensity interval training-induced hippocampal molecular changes associated with improvement in anxiety-like behavior but not cognitive function in rats with type 2 diabetes. Brain Sci 12(10):1280 [DOI] [PMC free article] [PubMed] [Google Scholar]
- Park S, Jang JS, Jun DW, Hong SM (2005) Exercise enhances insulin and leptin signaling in the cerebral cortex and hypothalamus during dexamethasone-induced stress in diabetic rats. Neuroendocrinology 82(5–6):282–293 [DOI] [PubMed] [Google Scholar]
- Ruegsegger GN, Booth FW (2017) Running from disease: molecular mechanisms associating dopamine and leptin signaling in the brain with physical inactivity, obesity, and type 2 diabetes. Front Endocrinol 8:109 [DOI] [PMC free article] [PubMed] [Google Scholar]
- Shapiro A, Cheng K-Y, Gao Y, Seo D-O, Anton S, Carter CS, Scarpace PJ (2011) The act of voluntary wheel running reverses dietary hyperphagia and increases leptin signaling in ventral tegmental area of aged obese rats. Gerontology 57(4):335–342 [DOI] [PMC free article] [PubMed] [Google Scholar]
- Shimizu Y, Son C, Aotani D, Nomura H, Hikida T, Hosoda K, Nakao K (2017) Role of leptin in conditioned place preference to high-fat diet in leptin-deficient ob/ob mice. Neurosci Lett 640:60–63 [DOI] [PubMed] [Google Scholar]
- Speisman RB, Kumar A, Rani A, Foster TC, Ormerod BK (2013) Daily exercise improves memory, stimulates hippocampal neurogenesis and modulates immune and neuroimmune cytokines in aging rats. Brain Behav Immun 28:25–43 [DOI] [PMC free article] [PubMed] [Google Scholar]
- Sun B, Liang N-C, Ewald ER, Purcell RH, Boersma GJ, Yan J, Tamashiro KL (2013) Early postweaning exercise improves central leptin sensitivity in offspring of rat dams fed high-fat diet during pregnancy and lactation. Am J Physiol-Regul Integr Comp Physiol 305(9):R1076–R1084 [DOI] [PMC free article] [PubMed] [Google Scholar]
- Suriagandhi V, Nachiappan V (2022) Protective effects of melatonin against obesity-induced by leptin resistance. Behav Brain Res 417:113598 [DOI] [PubMed] [Google Scholar]
- Uysal N, Agilkaya S, Sisman AR, Camsari UM, Gencoglu C, Dayi A, Kiray M (2017) Exercise increases leptin levels correlated with IGF-1 in hippocampus and prefrontal cortex of adolescent male and female rats. J Chem Neuroanat 81:27–33 [DOI] [PubMed] [Google Scholar]
- Van Doorn C, Macht VA, Grillo CA, Reagan LP (2017) Leptin resistance and hippocampal behavioral deficits. Physiol Behav 176:207–213 [DOI] [PMC free article] [PubMed] [Google Scholar]
- Wu C, Yang L, Li Y, Dong Y, Yang B, Tucker LD, Zhang Q (2020) Effects of exercise training on anxious–depressive-like behavior in Alzheimer rat. Med Sci Sp Exerc 52(7):1456 [DOI] [PMC free article] [PubMed] [Google Scholar]
- Yadav A, Kataria MA, Saini V, Yadav A (2013) Role of leptin and adiponectin in insulin resistance. Clin Chim Acta 417:80–84 [DOI] [PubMed] [Google Scholar]
- Yi SS (2015) Effects of exercise on brain functions in diabetic animal models. World J Diabetes 6(4):583 [DOI] [PMC free article] [PubMed] [Google Scholar]
- Yook JS, Rakwal R, Shibato J, Takahashi K, Koizumi H, Shima T, Soya H (2019) Leptin in hippocampus mediates benefits of mild exercise by an antioxidant on neurogenesis and memory. Proc Natl Acad Sci 116(22):10988–10993 [DOI] [PMC free article] [PubMed] [Google Scholar]
- Zhao J, Tian Y, Xu J, Liu D, Wang X, Zhao B (2011) Endurance exercise is a leptin signaling mimetic in hypothalamus of Wistar rats. Lipids Health Dis 10(1):1–7 [DOI] [PMC free article] [PubMed] [Google Scholar]
- Zhou Y, Rui L (2013) Leptin signaling and leptin resistance. Front Med 7(2):207–222 [DOI] [PMC free article] [PubMed] [Google Scholar]
Associated Data
This section collects any data citations, data availability statements, or supplementary materials included in this article.
Supplementary Materials
Data Availability Statement
Data that support the findings of this study are available at Kerman University of Medical Sciences.