Abstract
Early expansion and long-term persistence predict efficacy of chimeric antigen receptor T cells (CARTs)1–7, but mechanisms governing effector versus memory CART differentiation and whether asymmetric cell division induces differential fates in human CARTs remain unclear. Here we show that target-induced proximity labelling enables isolation of first-division proximal-daughter and distal-daughter CD8 CARTs that asymmetrically distribute their surface proteome and transcriptome, resulting in divergent fates. Target-engaged CARs remain on proximal daughters, which inherit a surface proteome resembling activated-undivided CARTs, whereas the endogenous T cell receptor and CD8 enrich on distal daughters, whose surface proteome resembles resting CARTs, correlating with glycolytic and oxidative metabolism, respectively. Despite memory-precursor phenotype and in vivo longevity, distal daughters demonstrate transient potent cytolytic activity similar to proximal daughters, uncovering an effector-like state in distal daughters destined to become memory CARTs. Both partitioning of pre-existing transcripts and changes in RNA velocity contribute to asymmetry of fate-determining factors, resulting in diametrically opposed transcriptional trajectories. Independent of naive, memory or effector surface immunophenotype, proximal-daughter CARTs use core sets of transcription factors known to support proliferation and effector function. Conversely, transcription factors enriched in distal daughters restrain differentiation and promote longevity, evidenced by diminished long-term in vivo persistence and function of distal-daughter CARTs after IKZF1 disruption. These studies establish asymmetric cell division as a framework for understanding mechanisms of CART differentiation and improving therapeutic outcomes.
Subject terms: T cells, Drug development, Synthetic biology, Lymphocyte differentiation, Translational immunology
We show that target-induced proximity labelling enables isolation of first-division CD8 chimeric antigen receptor T cells that asymmetrically distribute their surface proteome and transcriptome, resulting in distinct phenotypic, metabolic and functional profiles in proximal and distal daughter cells.
Main
Long-term CART persistence is associated with superior therapeutic outcome and is attributed to the formation of long-lived memory CARTs that afford continuous immunosurveillance to prevent cancer recurrence1–7. In mouse models of infection and ovalbumin immunization, asymmetric cell division (ACD) has been observed as one mechanism of memory formation after CD8 T cell activation8–11. The daughter cell proximal to the antigen presenting cell inherits the immunologic synapse, shows a moderate increase in CD8 surface expression8 and is more likely to differentiate into a short-lived effector T (Teff) cell. The distal-daughter cell, conversely, becomes a long-lived memory cell with distinct transcriptional12, epigenetic13 and metabolic profile9. Despite considerable interest in CART phenotypes and memory formation over the past decade, the cellular mechanisms underlying the development of long- or short-lived CARTs and specifically whether ACD has a role in this process, remain unclear. Whereas complete remissions after CART therapy are possible, a substantial proportion of patients relapse due to lack of CART persistence6,7, suggesting that understanding cellular mechanisms of human memory CART formation are crucial for improving CART therapy outcomes.
LIPSTIC identifies ACD in CARTs
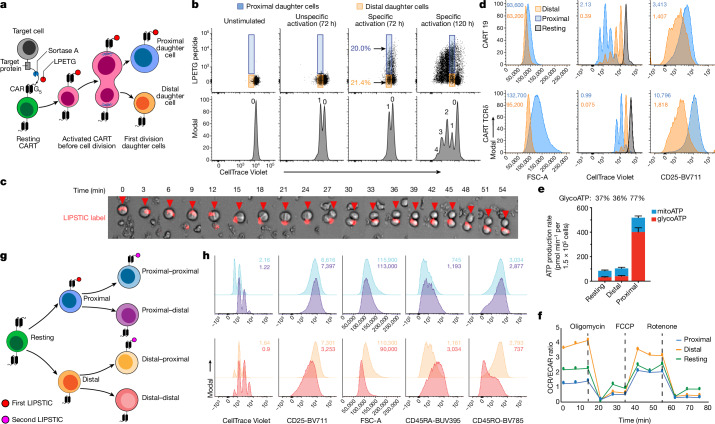
Target recognition by CARTs is major histocompatibility complex- and therefore CD8 coreceptor-independent14. We reasoned that target-induced labelling of CAR molecules within the immunologic synapse, instead of surface CD8 expression levels, could be used to distinguish and characterize first-division proximal- and distal-daughter CARTs, as proximal-daughter CARTs, by definition, have made physical contact with the target cell. We therefore optimized a technique known as labelling immune partnerships by sor-tagging intercellular contacts (LIPSTIC)15 to perform sortase A enzyme-mediated irreversible labelling of CAR molecules within the immunologic synapse (Fig. 1a and Extended Data Figs. 1 and 2a–e).
Fig. 1. LIPSTIC distinguishes first-division proximal and distal-daughter CARTs.
a, Schematic for the LIPSTIC assay to discriminate first-division proximal- and distal-daughter CARTs. G5, N-terminal pentaglycine tag. b, Representative flow cytometry plot of LIPSTIC labelling and cell division following activation. Unstimulated indicates donor-matched CARTs cultured without target cells. Unspecific activation indicates anti-CD3/anti-CD28 beads, versus specific activation through the CAR by LPETG-labelled target Nalm6 cells. Gating strategy in Extended Data Fig. 2g. c, LPETG label (red) retention on one daughter CART cell following first cell division after specific activation; photographs were acquired every 3 min. d, Representative flow cytometry histograms of bulk anti-CD19 and anti-TCRδ CARTs 3 days after isolating first-division daughter cells from in vitro coincubation. e, ATP production rate of sorted first-division proximal- and distal-daughter bulk CARTs comparing mitochondrial (mitoATP) to glycolytic (glycoATP) ATP production. Error bars indicate mean + standard deviation from four replicates for resting and distal and five replicates for proximal. f, Oxygen consumption rate (OCR)/extracellular acidification rate (ECAR) ratio of resting and sorted proximal- and distal-daughter CD8 CARTs. g,h, First-division distal-daughter CARTs show ACD following second target encounter. g, Schematic of isolating second-division daughter CARTs after second target engagement. h, Representative flow cytometry histograms of CD8 CART progeny 2 days after second-division daughter cell isolation. Median fluorescence intensity or division index is shown in the histogram plots (d,h). Plots are representative of 2–5 independent experiments with CARTs from distinct donors.
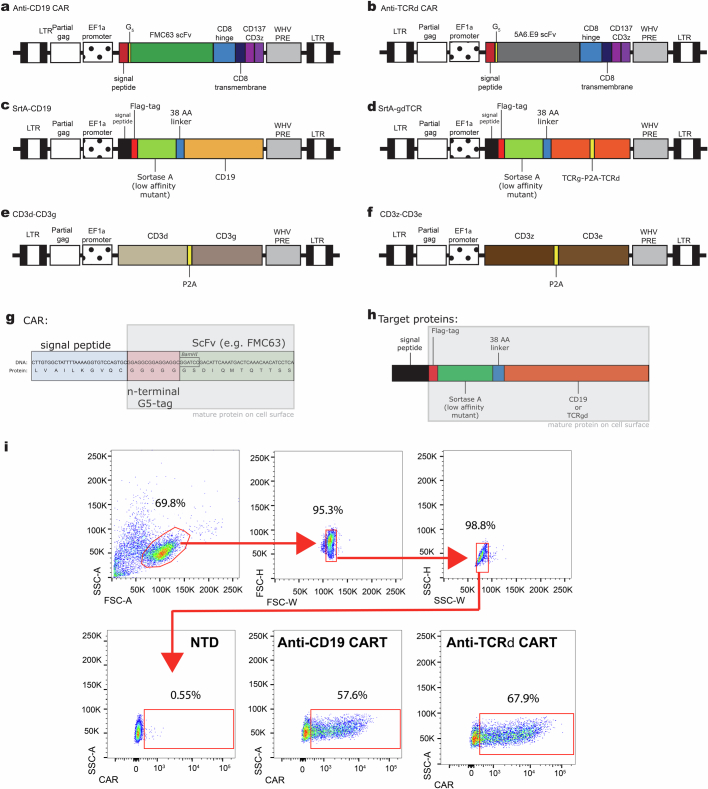
Extended Data Fig. 1. Schematics of CAR and target protein lentiviral constructs.
a, N-terminal pentaglycine (G5) anti-CD19 CAR (clone FMC63). b, N-terminal pentaglycine anti-TCRδ CAR (clone: 5A6.E9). c, Sortase-A linked CD19. d-f, Sortase-A linked TCRγ with TCRδ (d); CD3δ and CD3γ (e); and CD3ζ and CD3ε (f) for generating sortase-A linked γδ TCR target cells. g, Nucleotide and amino acid sequence of the N-terminus of CAR constructs showing the signal peptide, pentaglycine tag, and N-terminal portion of the anti-CD19 scFv. Gray rectangle indicates start of mature protein sequence. h, Schematic of sortase-A linked target protein; gray rectangle indicates mature protein. i, Representative flow staining of surface G5 anti-CD19 CAR and G5 anti-TCRδ CAR. LTR, long terminal repeat; scFv, single chain variable fragment; WHV PRE, woodchuck hepatitis virus post-transcriptional regulatory element; SrtA, sortase-A. Sequences of displayed constructs can be found in Supplementary Table 1.
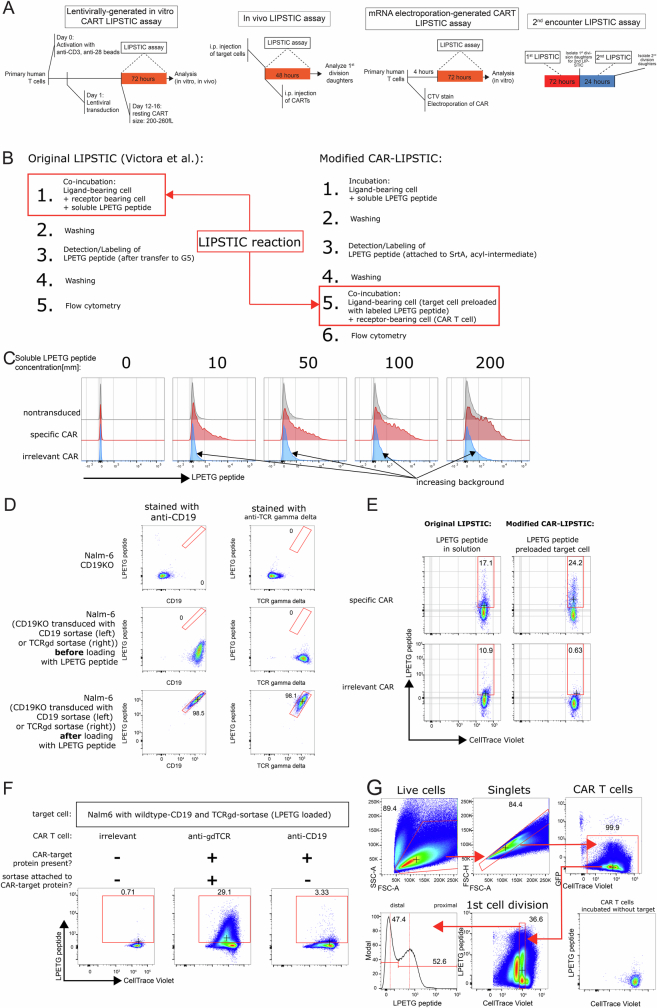
Extended Data Fig. 2. Modified LIPSTIC assay specifically labels proximal-daughter CARTs using sortase-A linked target.
a, Timeline of lentivirally-transduced CART in vitro and in vivo LIPSTIC assay, electroporated CART in vitro LIPSTIC assay (for TN and TEff CART experiments), and second target encounter LIPSTIC assay. b, Comparison of previously described LIPSTIC and modified CAR-LIPSTIC protocols for specific labeling and sorting of proximal versus distal daughter CARTs. In the modified CAR-LIPSTIC approach, ligand-bearing target cells with sortase-A are incubated (‘preloaded’) with soluble biotinylated LPETG peptide, washed, and subsequently stained with streptavidin-fluorophore to detect LPETG peptides attached to sortase-A. Labeled target cells are co-incubated with CART cells, and LIPSTIC labeling of CAR molecules is analyzed by flow cytometry. c, Titration of soluble LPETG peptide concentration using the previously described LIPSTIC assay demonstrates increasing non-specific signal on nontransduced T cells and irrelevant CAR T cells with increasing LPETG peptide concentration (gated on live, singlet cells). d, Flow cytometry plots (gated on live, singlet cells) demonstrating the expression of sortase-A linked target protein (CD19 or γδTCR) and co-detection of LPETG peptide and sortase-A linked target proteins before and after LPETG peptide incubation. e, Flow cytometry plots (gated on live, singlet cells) showing increased LPETG label detection on target-specific CAR and decreased LPETG background labeling on irrelevant CAR when using the modified CAR-LIPSTIC approach compared to the previously described LIPSTIC approach. f, Flow cytometry plots demonstrating specific labeling of CAR targeting sortase-A linked target protein. Anti-CD19 and anti-γδTCR CAR T cells proliferate (determined by CellTrace Violet dilution) when coincubated with wild-type CD19- and γδTCR-sortase-expressing Nalm6 cells, but only the anti-γδTCR CAR is labeled with the LPETG peptide after coincubation. This demonstrates that LIPSTIC labeling is proximity sensitive, i.e. CART interaction with sortase-positive cells (where sortase is attached to a surface protein that is not in proximity to the CAR target) is not sufficient to label CARs; instead, the sortase enzyme has to be attached to the CAR target in order to facilitate labeling. g, Gating strategy for the discrimination of first-division proximal- and distal-daughter CARTs.
On formation of cell–cell conjugates, the LIPSTIC label is immediately enriched at the immune synapse and specifically transferred from the target to the CART cell (Supplementary Video 1 and Extended Data Fig. 2f). Flow cytometric characterization of first-division daughter CARTs demonstrates an equal percentage of LIPSTIC+ and LIPSTIC− cells (Fig. 1b and Extended Data Fig. 2g), suggesting asymmetric distribution of LIPSTIC among first-division daughter cells. Live-cell imaging of LIPSTIC-labelled CART during the first mitosis after activation confirms that the LIPSTIC label is exclusively retained on one daughter cell during mitosis while the other daughter cell remains label-free (Fig. 1c and Supplementary Video 2).
LIPSTIC+ first-division daughter CARTs generated in vitro from bulk T cells show an increase in cell size, CD25 surface expression and subsequent proliferative pace (Fig. 1d and Extended Data Fig. 3a). Consistent with metabolic asymmetry observed in activated mouse T cells9,10, LIPSTIC+ first-division daughter cells demonstrate increased metabolic activity compared to LIPSTIC− first-division daughters and shift to glycolysis as their predominant metabolic state (Fig. 1e), supporting increased cell size and proliferation rate in proximal daughters. By contrast, distal daughters show only a minor increase in metabolic activity compared to resting T cells and rely predominantly on oxidative phosphorylation (Fig. 1f). Collectively, these data establish that the first cell division of human CARTs after activation is asymmetric and that LIPSTIC+ and LIPSTIC− daughter cells represent proximal and distal-daughter CARTs, respectively.
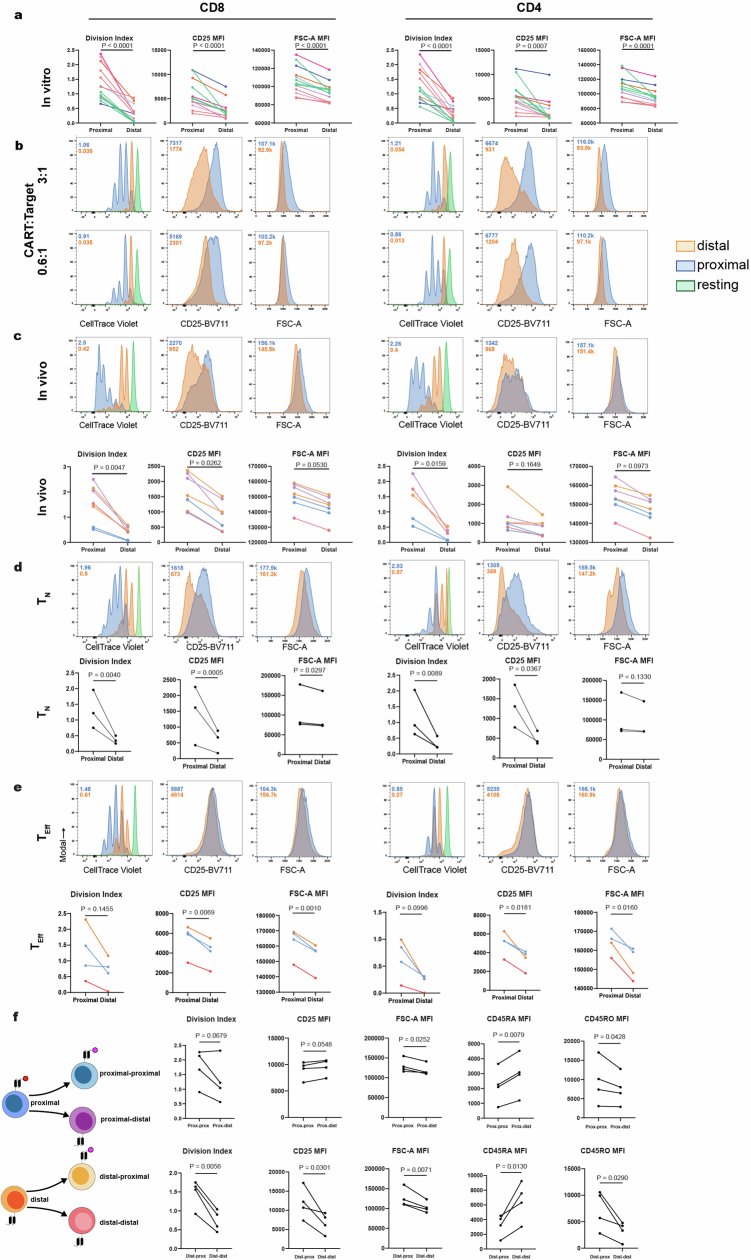
Extended Data Fig. 3. CART subsets exhibit ACD following first and second target encounter.
a-d, Representative flow cytometry histograms and summary statistics of CD8 (left) and CD4 (right) proximal-daughter and distal-daughter CART progeny 3 days after first-division daughter cell isolation. (a) Summary of in vitro LIPSTIC assays (n = 13, 8 distinct donors), (b) First-division daughters isolated after LIPSTIC assay coincubation using 3:1 or 0.6:1 CART:target ratio in vitro, (c) first-division daughters isolated after in vivo activation (n = 5 for CD4 Division Index, n = 7 for other measurements, 4 distinct donors), (d) first-division daughters isolated from CARTs generated in vitro from TN cells (n = 3 from distinct donors), (e) first-division daughters isolated from CARTs generated in vitro from Teff cells (n = 4, 3 distinct donors). f, Division index or median fluorescence intensity of CD8 proximal-proximal, proximal-distal, distal-proximal, and distal-distal daughter CART progeny 2 days after second-division daughter cell isolation (n = 4 from distinct donors). CD8 cells were gated on CTV+CD8+ singlets, and CD4 cells were gated on CTV+CD4+ singlets. In (b), (c), and (e), each color within the same panel represents a distinct donor, with the same colors representing technical replicates, and in (d) and (f), each connected pair represents a distinct donor. Data from both anti- TCRδ CARTs and anti-CD19 CARTs are combined. Statistical significance was determined using two-tailed ratio paired t-test.
ACD occurs across CART subsets
Most current FDA-approved CART therapies are heterogeneous infusion products manufactured from bulk T cells in various differentiation stages16–19; nevertheless, we evaluated whether specific CART subsets (CD4/CD8, naive/effector) show ACD. First-division daughters of both CD8 and CD4 CARTs showed asymmetry in cell size, CD25 surface expression and subsequent proliferative pace across a range of CART:target ratios in vitro, findings that are mostly preserved after in vivo CART labelling (Extended Data Figs. 2a and 3b,c). To determine whether different immunophenotypic CART subsets show ACD, we generated CARTs from naive (CD62L+CD45RO−) or effector (CD62L−) T cells and phenotyped first-division daughter cells. First-division daughters of naive-derived CARTs showed asymmetry in cell size, CD25 expression and proliferative pace, similar to observations with bulk CARTs. First-division daughters of effector-derived CARTs showed a trend towards differences in proliferative pace, although minimal differences in CD25 and cell size were observed in effector-derived CARTs compared to naive-derived CARTs (Extended Data Fig. 3d,e).
To test whether ACD is restricted to the first cell division, we isolated first-division proximal- and distal-daughter CARTs and immediately re-exposed them to target cells bearing a different fluorescent LIPSTIC label (Fig. 1g and Extended Data Fig. 2a). We observed asymmetry in proliferation, cell size and surface expression of CD25, CD45RA and CD45RO in progeny of second-division distal–proximal and distal–distal CARTs, whereas the phenotypes of proximal–proximal and proximal–distal CARTs paralleled those of effector CARTs, with a trend towards differences in proliferation rate but minimal differences in cell size and surface phenotypic markers (Fig. 1h and Extended Data Fig. 3f). Thus, CAR-induced ACD is widely detectable across T cell subsets and occurs both in vitro and in vivo, and distal-daughter cells retain the ability to undergo ACD on subsequent target cell encounter.
Longevity of distal-daughter CARTs
To test the functional relevance of the observed flow cytometric and metabolic asymmetry in first-division CARTs, we first compared the longevity of proximal daughters and distal daughters in vivo (Fig. 2a). We injected sorted proximal-daughter or distal-daughter CARTs into NOD.Cg-Prkdcscid Il2rgtm1Wjl/SzJ (NOD-scid-gamma (NSG)) mice, followed by injection of Nalm6 leukaemia cells 35 days later to evaluate engraftment and persistence of injected CARTs. Then 30 days after T cell injection, mice that received distal-daughter CARTs showed greater peripheral T cell counts compared to mice that received proximal-daughter CARTs, suggesting greater engraftment and persistence of distal-daughter CARTs in vivo (Fig. 2b). After Nalm6 challenge, only distal daughters were able to control leukaemic outgrowth (Fig. 2c,d and Extended Data Fig. 4a). Mice that received distal daughters had greater T cell counts in the spleen compared to mice that received proximal daughters and demonstrated a preservation of naive (TN)-like immunophenotypes, suggesting continued in vivo self-renewal by distal-daughter CARTs (Fig. 2e,f). These data indicate that proximal daughters show short in vivo lifespan and functionally establish distal daughters as precursors of long-lived memory CART in vivo.
Fig. 2. Distal-daughter CARTs show superior in vivo functional persistence.
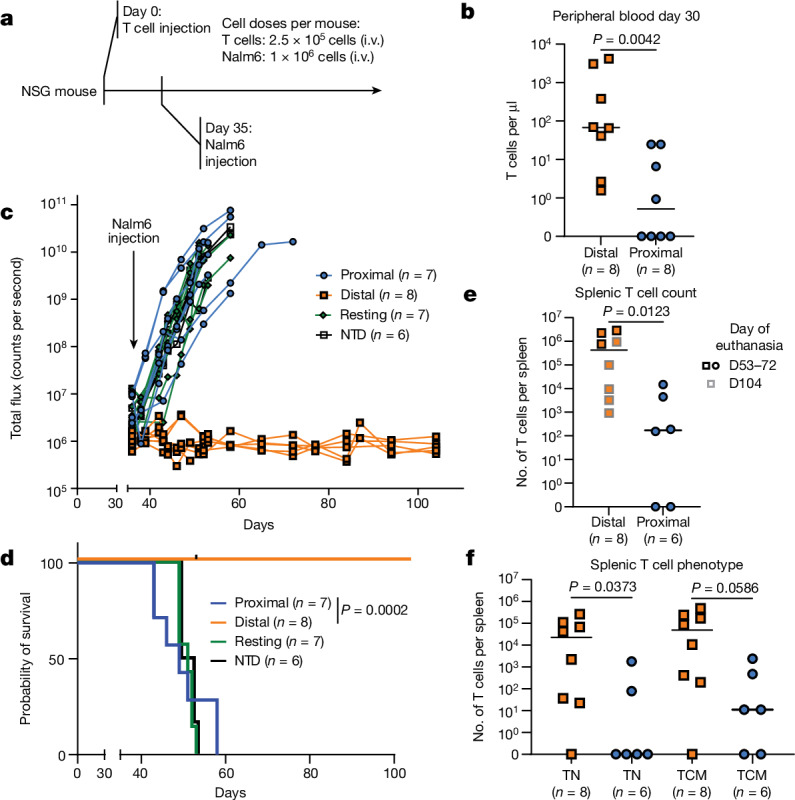
a, NSG mice are injected with proximal-daughter CARTs, distal-daughter CARTs, resting CARTs or non-transduced (NTD) T cells and subsequently challenged with Nalm6 cells 35 days later. b, Peripheral blood T cell count on 30 days after T cell injection. Lines represent the medians. c, Bioluminescence imaging quantification of Nalm6 cells in NSG mice. d, Kaplan–Meier survival curve. Dashes indicate censored data. e,f, Splenic T cell counts. Lines represent the medians. e, Total splenic T cell counts. f, Splenic counts by TCM (CD62L+CD45RA−) and TN (CD62L+CD45RA+) phenotype. Data pooled from three independent experiments with distinct donors (n = 6–8 mice per condition). Statistical significance was determined using a log-rank test (d) and two-tailed Mann–Whitney test (b,e,f). i.v., intravenous.
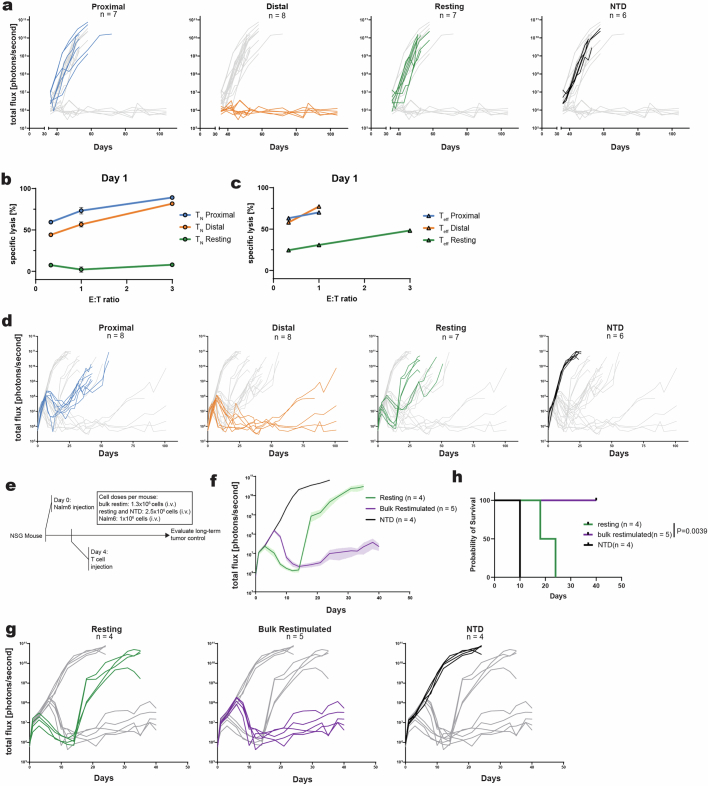
Extended Data Fig. 4. First-division daughter and bulk restimulated CARTs exhibit potent tumor lysis and in vivo tumor control.
a, Bioluminescence imaging quantification of Nalm6 cells in NSG mice depicted in Fig. 2c by treatment group (n = 6–8 mice per treatment group pooled from 3 independent experiments).b-c, 20-hour in vitro cytotoxicity data of proximal-daughter, distal-daughter, and resting CARTs 1 day after first cell division of (b) TN-derived or (c) Teff-derived CARTs. Data points represent the mean (n = 3 replicates for all groups except n = 2 replicates for Teff proximal and distal) and error bars represent standard error of the mean in (b). d, Bioluminescence imaging quantification of Nalm6 cells in NSG mice depicted in Fig. 3c by treatment group (n = 6–8 mice per treatment group pooled from 3 independent experiments). e, Experimental design evaluating acute tumor control of bulk restimulated CARTs, resting CARTs, and NTD. f-g, Bioluminescence imaging quantification of Nalm6 cells in the NSG mouse model. In f, lines represent means and shaded areas represent standard error of the mean. h, Kaplan–Meier survival curve. Dashes indicate censored data. (f-h) n = 4–5 mice per treatment group from one experiment, with NTD and resting conditions constituting a subset of replicates displayed in Fig. 3c and Extended Data Fig. 4d. Statistical significance was determined using and log-rank test in (g).
Effector function in distal daughter CARTs
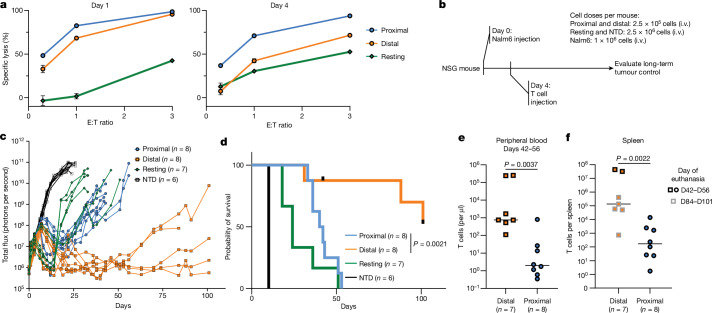
We next characterized the cytotoxic capacity of first-division daughter cells in vitro. As expected, proximal daughters demonstrate potent cytotoxic activity with substantial killing at very low effector:target ratios, surpassing the cytotoxicity of resting CARTs (Fig. 3a). Unexpectedly, distal daughters also demonstrated potent cytotoxic activity, with similar specific lysis of target cells as proximal daughters at a 3:1 effector:target ratio (Fig. 3a). Distal daughters isolated from TN-like or Teff CARTs also showed similar cytotoxic potency to their proximal-daughter counterparts and were more cytolytic than their resting counterparts (Extended Data Fig. 4b,c), suggesting that the cytotoxic activity of distal daughters of bulk CARTs was not solely due to the enrichment of distal-daughter cells of a particular immunophenotypic subset. By day 4 after first cell division, however, the cytotoxic activity of distal daughters decreased and more closely resembled resting CARTs (Fig. 3a). These data indicate that target cell encounter and subsequent activation induces a transient state of increased cytotoxic potency in both proximal daughters and distal daughters, despite the latter showing an overall less activated flow cytometric and metabolic phenotype compared to proximal daughters and ultimately demonstrating greater ability for long-term in vivo persistence and function.
Fig. 3. First-division daughter CARTs demonstrate distinct patterns of cytotoxic activity and in vivo leukaemia control.
a, Twenty-hour in vitro cytotoxicity assay data performed 1 day (left) or 4 days (right) after first-division daughter cell isolation. Data points represent the mean of triplicates and error bars represent standard error of the mean. E:T, effector:target ratio. b, CARTs are injected into Nalm6-bearing NSG mice 4 days after engraftment. c, Bioluminescence imaging quantification of Nalm6 cells in NSG mice. d, Kaplan–Meier survival curve. Dashes indicate censored data. e, Peripheral blood T cell count on days 42–56 after Nalm6 injection. Lines represent the medians. f, Total splenic T cell counts. Lines represent the medians. Data pooled from three independent experiments with distinct donors (n = 6–8 mice per condition). Statistical significance was determined using a log-rank test in d and two-tailed Mann–Whitney test in e,f.
Next, we tested whether distal-daughter CARTs could show effector cytotoxic function in vivo (Fig. 3b). We used a previously established stress-test model in which subtherapeutic numbers of CARTs are injected into leukaemia-bearing mice to compare cytotoxic function and longevity between treatment groups20,21. We observed an initial decline of leukaemia burden after treatment with proximal-daughter and distal-daughter CARTs, consistent with their cytotoxic activity in vitro (Fig. 3c and Extended Data Fig. 4d). However, following the initial decline of leukaemia burden, mice treated with proximal-daughter CARTs had a gradual loss of leukaemia control consistent with a short-lived effector phenotype, whereas mice treated with distal daughters showed longer-term control of leukaemia outgrowth (Fig. 3d). Proximal-daughter CARTs showed reduced frequencies in blood on days 42–50, consistent with their terminal differentiation in vivo that resulted in reduced long-term leukaemia control, whereas distal-daughter CART progeny demonstrated long-term engraftment and greater splenic T cell counts up to day 101 (Fig. 3e,f). Thus, distal daughters transiently show effector functions in vivo and show greater longevity and replicative potential even with repeated target engagement. The therapeutic advantages of distal-daughter CARTs may be achieved without specifically isolating for distal daughters, because, despite receiving a lower T cell dose, mice treated with unsorted restimulated CARTs showed greater tumour control compared to mice treated with resting CARTs (Extended Data Fig. 4e–h). These findings highlight the potential benefit of on-target restimulation during CART manufacturing to achieve controlled, optimal CART expansion, which is a pivotal factor in CART therapy, especially as inadequate expansion is linked to poorer outcomes in malignancy control6.
Single-cell profiling of ACD in CD8 CARTs
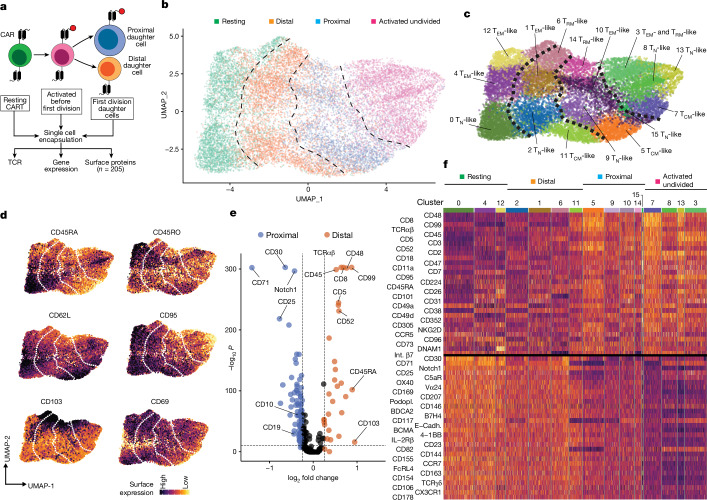
Given the functional differences between proximal- and distal-daughter CARTs, we next sought to investigate the mechanisms during ACD that drive the distinct fates and functions of first-division daughter cells. We used single-cell profiling to simultaneously characterize CD8 CARTs in regard to surface protein expression, transcriptional activity and T cell receptor (TCR) clonality, an approach that better resolves subset identity of mature T cells compared to transcriptional analysis alone22,23 (Fig. 4a). Dimensionality reduction of antibody-derived sequencing data with uniform manifold approximation and projection (UMAP) demonstrates separation of resting from activated CARTs before the first cell division (Fig. 4b), reflecting activation-induced changes in the surface protein landscape of CD8 CARTs. First-division daughter cells occupy the space between resting and activated-undivided T cells, with a clear distinction between proximal and distal daughters (Fig. 4b). These data indicate that activated CARTs establish asymmetry of the cell surface proteome during the first cell division.
Fig. 4. Proximal-daughter and distal-daughter CD8 CARTs show asymmetry in surface protein expression.
a, Schematic for single-cell proteomic, transcriptomic and TCR analysis of first-division daughter, resting and activated CD8 CARTs before first cell division. b,c, UMAP plot using surface protein expression coloured by LIPSTIC assay cell population (b) and unsupervised clustering with cluster assignments made using a combination of transcriptional activity and surface proteins (c) as in Extended Data Fig. 5d. Dashed lines indicate borders between proximal, distal, resting and activated-undivided CARTs. d, Normalized single-cell surface protein levels. e, Volcano plot illustrating differentially abundant surface proteins on proximal-daughter and distal-daughter CARTs. The dashed lines denote cut-offs defined by isotype controls (log2 fold change 0.25; adjusted P value 10−11). f, Heat map of normalized surface protein levels showing the top 30 proteins enriched in either distal (top half) or proximal (bottom half) daughter CARTs in comparison to resting and activated-undivided CARTs. The top colour bar refers to clusters in c. Plots are representative of two independent experiments using the anti-CD19 CARTs and anti-TCRδ CARTs from distinct donors. Statistical significance was determined using two-tailed Wilcoxon rank-sum test with Benjamini–Hochberg correction for multiple comparisons (e).
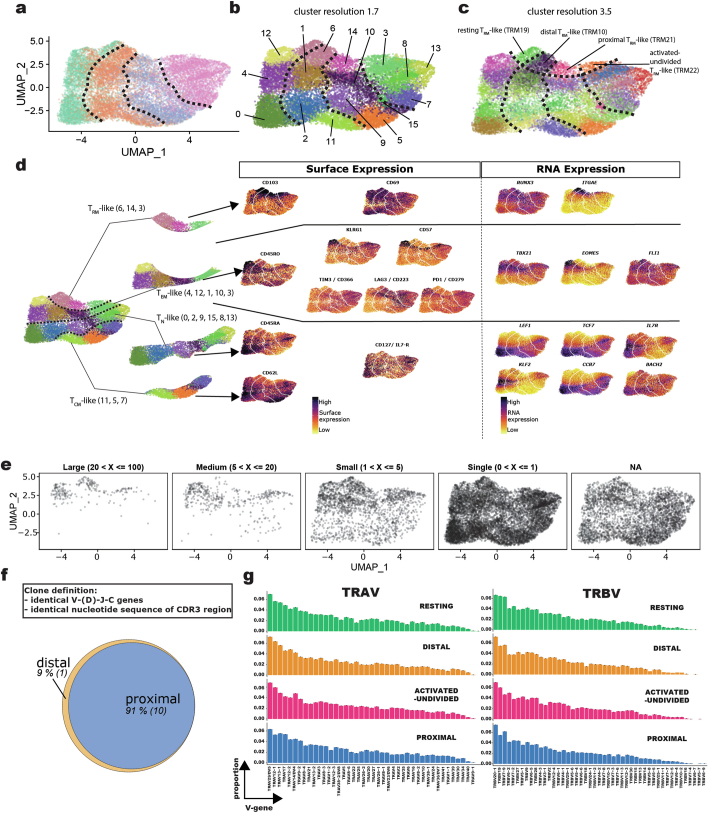
We performed unsupervised clustering of CD8 CARTs based on surface protein expression (Fig. 4c). Consistent with the asymmetric partitioning of surface proteins, clusters largely respect the borders between resting, distal and proximal daughters, and activated-undivided cells, allowing cluster-wise comparison of proximal and distal-daughter CARTs. An exception was cluster 6, which contained cells from both resting and distal-daughter populations but separated into two clusters consistent with distal-daughter and resting CARTs after increasing the clustering resolution (Extended Data Fig. 5a–c). We assigned clusters into four immunophenotypic subsets resembling TN-like, central-memory (TCM)-like, effector-memory (TEM)-like and tissue-resident-memory (TRM)-like subsets based on a combination of surface protein expression and RNA expression (Fig. 4d and Extended Data Fig. 5d). Expanded T cell clones (defined by endogenous TCRα and TCRβ chains) were highly enriched in TEM and TRM subsets (Extended Data Fig. 5e), consistent with clonal enrichment commonly found in effector subsets24,25. Furthermore, 91% of expanded T cell clones were shared between proximal and distal CARTs, and proximal and distal CARTs demonstrate comparable TCR V-gene usage, thus demonstrating similar clonal distribution and independently supporting accurate identification of first-division proximal- and distal-daughter cells (Extended Data Fig. 5f,g).
Extended Data Fig. 5. Simultaneous surface proteomic and transcriptional profiling reveals CD8+ CART subsets, expanded T-cell clones in effector subsets, and clonal overlap between proximal- and distal-daughter CARTs.
a, UMAP plot using surface protein expression colored by LIPSTIC-sorted cell population. b-c, Unsupervised clustering of UMAP plot using (b) cluster resolution 1.7 and (c) cluster resolution 3.5. d, Using cluster resolution 1.7, clusters were assigned to TN-like (expression of CD45RA, CD62L, IL7-R, TCF7, LEF1, CCR7, KLF2, and BACH2), TCM-like (expression of CD62L, CD45RO, LEF1, CCR7, and absence of CD45RA), TEM-like (expression of CD45RO, KLRG1, CD57, TBX21, EOMES, FLI1 and RUNX3 and absence of CD62L), and TRM-like (expression of CD103, CD69, ITGAE, and RUNX3) subsets using surface protein and gene expression. UMAP plots identical to Fig. 5a (shown here for subset identification). e, UMAP plot based on the size of each cell’s clonotype. Clonotype is defined by identical V, D (if applicable), J, and C genes in addition to identical CDR3 nucleotide sequences on both the TCRα and TCRβ chains. The large and medium clonotypes were predominantly detected in TRM- and TEM-like clusters. f, Venn diagram showing the overlap of the top 10 expanded clonotypes in proximal daughters and their overlap with distal-daughter clonotypes. Of the 11 expanded clonotypes detected across proximal- and distal-daughter populations, 10 clonotypes are detected in both first-division daughter cell populations. g, Proportion of TRAV and TRBV gene usage in resting, distal, activated-undivided, and proximal CARTs. V-gene usage is similar across the T-cell groups, without notable V-gene skewing.
Asymmetric division of surface proteome
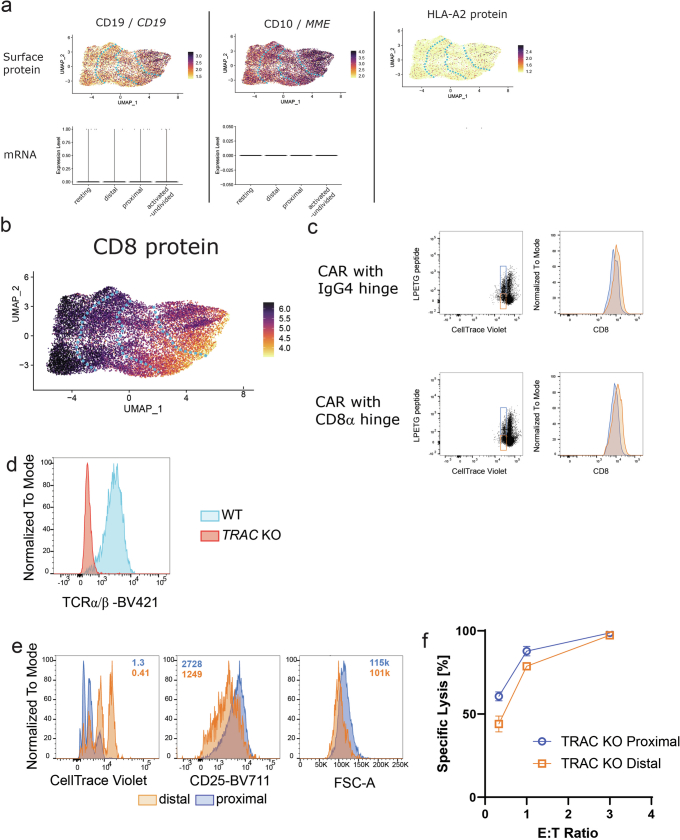
We molecularly define the surface proteomic differences that distinguish proximal-daughter from distal-daughter CARTs. Pairwise comparison of proximal and distal daughters demonstrates increased surface expression for CD45RA on distal daughters and for CD25 on proximal daughters (Fig. 4e), consistent with our flow cytometry data. Distal daughters demonstrated a notable increase in CD5, which is of interest given the previously reported antiproliferative effect of CD5 in human T cells26. Proximal daughters showed enrichment of several proteins (for example, CD19 and CD10) expressed by B cells but not T cells. As CD19 and CD10 are expressed on Nalm6 cells and the CARTs do not show transcriptional activity for CD19 and CD10 (Extended Data Fig. 6a), we presume these proteins were transferred from target to CART by trogocytosis27. In contrast to previous studies characterizing ACD in mouse or human T cells after stimulation of the endogenous TCR8,28, we observed increased expression of the endogenous TCR and CD8 coreceptor on distal daughters as opposed to proximal daughters (Fig. 4e and Extended Data Fig. 6b). This phenomenon was independent of the CAR hinge as it occurred with both CD8- and IgG4-derived hinge domains (Extended Data Fig. 6c). Furthermore, we observe key phenotypes of ACD in the absence of endogenous TCR (Extended Data Fig. 6d–f). These findings highlight that CAR-induced ACD shows unique features compared to endogenous TCR-induced ACD.
Extended Data Fig. 6. Simultaneous surface protein and gene expression detection demonstrates trogocytosis of B-cell-associated proteins from Nalm6 target cells to CARTs and surface CD8 enrichment in first-division distal-daughter CARTs.
a, Normalized B-cell-associated CD19 and CD10 protein detection on CARTs is displayed on UMAP plots in the top row, and normalized gene expression levels for these proteins in resting, distal, proximal, and activated-undivided CARTs are plotted in the bottom row. Absence of gene expression but detection of surface proteins supports transfer of these proteins from target cells to CARTs. HLA-A2 serves as isotype control. b, Normalized surface expression of CD8 displayed on UMAP plot demonstrating enrichment of CD8 on resting and distal-daughter CARTs over activated-undivided and proximal-daughter CARTs. c, Distal-daughter CARTs isolated when using CAR constructs with either an IgG4 hinge or a CD8α hinge demonstrate higher CD8 surface levels by flow cytometry compared to proximal-daughter CARTs. Cells are pregated on singlet cells. d, TCRα/β surface expression of WT or TRAC KO T cells. Cells are pregated on singlet cells. e, Flow cytometry histograms of proximal-daughters and distal-daughters generated from CD8 TRAC KO CARTs 3 days following first-division daughter cell isolation. Cells are gated on singlet CD8+ cells. f, In vitro cytotoxicity assay of bulk TRAC KO proximal-daughter and distal-daughter performed within one day after isolation of first-division daughter CARTs. Data points represent mean of triplicates, error bars represent standard deviation. Plots representative of 2–3 independent experiments with CARTs from distinct donors.
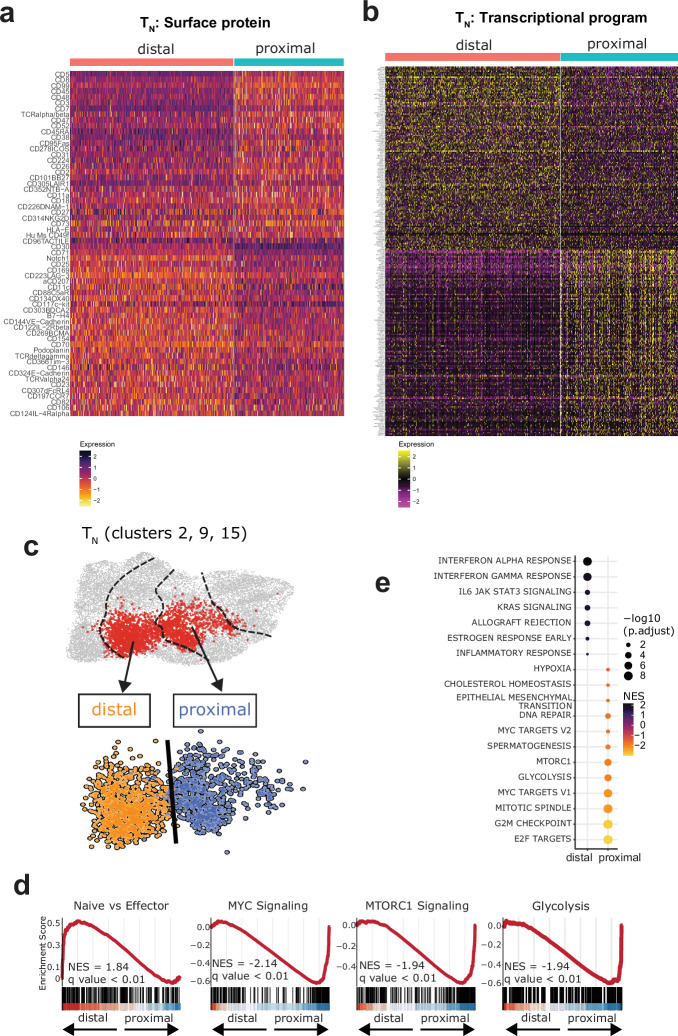
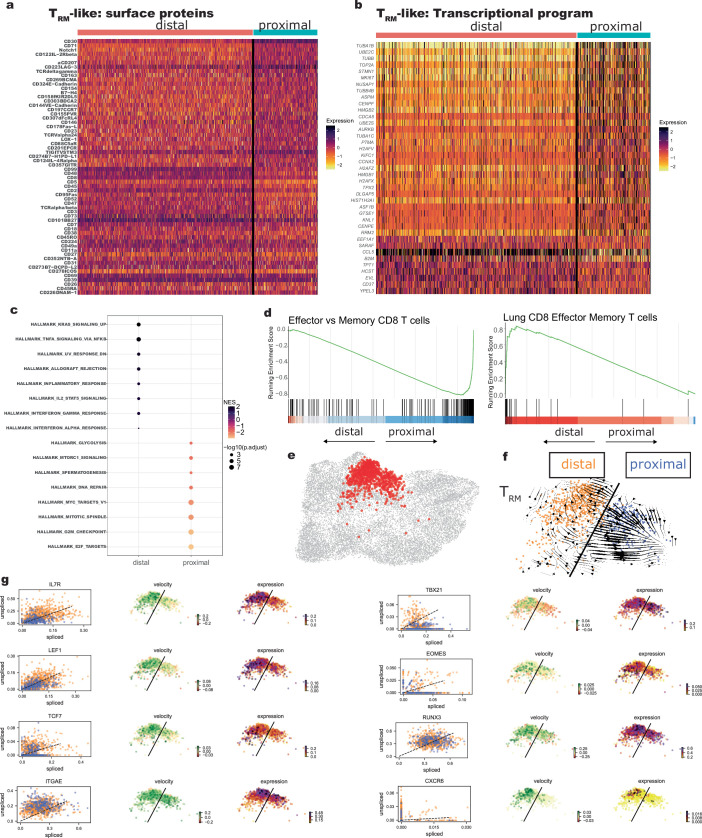
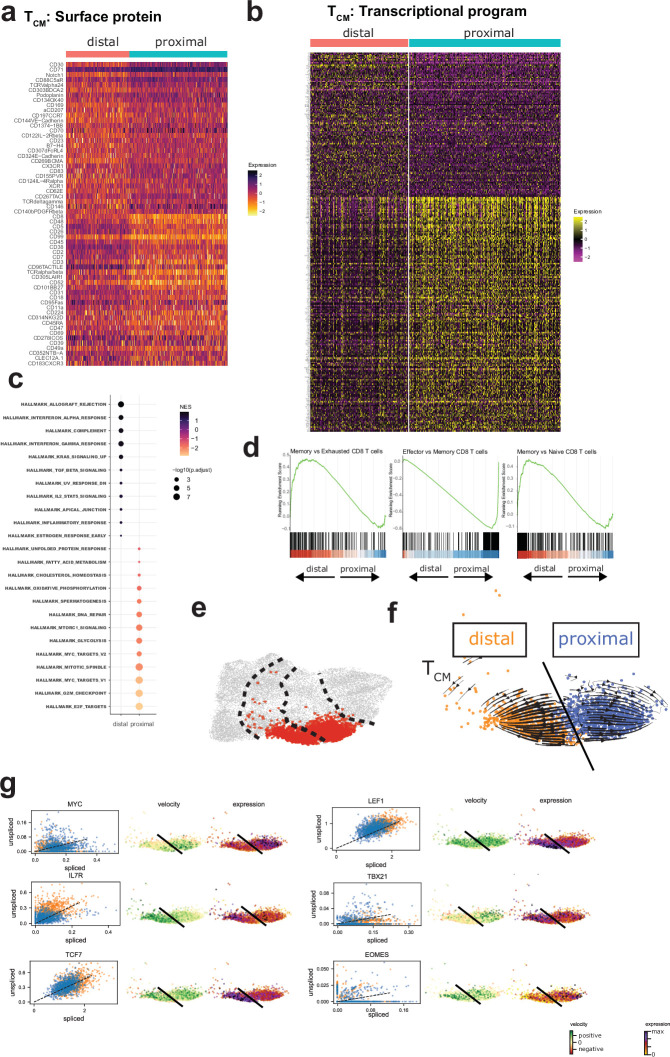
Consistent with the UMAP projection, proximal daughters and distal daughters demonstrate asymmetry in the global surface protein landscape, with proximal daughters inheriting surface protein expression patterns characteristic of activated-undivided cells (Fig. 4f), whereas distal daughters more closely resemble resting T cells (subset description in Extended Data Figs. 7–10). Overall, these data indicate that ACD affects the global surface proteome of activated CD8 CARTs, which may support the observed differential functional trajectories of proximal and distal CARTs following ACD.
Extended Data Fig. 7. TN-like proximal-daughter and distal-daughter CD8 CARTs exhibit asymmetry in surface proteomic and transcriptional landscapes that drive differentiation and metabolic programs.
a-b, Heat maps for first-division TN-like CARTs of (a) normalized surface protein levels of the top 30 proteins enriched in either distal-daughter (top half) or proximal-daughter (bottom half) TN-like CARTs and (b) normalized gene expression of top enriched genes in distal-daughter (top half) and in proximal-daughter (bottom half) TN-like CARTs demonstrate asymmetry in surface proteome and transcriptional abundance between first-division proximal-daughter and distal-daughter TN-like CARTs. c, Proximal-daughter and distal-daughter CD8 TN clusters (2, 9,15) characterized in Fig. 5c,d. d, Gene-set enrichment plots comparing transcriptional programs of proximal-daughter and distal-daughter TN-like CD8 CARTs, indicating enrichment of naïve-associated genes in distal-daughter TN-like CD8 CARTs (positive enrichment score values) and enrichment of genes associated with MYC, MTORC1 signaling, and glycolysis in proximal-daughter TN-like CD8 CARTs (negative enrichment score values). e, Hallmark transcriptional programs of proximal-daughter and distal-daughter TN-like CARTs. Statistical significance was determined using GSEA test with Benjamini–Hochberg correction for multiple comparisons. Plots are representative of 2 independent experiments with distinct donors: one with the anti-TCRδ CAR (shown in this figure) and one with the anti-CD19 CAR.
Extended Data Fig. 10. Surface proteomic and transcriptional asymmetry between first-division proximal-daughter and distal-daughter TRM-like CD8 CARTs.
a-b, Heat map of (a) normalized surface protein levels of the top 30 proteins enriched in either distal-daughters or proximal-daughters and (b) normalized gene expression of top enriched genes in either distal-daughters or proximal-daughters demonstrate asymmetry in surface proteome and transcriptional abundance between first-division proximal-daughter and distal-daughter TRM-like CARTs. c, Hallmark transcriptional programs of distal and proximal TRM-like CARTs support interferon alpha and gamma response in distal-daughters and increase metabolic activity (glycolysis, MTORC1 signaling) and proliferation (MYC targets, mitotic spindle, G2M checkpoint, E2F targets) in proximal-daughters. Statistical significance was determined using GSEA test with Benjamini–Hochberg correction for multiple comparisons. d, Gene-set enrichment plot between distal and proximal TRM-like CARTs demonstrate enrichment of lung effector memory cell-associated programs in distal-daughters and effector cell-associated programs in proximal-daughters. e, Proximal and distal TRM clusters (clusters TRM21 and TRM10) characterized in f-g. f, Velocity vector projection onto TRM UMAP clusters with streamline plots indicating divergent cell-state transitions between proximal-daughters and distal-daughters. Black line signifies border between distal (orange) and proximal (blue) cells. g, Gene-specific RNA velocity displayed as spliced/unspliced transcripts (left column) and projected onto TRM UMAP clusters (middle column), with normalized gene expression levels as a comparison (right column) demonstrating intrinsic upregulation of IL7R, LEF1, TCF7, and CXCR6 in distal-daughters compared to proximal-daughters. Plots are representative of 2 independent experiments with distinct donors: one with the anti-TCRδ CAR (shown in this figure) and one with the anti-CD19 CAR.
CART transcriptomes diverge during ACD
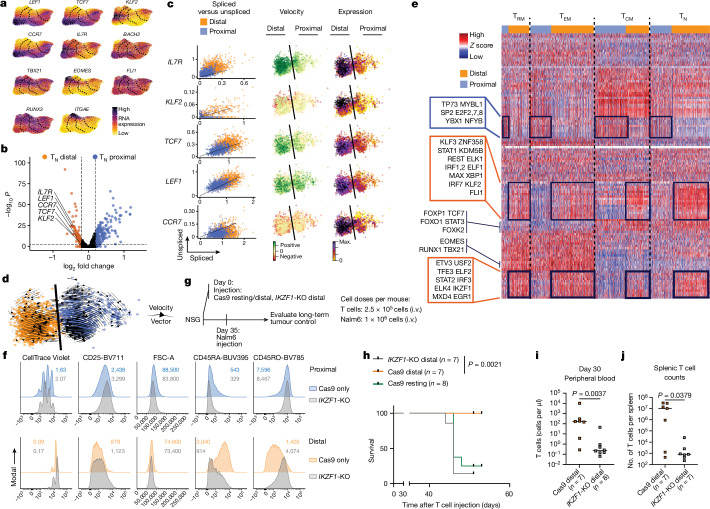
As transcriptional programs drive CART function, we next characterized the single-cell transcriptome of CD8 CARTs. We observed predominant expression of RUNX3 and FLI1 in effector cells with lower transcriptional activity in TN- and TCM-like cells (Fig. 5a and Extended Data Fig. 5d). When comparing within TN-like, TCM-like, TEM-like and TRM-like subsets, proximal and distal CARTs show global asymmetry in transcript abundances (Extended Data Figs. 7–10). Because previous studies have mainly characterized ACD in murine naive CD8 T cells, we initially focused on transcriptional differences between proximal and distal TN-like clusters (Extended Data Fig. 7c). Consistent with these studies12,29, TN-like distal daughters expressed higher levels of LEF1, TCF7, CCR7, IL7R and KLF2 compared to proximal daughters (Fig. 5b) and gene-set enrichment analysis indicates enrichment of naive signatures and repression of effector-associated genes in distal-daughter CARTs, indicating an asymmetric abundance of transcripts characteristic of naive and memory precursors in first-division TN-like daughter cells (Extended Data Fig. 7d). Consistent with previous reports on metabolic asymmetry among first-division daughter cells for factors downstream of MYC9,10,13, proximal daughters are enriched for MYC and MTORC1 target genes and show a glycolytic gene signature (Extended Data Fig. 7d,e).
Fig. 5. Proximal-daughter and distal-daughter CD8 CART fates are driven by divergent transcriptional programmes.
a, Normalized single-cell gene expression levels. b, Volcano plot illustrating differentially expressed genes in CD8 TN daughter CARTs. Dashed lines indicate cut-offs for log2 fold change and −log10P. c, Gene-specific RNA velocity shown as spliced or unspliced transcripts (left column) and projected onto TN-like UMAP clusters from Extended Data Fig. 7c (middle column) in comparison to normalized gene expression levels (right column). d, Velocity vector projection onto TN-like UMAP clusters. The black line signifies border between distal (orange) and proximal (blue) cells. e, Heat map of single-cell regulon activity of bulk CD8 CARTs; the top colour bar referencing proximal and distal cells separated by T cell subset assignment (from Extended Data Fig. 5). The blue box shows the shared transcription factor set with increased activity in proximal daughters; orange boxes show the shared transcription factor set with increased activity in distal daughters. f, Flow cytometry histogram plots of CD8 proximal-daughter (top) and distal-daughter (bottom) IKZF1-knockout (KO) and wild-type CARTs. Median fluorescence intensity or division index is shown in the histogram plots. g, NSG mice are injected with IKZF1-KO distal, wild-type distal and wild-type resting CARTs and subsequently challenged with Nalm6 cells 35 days later. h, Kaplan–Meier survival curve. Dashes represent censored data. i, Peripheral blood T cell count on 30 days after T cell injection. Lines represent the medians. j, Total splenic T cell count. Lines represent the medians. a–f Representative of two independent experiments using the anti-CD19 CARTs and anti-TCRδ CARTs from distinct donors. f, Representative of three independent experiments with summary plots in Extended Data Fig. 11d. h–j, Data pooled from two experiments with distinct donors (n = 7–8 mice per condition). Statistical significance was determined using a two-tailed Wilcoxon rank-sum test with Benjamini–Hochberg correction for multiple comparisons (b), log-rank test (h) and two-tailed Mann–Whitney test (i,j).
We addressed whether the transcriptional asymmetry was a result of uneven partitioning of pre-existing RNA or due to transcriptional up- or downregulation of fate-regulating genes after ACD. Using RNA velocity analysis30,31, we quantified the ratio of unspliced to spliced transcripts to detect short-term changes in gene expression state in first-division daughter CARTs (Fig. 5c). In addition to increased transcript abundance, we observed increased positive velocity of IL7R, KLF2, TCF7 and LEF1 expression in distal daughters compared to proximal daughters, indicating transcriptional upregulation of these genes following the first cell division. There was a notable absence of unspliced KLF2 transcripts in proximal daughters, indicating marked downregulation of transcriptional activity. Although the CCR7 transcript abundance was higher in distal daughters, CCR7 RNA velocity was similarly neutral or negative in both proximal daughters and distal daughters, suggesting that the difference in CCR7 transcripts is a result of uneven RNA distribution during the first cell division rather than asymmetric changes in transcription. These results underscore that both asymmetric partitioning of pre-existing RNA and changes in transcriptional activity are mechanisms driving transcript-level differences during ACD.
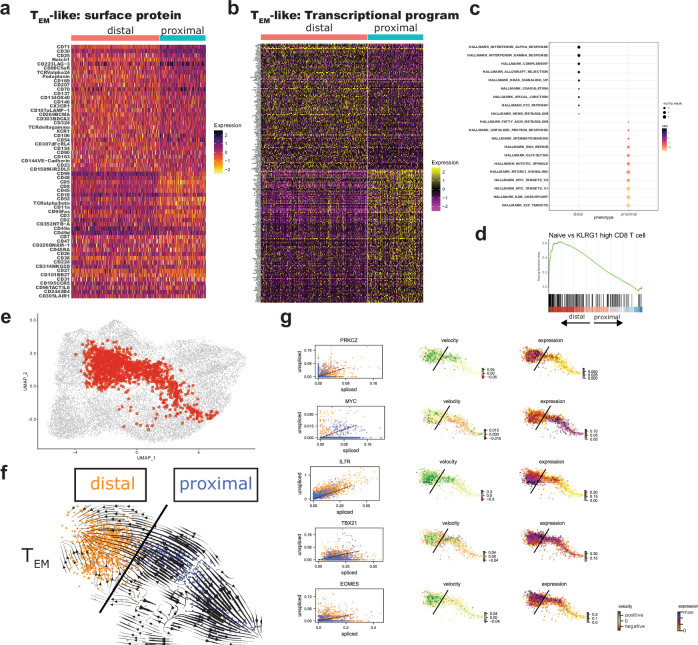
To visualize cell-state trajectories, we projected single-cell RNA velocity vectors onto the surface protein-based proximal and distal UMAP TN-like clusters, extrapolating similar states to other cells in local proximity (Fig. 5d). Although proximal daughters and distal daughters each demonstrate similar internal trajectories, the trajectory direction of proximal daughters compared to distal daughters is diametrically opposed, indicating that proximal and distal daughters activate distinct transcriptional programmes that support their divergent differentiation and cell-state trajectories. We observed similar opposed trajectories in TCM-, TEM- and TRM-like clusters (Extended Data Figs. 8–10). Thus, proximal- and distal-daughter cells show distinct transcriptional programmes and trajectories, driven by both asymmetric RNA partitioning and postdivision gene regulation.
Extended Data Fig. 8. TCM-like proximal-daughter and distal-daughter CD8 CARTs exhibit asymmetry in surface proteomic and transcriptional landscapes that drive effector or memory differentiation programs.
a-h, Surface proteomic and transcriptional profile asymmetry in first-division TCM-like daughter CARTs support memory maintenance in distal cells and proliferative and effector differentiation in proximal cells. (a) Heat map of normalized surface protein levels of the top 30 proteins enriched in either distal or proximal cells. (b) Heat map of normalized gene expression of top enriched genes in distal-daughters (180 genes) and proximal-daughters (240 genes). (c) Hallmark transcriptional programs of distal and proximal TCM-like CARTs support increased metabolic activity (fatty acid metabolism, oxidative phosphorylation, glycolysis, MTORC1 signaling) and proliferation (MYC targets, mitotic spindle, G2M checkpoint, E2F targets) in proximal-daughters compared to distal-daughters. Statistical significance was determined using GSEA test with Benjamini–Hochberg correction for multiple comparisons. (d) Gene-set enrichment plots comparing transcriptional programs between distal-daughter and proximal-daughter TCM-like CARTs demonstrating enrichment in memory-associated programs in distal cells and effector-associated programs in proximal cells. (e) Proximal and distal TCM clusters (clusters 11 and 5) characterized in f-g. (f) Velocity vector projection onto TCM UMAP clusters with streamline plots indicating divergent cell-state transitions between proximal and distal daughter cells. Black line signifies border between distal (orange) and proximal (blue) cells. (g) Gene-specific RNA velocity displayed as spliced/unspliced transcripts (left column) and projected onto TCM UMAP clusters (middle column), with normalized gene expression levels as a comparison (right column), demonstrate that both intrinsic transcriptional changes (MYC upregulation in proximal-daughters, IL7R upregulation in distal-daughters) and asymmetric assortment of pre-existing RNA (greater abundance of TCF7, LEF1 in distal-daughters with similar RNA velocities as proximal-daughters) are mechanisms for transcript abundance differences during ATCD. Plots are representative of 2 independent experiments with distinct donors: one with the anti-TCRδ CAR (shown in this figure) and one with the anti-CD19 CAR.
Transcription factor core sets in daughter CARTs after ACD
To explain regulatory networks driving the observed transcriptional changes after ACD, we used single-cell regulatory network inference and clustering (pySCENIC32) to compare the activities of transcription factor-associated gene networks, or regulons, across all (TN-, TCM-, TEM- and TRM-like) CD8 CART subsets and between proximal daughters and distal daughters (Fig. 5e). Regulon activity supported our previous subset assignment, as TN- and TCM-like cells demonstrated increased TCF7, FOXP1, STAT3 regulon activity, contrasting with TEM- and TRM-like cells, which demonstrated increased activity of EOMES, TBX21 and RUNX1 regulons.
When comparing regulon activities between all proximal daughters and distal daughters, we observed that proximal daughters upregulated regulons associated with apoptosis, proliferation and effector cell differentiation (Fig. 5e, blue box), including TP73, a member of the pro-apoptotic p53 superfamily and known to be highly expressed in short-lived plasmablasts33; proproliferative E2F family members 2, 7 and 8 (ref. 34); MYBL1, a repressor of naive and memory T cell function35 and YBX1, which is associated with early effector differentiation12.
By contrast, we identified within all distal-daughter cells increased regulon activity across a group of transcription factors that have previously been associated with an antiproliferative and self-renewing transcriptional program (Fig. 5e, orange boxes). This shared transcription factor profile of distal-daughter CARTs includes KLF2, a repressor of chemokine receptor expression36 and activator of CD62L and S1PR1 expression37; IRF1, whose loss results in increased proliferation and reduced protection in the context of viral infection38; and other transcription factors associated with interferon stimulation (IRF2, IRF3, IRF7, IRF9 and STAT2). The shared set also encompasses STAT1, which is important for quiescence39 and self-renewal40 of CD8 T cells and inhibits proliferation41; KDM5B, a histone deacetylase upregulated in TRM precursors early after viral infections42; REST, a transcriptional repressor upregulated in quiescent human T cells43 and after PD-1 blockade44; FLI1, which is critical for limiting effector T cell expansion45; MXD4, a negative regulator of MYC that promotes T cell survival and memory formation46,47 and IKZF1, a transcription factor that inhibits expression of IL2 and IL2RA (CD25) and restrains CD8 effector differentiation48,49.
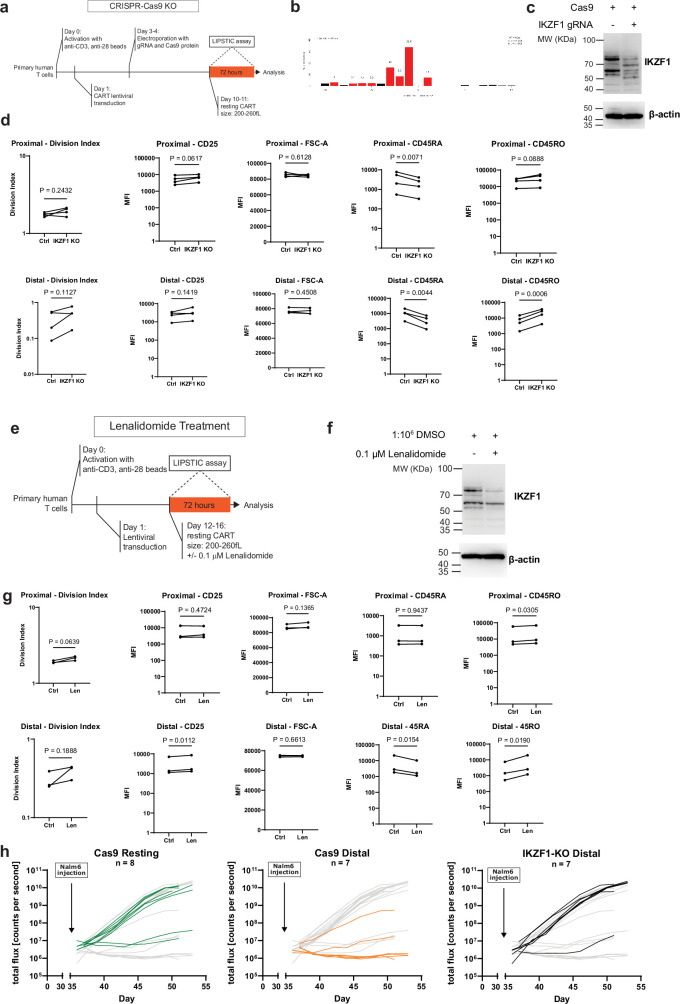
To test the functional relevance of the core transcription factor in ACD and its effect on the fate of distal-daughter CARTs, we used CRISPR–Cas9 technology to create a permanent knockout of IKZF1, which has not been implicated in the context of ACD and was chosen due to its role in restraining T cell proliferation, sensitivity to activation and effector differentiation49–52. The absence of IKZF1 resulted in distal-daughter cells that showed a phenotype similar to that of proximal daughters, marked by a loss of CD45RA, signifying a shift towards increased effector differentiation (Fig. 5f and Extended Data Fig. 11a–d). As a complementary approach, we transiently depleted IKZF1 using the therapeutic agent lenalidomide53, which was administered just before CART exposure to target cells (Extended Data Fig. 11e,f). Similar to the knockout, this transient depletion resulted in distal daughters losing CD45RA and gaining CD25 expression, further supporting the role of IKZF1 in contributing to the immunophenotype of distal daughters during ACD (Extended Data Fig. 11g). We then evaluated the importance of IKZF1 for the persistence and long-term function of distal-daughter CARTs in vivo. IKZF1-knockout distal daughters showed reduced T cell count in the circulation 30 days after injection in NSG mice, diminished control of Nalm6 tumour and lower T cell counts in the spleen (Fig. 5g–j and Extended Data Fig. 11h). These observations highlight that, independent of traditional naive, memory or effector T cell surface markers expressed at the time of cell isolation, proximal-daughter versus distal-daughter cell identity initiated by ACD induces distinct sets of transcriptional programs that can confer different functions and fates in T cell progeny, with IKZF1 serving as an essential transcription factor for distal-daughter cell cytotoxic function and persistence in vivo.
Extended Data Fig. 11. IKZF1 downregulation promotes effector-like differentiation of distal-daughter CARTs.
a, Experimental timeline of IKZF1-KO CART generation and subsequent LIPSTIC assay. b, Representative Tracking of Indels by Decomposition (TIDE) analysis of two independent experiments to calculate the rate of IKZF1 gene editing. c, Representative western blot of two independent experiments detecting IKZF1 and β-actin of Cas9 control and IKZF1-KO CARTs. d, Flow cytometry summary statistics comparing proximal- and distal-daughter progeny of Cas9 control and IKZF1-KO CARTs (n = 4 independent experiments with distinct donors). e, Bioluminescence imaging quantification of Nalm6 cells in NSG mice related to Fig. 5g–j by treatment group (n = 7–8 mice per treatment group pooled from 2 independent experiments). f, Experimental timeline of IKZF1 depletion with use of lenalidomide and subsequent LIPSTIC assay. g, Representative western blot of two independent experiments detecting IKZF1 and β-actin of CARTs treated with DMSO or 0.1 μM lenalidomide for 1 day. h, Flow cytometry summary statistics comparing proximal- and distal-daughter progeny of DMSO control and lenalidomide-treated CARTs (n = 3 independent experiments with distinct donors). Statistical significance was determined using two-tailed ratio paired t-test (d and h).
Discussion
Taken together, our work establishes that human CD8 CARTs use ACD to induce differential cell fates after target encounter and that first-division proximal- and distal-daughter cells constitute distinct cellular subtypes. Through target-induced proximity labelling of CAR molecules on proximal-daughter CARTs, we distinguish and isolate proximal-daughter and distal-daughter CARTs and perform unbiased single-cell profiling of their surface proteome and transcriptional program, combined with functional analyses of subsequent cell division asymmetry, cytotoxic potency and in vivo longevity. Beyond previous reports that identified asymmetric sorting of specific molecules in non-engineered human or murine T cells8–10,13,28,29,54–56, we find that the global surface proteome undergoes asymmetric sorting during the first cell division. CARTs demonstrate a unique pattern of protein asymmetry, with a notable enrichment of endogenous TCR complex proteins (TCRαβ, CD3 and CD8) on distal daughters, an unexpected finding that may have hindered previous discovery of ACD in human CARTs14. Our data mechanistically link differential fate trajectories to both cell-intrinsic transcriptional regulation after ACD and asymmetric partitioning of RNA during ACD. Specifically, upregulation of IL7R expression, whose gene product (CD127) is widely recognized as a marker of memory precursors12,57, occurs within hours of the first cell division in distal-daughter CARTs, as evidenced by increased RNA velocity. Conversely, CCR7 transcripts undergo asymmetric partitioning without detectable change in velocity. Unbiased transcriptome-wide trajectory analysis thus establishes a framework that contrasts with the traditional model of selecting cells based on a snapshot of cell surface marker or transcription factor expression, which at the time of detection may be up- or downregulating and could lead to progeny with heterogeneous fates.
Our work establishes that first-division daughter cells show unique transcriptional and functional attributes that set them apart from previously described CART subsets. Despite transcriptional heterogeneity of first-division daughter cells12, shared sets of transcription factors known to promote or restrain proliferation and differentiation in T cells are active in first-division daughter CARTs regardless of traditional naive, memory or effector surface markers expressed at the time of CART isolation. The contrasting core transcriptional programs of proximal-daughter and distal-daughter CARTs establish ACD as a means of divergent fate induction beyond previous published studies on naive murine T cells, and modulating members of these core transcriptional programs such as IKZF1 can alter the memory and effector balance of CART progeny. Furthermore, our data indicate that distal-daughter CARTs, in addition to demonstrating a memory-precursor transcriptome, aerobic metabolism and in vivo longevity, pass through a transient state of potent effector function that allows them to rapidly clear malignant cells. These unique features make distal-daughter CARTs and their transcriptional programs attractive for therapeutic applications.
ACD may not be the only mechanism of CART differentiation, but our findings may help to address past debate on whether memory T cells develop from effector or naive T cells. Whereas distal-daughter CARTs become destined to differentiate into long-lived memory cells by means of ACD, they also transiently show effector-like behaviour, and this cytotoxic plasticity in the days following ACD may reconcile observations of both naive8 and effector cells58 as possible memory precursors.
In conclusion, our studies identify ACD as a mechanism for the generation of human memory CARTs along with transcriptional, surface proteomic and metabolic profiles of memory and effector precursors. Given the importance of memory CARTs for clinical outcomes, our studies provide an actionable framework that may be broadly applicable for optimization of CART and other T cell immunotherapies.
Methods
Lentiviral constructs and production, in vitro transcription, cell lines and cell culture
All cells in this study were cultured in RPMI 1640 supplemented with 10% fetal bovine serum (FBS), 10 mM HEPES and 1% penicillin/streptomycin at 37 °C in fully humidified environment with 5% CO2 unless otherwise indicated. Cell lines were evaluated for mycoplasma contamination.
We used single chain variable fragment (scFv)-based CARs against human CD19 (clone FMC63) and the human TCR δ chain (clone 5A6.E9) with an appended N-terminal pentaglycine tag in a third generation lentiviral backbone (Extended Data Fig. 1). Both CAR constructs used scFvs in the light-chain-heavy-chain configuration followed by a CD8α hinge and transmembrane domain and CD137 and CD3ζ cytoplasmic domains. Furthermore, CARs were cloned with an IgG4 hinge instead of CD8α hinge domains (Extended Data Fig. 6c) with standard cloning methods.
To create a human CD19-sortase construct, we cloned human CD19 (C-terminal truncation) into a third generation lentiviral backbone that provided an IgH signal peptide followed by a flag-tag, low-affinity sortase mutant15 and a linker peptide. Similarly, we cloned a γδ TCR (clone PEER59) into this vector (both chains as a single transcript separated by a P2A site). Constructs were obtained as double-stranded DNA (dsDNA) fragments from IDT, digested and ligated into the lentiviral backbones using standard cloning techniques. We cloned extra TCR chains into lentiviral backbones (CD3γ-P2A-CD3δ and CD3ζ-P2A-CD3ε plasmids) to facilitate expression of the γδ TCR in non-T cell lines. Nucleotide and amino acid sequences of all constructs used in this study are listed in Supplementary Table 1. Lentivirus was produced as previously described using Lenti-X 293T cells60,61.
For in vitro messenger RNA (mRNA) transcription, CAR constructs were cloned into a pDrive.150 poly(A) backbone62 using standard cloning techniques and linear mRNA was transcribed using the T7 mScript Standard mRNA Production System (Cellscript). Linear dsDNA templates were generated by digesting with either ClaI or SpeI, and mRNA was synthesized following the manufacturer’s recommendations for a Cap 1-mRNA and roughly 150 base-long poly(A)-tail. mRNA was purified with an RNeasy Mini Kit (Qiagen), eluted in RNase-free water at 1 μg μl−1 and aliquoted and stored at −80 °C.
To disrupt the endogenous CD19 locus in Nalm6 cells (provided by M. Milone, originally obtained from DSMZ) and to create a cell line only expressing CD19-sortase or γδ TCR-sortase, two guide RNAs targeting the human CD19 locus were obtained (IDT, sequences in Supplementary Table 2) and 5 × 10⁶ Nalm6 cells were electroporated with a total of 50 pM ribonucleoprotein (consisting of Cas9 (IDT) and single-guide RNA (sgRNA)) in a total volume of 20 μl of Lonza P3 buffer (P3 primary cell 4D-Nucleofector X kit S) with a Lonza 4D-Nucleofector Core Unit (pulse protocol EO115) according to the manufacturer’s protocol. After CD19 disruption, Nalm6 cells were cultured at 0.2–1 × 10⁶ cells per ml in standard medium for 14 days before sorting CD19 negative cells by FACS (BD Biosciences AriaII). Initial disruption efficiency was greater than 90%, which increased to more than 99% after sorting. CD19 negative Nalm6 cells were transduced with target proteins (CD3γ, CD3δ, CD3ζ, CD3ε, γδ TCR-sortase or CD19-sortase) and positive cells were enriched by FACS.
All target cells in this study express green fluorescent protein (GFP)-click beetle green luciferase. Target cells were sorted on a regular basis to ensure persistence of the luciferase and surface antigen expression over several passages.
Bulk and CD8 CART production
Bulk or CD8 only primary human T cells from healthy donors were obtained from the University of Pennsylvania Human Immunology Core, stimulated with anti-CD3/anti-CD28 beads (Dynabeads, Thermo Fisher) for 24 h before transduction with lentiviral CAR constructs. Anti-CD3/anti-CD28 magnetic beads were removed on day 4 after transduction and the IL-2 concentration was gradually lowered from 100 to 25 IU ml−1 by day 8 after activation and 0 IU ml−1 by day 10 after activation. Cell medium replacement and quantification of cell size and number (Coulter Multisizer 4e) occurred every 2–3 days. CAR transduction efficiency was determined by flow using a polyclonal antimurine Fab antibody conjugated to biotin (Jackson ImmunoResearch) and streptavidin-PE. Non-transduced T cells from the same donor were stained under identical conditions and used as negative control.
To generate naive or effector CARTs, naive and effector T cells were isolated from bulk primary human T cells and were electroporated with mRNA encoding CARs. Naive T cells were isolated either with the Naive Pan T Cell Isolation Kit (Miltenyi Biotec, catalogue no. 130-097-095) or with a positive selection of CD62L and subsequent negative selection for CD45RA+ cells. For the latter approach, cells were stained with anti-CD62L-PE (BioLegend, DREG-56, catalogue no. 304840) and enriched with the anti-PE MultiSort kit (Miltenyi Biotec, catalogue no. 130-090-757) and LS column (Miltenyi Biotec, catalogue no. 130-042-401), with the flowthrough reserved for the isolation of effector T cells described below. CD62L+ cells were flushed out and separated from MultiSort MicroBeads using the MultiSort Release Reagent and centrifugation. CD45RA+CD62L+ cells were subsequently isolated by negative isolation using CD45RO MicroBeads (Miltenyi Biotec, catalogue no. 130-046-001) and two columns (Miltenyi LS). To isolate effector T cells of the same donor as the naive T cells, flowthrough from the first CD62L selection was added to the column (Miltenyi LD) for negative selection of CD62L− cells. More than 95% population purity (determined by flow cytometry) was used in the presented studies. Following isolation, naive and effector cells were electroporated with 10 μg mRNA/1 × 107 T cells encoding the CARs using Lonza 4D-Nucleofector Core Unit (pulse code EH115) according to the manufacturer’s protocol.
To disrupt the endogenous TCR, T cells were cotransduced with lentiviral CAR constructs and pCAT003, a lentivirus transfer plasmid encoding sgRNA targeting TRAC and gift from J. Doudna (Addgene plasmid no. 171628)63. Immediately following debeading, up to 4 × 10⁶ T cells were electroporated with 50 pM of Cas9 as described above with the modification of pulse code EO115. TCR− cells were negatively selected using CD3 MicroBeads (Miltenyi Biotec, catalogue no. 130-097-043) and LD column according to the manufacturer’s protocol.
To genetically disrupt IKZF1, 1 × 10⁶ T cells were electroporated immediately following debeading with 50 pM Cas9 and 100 nM guide RNA (IDT, Supplementary Table 2) as described above, with the modification of pulse code EH115. Genomic DNA was isolated using DNeasy Blood & Tissue Kit (Qiagen, catalogue no. 69504) according to the manufacturer’s protocol. The targeted IKZF1 locus was amplified using indicated primers (Supplementary Table 3). Quantification of genetic editing efficiencies were estimated using tracking of indels by decomposition64. Western blots were performed and stained using rabbit antiIkaros (IKZF1) monoclonal antibody (Cell Signaling, 9034S; dilution 1:1,000), digital antirabbit-HRP (Kindle Biosciences, LLC, R1006; dilution 1:1,000), mouse anti-β-actin monoclonal antibody (Cell Signaling, 3700S; dilution 1:3,000) and digital antimouse-HRP (Kindle Biosciences, LLC, R1005; dilution 1:3,000). Uncropped images of blots are provided in Supplementary Fig. 1. Pharmacologic depletion of IKZF1 was performed using 0.1 μM lenalidomide (MedChemExpress, catalogue no. HY-A0003).
LIPSTIC assay
Biotinylated LPETG peptide (biotin-aminohexanoic acid-LPETGS, C-terminal amide, 95% purity)15 was purchased from LifeTein (custom synthesis), reconstituted in PBS at 10 mM and stored at −80 °C.
To label target cells, Nalm6 cells (expressing sortase-tethered target molecules) were incubated with biotinylated LPETG peptide (100 μM, LifeTein) for 30 min at 37 °C in RPMI/10%FBS, followed by washing three times to remove excess soluble peptide. Sortase-bound LPETG was then labelled with fluorescent streptavidin (PE, AF647 or APC; 10 μg ml−1; BioLegend) for 30 min at 37 °C. Cells were then washed three times and resuspended at 1 × 10⁶ cells per ml.
All LIPSTIC assays were performed using fully rested T cells that had not demonstrated cell number increases in roughly 2 days. For the CARTs in the presented studies, the transduction efficiencies were between 20 and 85%, and the cell sizes of rested T cells were between 200 and 260 fl, which was achieved 12–15 days after activation. T cells were stained with CellTrace Violet following the manufacturer’s recommendations with the following modifications: T cells were stained at a concentration of 1 × 10⁷ cells per ml for 10 min at 37 °C. Target cells and CARTs were mixed in a six-well plate well in a total volume of 5.5–7 ml, and CART to target ratios ranged from 0.3:1 to 4.25:1. Cells were incubated for 72 h before cell sorting (BD Biosciences AriaII) and subsequent analysis of first-division daughter cells.
A second target encounter LIPSTIC assay was performed using sorted first-division LPETG+ or LPETG− cells. Target cells labelled with a second colour fluorescent streptavidin and CARTs were mixed in a 96-well plate in a total volume of 200 μl and a 1:1 CART:target ratio. Second-division daughter cells were sorted 24 h after coincubation.
Sorting gates were established for live single cells that were negative for GFP (excluding target cells), positive for Cell Trace Violet (CTV) and positive or negative for LPETG. LPETG positivity was determined relative to untransduced T cells, CARTs incubated without target cells or irrelevant CARTs incubated with target cells (threshold for LPETG positivity was generally the same for all controls).
Multiparametric flow cytometry analysis of T cells
Unless otherwise specified, antibodies were purchased from BioLegend.
In vitro and in vivo LIPSTIC assay populations were sorted and subsequently phenotyped by staining with 1:200 CD8-APCH7 (SK1, BD Biosciences, catalogue no. 561423), 5:400 CD4-BUV805 (SK3, BD Biosciences, catalogue no. 612887), 1:160 CD45RA-BUV395 (HI100, BD Biosciences, catalogue no. 740298), 5:400 CD45RO (UCHL1, catalogue no. 304234), 1:40 CD25-BV711 (M-A251, catalogue no. 356138) and/or 1:250 CD62L-PE (DREG-56, catalogue no. 304840).
For in vivo studies, samples were stained with CD8-APC/Cy5.5 (RFT8, SouthernBiotech, catalogue no. 9536-18), CD4-PE/Cy5.5 (RFT4, SouthernBiotech, catalogue no. 9522-16), CD3-BV605 (OKT3, catalogue no. 317322), CD19-APC (HIB19, catalogue no. 302212), CD45RA-BUV395 (HI100, catalogue no. 740298), CD45RO-BV785 (UCHL1, catalogue no. 304234), CD62L-PE (DREG-56, catalogue no. 304840), TCR-alpha/beta-BV421 (IP26, catalogue no. 306722) and CD45-PECy7 (QA17A19, catalogue no. 393408) at 1:100 dilution. Whole blood was stained in Trucount tubes (BD Biosciences) and fixed with FacsLyse solution (BD Biosciences) according to the manufacturer’s recommendations. Single-cell suspensions from spleen samples were produced by homogenization of the tissue through a 70 μm mesh followed by treatment with Red Blood Cell Lysis Buffer (BioLegend) according to the manufacturer’s recommendations and stained in PBS, 1% FBS and cell numbers were quantified with CountBright Plus Absolute Counting Beads (Thermo Fisher).
Samples were analysed on an LSRII, LSR Fortessa or FACSymphony A3 Cell Analyzer (BD Biosciences). The population of interest was gated based on forward- versus side-scatter characteristics followed by singlet gating. Data were analysed with FlowJo v.10 (Tree Star). Graphs and statistical analyses were generated using GraphPad Prism v.9.4.0.
Live-cell microscopy
For live-cell imaging to capture CARTs undergoing the first cell division, LPETG-positive CARTs before the first cell division were isolated using fluorescence activated cell sorting after 48 h of coincubation with target cells and then imaged in a humidified incubation chamber at 37 °C in 5% CO2 on a Zeiss Observer 7 equipped with a Zeiss Axiocam 702 monochrome CMOS camera, a Zeiss Axiocam 503 colour CCD camera and a Colibri 7 LED light source in Definite Focus mode in a 35 mm glass bottom dish (Ibidi) every 3 min.
To image the transfer of LPETG peptide from target to CART cells, CTV-labelled T cells were incubated with LPETG peptide-loaded target cells at an effector to target cell ratio of 1:5. The excess of target cells in this context increases the frequency of observing the interaction between CARTs and targets. Cells were placed in a 35 mm glass bottom dish (Ibidi) and analysed in a humidified incubation chamber at 37 °C in 5% CO2. Photographs were acquired in the GFP, CTV and AF647 channels in Definite Focus mode on a Zeiss Observer 7 every 45 s for 50 min. Images were acquired with ×40 objective using Zen (Blue edition) software (v.2.5, Zeiss). Videos were created with Fiji-ImageJ.
Metabolic analysis
T cell metabolic profiles were assessed using the Seahorse mitochondrial stress test (Agilent Technologies). Individual wells of an XF96 cell-culture microplate were coated with CellTak as per the manufacturer’s instructions. The matrix was adsorbed overnight at 37 °C, aspirated, air-dried and stored at 4 °C until use. Mitochondrial function was assessed on day 0 or day 1 after sorting proximal or distal or undivided cells. T cells were resuspended in non-buffered RPMI 1640 medium containing 5.5 mM glucose, 2 mM l-glutamine and 1 mM sodium pyruvate and seeded at 1.5 × 10⁵ cells per well. The microplate was centrifuged at 1,000g for 5 min and incubated in standard culture conditions for 60 min. During instrument calibration (30 min), the cells were switched to a CO2-free 37 °C incubator. XF96 assay cartridges were calibrated according to the manufacturer’s instructions. Cellular OCRs and ECARs were measured under basal conditions and following treatment with 1.5 μM oligomycin, 1.5 μM FCCP and 40 nM rotenone, with 1 μM antimycin A (XF Cell Mito Stress kit, Agilent). OCR/ECAR ratios are calculated using the mean OCR and ECAR of 3–5 replicates for each population.
In vivo studies
Immunodeficient NSG (NOD.Cg-Prkdcscid Il2rgtm1Wjl/SzJ) mice were bred in house under an approved Institutional Animal Care and Use Committee (IACUC) protocol and maintained under pathogen-free conditions. To facilitate engraftment of T cells, bulk (CD4+ and CD8+) T cells were used in in vivo studies19. Sample sizes were not predetermined based on statistical methods but were chosen based on preliminary data and previously published results. For all in vivo experiments, treatment groups were randomly selected by the cage number. In vivo injections were performed in a blinded fashion by a member of the Ellebrecht or Payne laboratories or a staff member of the Human Stem Cell and Xenograft Core of the University of Pennsylvania.
For in vivo LIPSTIC, LPETG-labelled target cells were injected intraperitoneally immediately followed by CTV-labelled CARTs. A 1:1 target:CART ratio was maintained, with a total of 1 × 10⁷ total T cells injected. Mice were euthanized 2 days following injection. Cells were collected using peritoneal wash three times using 5 ml of ice-cold 2% FBS and PBS. First-division daughter cells were sorted and assessed by flow cytometry as described above.
For functional longevity studies, 2.5 × 10⁵ anti-CD19 CAR proximal- or distal-daughter cells, non-activated resting anti-CD19 CARTs or non-transduced T cells were intravenously injected into NSG mice on day 0. After 35 days, mice were challenged with 1 × 10⁶ Nalm6 cells. Leukaemia burden was determined by bioluminescence imaging. Bioluminescence was quantified with an IVIS Lumina III (PerkinElmer) 2–3 times per week after Nalm6 injection as previously described3.
In the stress-test model, NSG mice were injected with 1 × 10⁶ Nalm6 cells on day 0. Engraftment of Nalm6 was confirmed on day 3 by bioluminescence imaging. On day 4, mice were treated with 2.5 × 10⁵ proximal or distal-daughter anti-CD19 CARTs; 2.5 × 10⁶ non-activated resting anti-CD19 CARTs or non-transduced T cells; or 1.3 × 10⁶ bulk restimulated anti-CD19 CARTs (unsorted) by intravenous injection. Leukaemia burden was determined with bioluminescence imaging as above. Mice were euthanized when they had reached a total bioluminescence flux of at least 1 × 10¹¹ photons per second, demonstrating loss of leukaemia control.
Peripheral blood was obtained by retro-orbital bleeding. Mice were euthanized for organ harvest according to local IACUC guidelines, and spleen and blood samples were assessed by flow cytometry as described above. In accordance with the approved IACUC protocol for these studies, humane endpoints for euthanizing mice were established and not exceeded in this study. Mice were monitored at least twice weekly for symptoms. If severe lethargy or weakness, hunching, emaciated body condition (body condition score of 1 out of 5) or loss of 20% or more body weight, were observed, mice were euthanized. If a body condition score of 2 out of 5 was observed and accompanied by lethargy, mice were euthanized. Furthermore, mice were euthanized when their total bioluminescence flux exceeded 1 × 10¹¹. All studies involving animals were performed under a protocol approved by the University of Pennsylvania IACUC.
Luciferase-based in vitro cytotoxicity assay
Cytotoxicity assays were performed either on day 1 or 4 after first cell division as previously described3. Click beetle green luciferase-expressing target Nalm6 cells were cocultured with proximal, distal or resting CARTs or donor-matched non-transduced T cells at indicated E:T ratios. To test TCR-mediated cytotoxicity of mRNA-electroporated naive and effector CARTs, K562 cells positive for CD64 (FcγRI) were incubated with 100 μg ml−1 anti-human CD3 (OKT3, Invitrogen, catalogue no. 16-0037-85) for 30 min on ice and washed twice were used as target cells.
Single-cell multiomic analysis
First-division proximal, first-division distal, activated-undivided and resting CD8 CARTs (1.5 × 10⁵ cells each), sorted as described above from the LIPSTIC assay, were separately incubated in flow cytometry staining buffer (BioLegend) with a custom TotalSeq-C antibody cocktail (Supplementary Table 4, BioLegend 900000114, lot B311489) in 100 μl for 30 min at 4 °C before washing three times. Cell concentration was adjusted to 1.5 × 10⁶ live cells per ml. 10,000 live CD8 T cells from each LIPSTIC population were loaded onto NextGem K chips (10X Genomics) and processed in a 10X Chromium device according to the manufacturer’s recommendations. A biological replicate was performed with CART from a separate donor. Library preparation was performed according to the 10 × 5′ V2 protocol for antibody-derived tags (ADT), gene expression (GEX) and paired alpha and beta TCR chains. Complementary DNA and subsequent library intermediates were checked for correct size, appropriate quantity and quality with a DNA high-sensitivity kit on a Bioanalyzer 2100 (Agilent). Libraries were sequenced in paired-end dual-index mode for 150 × 2 cycles on a NovaSeq 6000 sequencer (Illumina, one lane of a S4 cartridge). All cells in each experiment were sorted and stained on the same day and libraries were processed in parallel and sequenced in the same lane to minimize batch effects. Counts for demultiplexed GEX, ADT and TCR libraries were obtained with the STAR method of the Cell Ranger multi pipeline (10X Genomics, Cell Ranger v.6.1.2) using the human GENCODE v.32/Ensembl 98 GRCh38 reference (detailed version by 10X Genomics: Human (GRCh38) 2020-A, Human (GRCh38) v.5.0.0), which then were aggregated with the Cell Ranger aggr pipeline with read depth normalization to further reduce batch effects across libraries. Downstream analysis was performed with the Seurat V4 R package22. To remove doublets and low cells, cells with more than 25% mitochondrial gene transcripts, less than 7.5% ribosomal gene transcripts, transcript counts less than 500 or greater than 40,000, or a minimum number of detected genes of less than 500 were excluded. Counts were single-cell transformed using the sctransform V2 and glmGamPoi packages65. Dimensionality reduction was performed based on ADT counts with subsequent analysis of genes and surface proteins of interest and differentially expressed genes or surface proteins for TN-, TCM-, TEM- and TRM-like subsets. RNA velocity analysis was performed by counting spliced and unspliced transcripts in Cell Ranger binary alignment map output files with the velocyto package31 using the same transcriptome reference gene transfer format file (refdata-gex-GRCh38-2020-A) that was used for the initial Cell Ranger run. Output loom files were then used in scvelo after export of TN, TCM, TEM and TRM expression matrices containing proximal and distal first-division daughter cells from Seurat and conversion to SCANPY/ANNDATA objects66. Global velocity vectors and velocities of genes of interest were computed and visualized in stochastic or dynamic mode with scvelo30. Regulon analysis (gene modules co-expressed with transcription factors and with correct cis-regulatory upstream motif for a respective transcription factor) was performed using a list of 1,390 human transcription factors (https://github.com/aertslab/pySCENIC/blob/master/resources/hs_hgnc_curated_tfs.txt) with the Python version of SCENIC (that is, pySCENIC v.0.11.2)32,67 after importing expression matrices from Seurat to SCANPY (v.1.7.2). Gene-set enrichment analysis68,69 was performed on each T cell subsets with the GSEA function of clusterProfiler70 in R. T cell clonal analysis was performed with scRepertoire71 in R using the ‘strict’ setting, which requires identical V, D (if applicable), J and C genes in addition to identical CDR3 nucleotide sequence of both TCR chains to identify T cells belonging to the same clonotype.
Seurat analysis was performed in R v.4.3.1, velocity analysis was performed in Python v.3.10.4 and regulon analysis was performed in Python v.3.7.12 in accordance with the respective pipeline requirements.
Statistical analysis
Statistical significance was determined with two-sided tests unless otherwise indicated. Where appropriate and as indicated, P values were adjusted for multiple testing (Benjamini–Hochberg). Q values were calculated with clusterprofiler in R. Whenever individual data points are presented, a horizontal line represents the mean value of the group. Survival in in vivo experiments was defined as time until the predetermined bioluminescence threshold was reached. Kaplan–Meier statistical analysis was used to compare survival between groups. Unless otherwise indicated, asterisks depict the following significance values: *P < 0.05, **P < 0.01, ***P < 0.001. P values less than 0.05 were considered statistically significant. The mean fluorescence intensity in flow cytometry plots is labelled with a cross in each gate. Statistical analysis was performed with the respective pipelines as mentioned above or with GraphPad Prism v.9.4.0.
Reporting summary
Further information on research design is available in the Nature Portfolio Reporting Summary linked to this article.
Online content
Any methods, additional references, Nature Portfolio reporting summaries, source data, extended data, supplementary information, acknowledgements, peer review information; details of author contributions and competing interests; and statements of data and code availability are available at 10.1038/s41586-024-07862-7.
Supplementary information
Uncropped immunoblots from Extended Data Fig. 11.
Nucleotide and amino acid sequences of CD19-sortase, gdTCR-sortase, anti-gdTCR CAR, anti-CD19 CAR, CD3d-P2A-CD3g, CD3z-P2A-CD3e and IgG4 hinge.
Guide RNA sequences for CRISPR knockout of human CD19 and human IKZF1.
Primer sequences for PCR amplification of IKZF1 locus for subsequent tracking of indels by decomposition analysis.
Custom TotalSeq-C antibody cocktail containing 198 antibodies detecting human surface proteins and seven isotype controls.
Live-cell imaging of CD19-targeting CD8 CART cells (blue, CellTrace Violet) interacting with Nalm6 cells (green, GFP) expressing CD19-sortase loaded with LPETG peptide (AF647, white), demonstrating enrichment of LPETG signal at the immune synapse between target and CART cells. Target cells were used in fivefold excess. Images were obtained every 45 s.
Live-cell imaging indicates LPETG (AF647, red) peptide is retained on one daughter CART cell during mitosis, while the other daughter cell remains label-free. Arrow indicates mitosis of interest. Images were obtained every 3 min.
Source data
Acknowledgements
We thank W. Wilson for bioinformatics discussion, A. Stout from the Cell and Developmental Biology Microscopy Core for assistance with imaging experiments, and the Penn Stem Cell and Xenograft Core. Flow cytometry and sorting were performed in the Penn Cytomics and Cell Sorting Shared Resource Laboratory at the University of Pennsylvania, supported by the Abramson Cancer Center NCI grant (no. P30 016520, the research identifier number is RRid:SCR_022376). We thank E. Cento, Z. Chen, M. A. Eldabbas and E. Maddox of the Human Immunology Core (HIC) and the Division of Transfusion Medicine and Therapeutic Pathology at the Perelman School of Medicine at the University of Pennsylvania for providing de-identified, bulk T cells and CD8+ T cells that were purified from healthy donor apheresis using StemCell RosetteSep kits. The HIC is supported in part by grant nos. NIH P30 AI045008 and P30 CA016520. HIC RRID: SCR_022380. Research reported in this publication was supported by the National Institute of Arthritis and Musculoskeletal and Skin Diseases and National Cancer Institute of the National Institutes of Health through grant awards to C.T.E. (grant no. K08-AR0802666, Dermatology Foundation Career Development Award), C.S.L. (grant no. T32-AR007465), S.O. (National Research Foundation of Korea, funded by the Ministry of Education, grant no. 2019R1A6A3A03033057), R.O.C. (grant no. R01-CA226983, Ludwig Princeton Branch) and A.S.P. (grant no. R01-AR068288, Penn Center for Precision Medicine). The content is solely the responsibility of the authors and does not necessarily represent the official views of the National Institutes of Health.
Extended data figures and tables
Extended Data Fig. 9. Surface proteomic and transcriptional asymmetry between proximal-daughter and distal-daughter TEM-like CD8 CARTs.
a-b, Heat maps of (a) normalized surface protein levels of the top 30 proteins enriched in either distal-daughters or proximal-daughters and (b) normalized gene expression of top enriched genes in distal-daughters and in proximal-daughters demonstrate asymmetry in surface proteome and transcriptional abundance between first-division proximal-daughter and distal-daughter TEM-like CARTs. c, Hallmark transcriptional programs of distal and proximal TEM-like CARTs support interferon alpha and gamma response in distal-daughters and increase metabolic activity (glycolysis, MTORC1 signaling) and proliferation (MYC targets, mitotic spindle, G2M checkpoint, E2F targets) in proximal-daughters. Statistical significance was determined using GSEA test with Benjamini–Hochberg correction for multiple comparisons. d, Gene-set enrichment plot between distal-daughter and proximal-daughter TEM-like CARTs demonstrate enrichment of naïve-associated programs rather than KLRG1hi effector cell-associated programs in distal-daughters. e, Proximal and distal TEM clusters (clusters 10 and 1) characterized in f-g. f, Velocity vector projection onto TEM UMAP clusters with streamline plots indicating divergent cell-state transitions between distal-daughters and a portion of proximal-daughters. A subset of proximal-daughters exhibit velocity vectors with the same directionality as that of distal-daughters, which may reflect heterogeneity in TEM-like proximal-daughters, with a fraction of proximal-daughters exhibiting a trajectory toward a memory-like rather than effector-like cell state. Black line signifies border between distal (orange) and proximal (blue) cells. g, Gene-specific RNA velocity displayed as spliced/unspliced transcripts (left column) and projected onto TEM UMAP clusters (middle column), with normalized gene expression levels as a comparison (right column) demonstrating that, consistent with prior reports, PRKCZ transcripts are enriched in distal-daughters and MYC transcripts are enriched in proximal-daughters. Consistent with the velocity vector projection in f and similar to distal-daughters, a portion of proximal-daughters upregulate and exhibit higher transcript abundance of PRKCZ and IL7R transcription. Similar to TN and TCM cells, MYC, IL7R, and TBX21 demonstrate velocity changes in first division daughter cells indicative of asymmetric intrinsic transcriptional changes of these genes. Plots are representative of 2 independent experiments with distinct donors: one with the anti-TCRδ CAR (shown in this figure) and one with the anti-CD19 CAR.
Author contributions
A.R.K. assisted with experiments and manuscript review. A.S.P. was involved with experimental design, supervision of experimental execution and data analysis, and manuscript writing. C.T.B. performed bioinformatics analysis and reviewed the manuscript. C.T.E. was involved with experimental design and execution, experimental data and bioinformatics analysis, manuscript writing, supervision of experimental execution and data analysis. C.S.L. was involved with experimental design and execution, experimental data analysis and manuscript writing. P.J.H. assisted with experiments and manuscript review. R.O.C. was involved with experimental design, supervision of experimental execution and data analysis, and manuscript review. S.C. was involved with experimental design and execution, experimental data analysis and manuscript review. S.O. assisted with experiments and manuscript review.
Peer review
Peer review information
Nature thanks Stephen Gottschalk and the other, anonymous, reviewer(s) for their contribution to the peer review of this work.
Data availability
Single-cell sequencing data have been deposited in the NCBI Gene Expression Omnibus and are accessible through the accession number GSE268878. Source data are provided with this paper.
Code availability
Scripts for single-cell sequencing analysis are available at Zenodo (10.5281/zenodo.11672288)72.
Competing interests
C.T.E.—equity (Cabaletta Bio), patent licensing (Cabaletta Bio, Novartis). A.S.P.—equity, payments, research grants (Cabaletta Bio), patent licensing (Cabaletta Bio, Novartis), consultant (Janssen). S.O.—patent licensing (Cabaletta Bio). R.O.C.—equity (Nucleus Biologics), research grant (NeoTx) and patent licensing (Novartis). The remaining authors declare no competing interests.
Footnotes
Publisher’s note Springer Nature remains neutral with regard to jurisdictional claims in published maps and institutional affiliations.
These authors contributed equally: Casey S. Lee, Sisi Chen
Contributor Information
Aimee S. Payne, Email: asp2261@cumc.columbia.edu
Christoph T. Ellebrecht, Email: chell@pennmedicine.upenn.edu
Extended data
is available for this paper at 10.1038/s41586-024-07862-7.
Supplementary information
The online version contains supplementary material available at 10.1038/s41586-024-07862-7.
References
- 1.Park, J. H. et al. Long-term follow-up of CD19 CAR therapy in acute lymphoblastic leukemia. N. Engl. J. Med.378, 449–459 (2018). [DOI] [PMC free article] [PubMed] [Google Scholar]
- 2.Maude, S. L. et al. Chimeric antigen receptor T cells for sustained remissions in leukemia. N. Engl. J. Med.371, 1507–1517 (2014). [DOI] [PMC free article] [PubMed] [Google Scholar]
- 3.Melenhorst, J. J. et al. Decade-long leukaemia remissions with persistence of CD4+ CAR T cells. Nature602, 503–509 (2022). [DOI] [PMC free article] [PubMed] [Google Scholar]
- 4.Porter, D. L. et al. Chimeric antigen receptor T cells persist and induce sustained remissions in relapsed refractory chronic lymphocytic leukemia. Sci. Transl. Med.7, 303ra139–303ra139 (2015). [DOI] [PMC free article] [PubMed] [Google Scholar]
- 5.Brentjens, R. J. et al. CD19-targeted T cells rapidly induce molecular remissions in adults with chemotherapy-refractory acute lymphoblastic leukemia. Sci. Transl. Med.5, 177ra138–177ra138 (2013). [DOI] [PMC free article] [PubMed] [Google Scholar]
- 6.Hay, K. A. et al. Factors associated with durable EFS in adult B-cell ALL patients achieving MRD-negative CR after CD19 CAR T-cell therapy. Blood133, 1652–1663 (2019). [DOI] [PMC free article] [PubMed] [Google Scholar]
- 7.Fraietta, J. A. et al. Determinants of response and resistance to CD19 chimeric antigen receptor (CAR) T cell therapy of chronic lymphocytic leukemia. Nat. Med.24, 563–571 (2018). [DOI] [PMC free article] [PubMed] [Google Scholar]
- 8.Chang, J. T. et al. Asymmetric T lymphocyte division in the initiation of adaptive immune responses. Science315, 1687–1691 (2007). [DOI] [PubMed] [Google Scholar]
- 9.Verbist, K. C. et al. Metabolic maintenance of cell asymmetry following division in activated T lymphocytes. Nature532, 389–393 (2016). [DOI] [PMC free article] [PubMed] [Google Scholar]
- 10.Pollizzi, K. N. et al. Asymmetric inheritance of mTORC1 kinase activity during division dictates CD8(+) T cell differentiation. Nat. Immunol.17, 704–711 (2016). [DOI] [PMC free article] [PubMed] [Google Scholar]
- 11.Ciocca, M. L., Barnett, B. E., Burkhardt, J. K., Chang, J. T. & Reiner, S. L. Cutting edge: asymmetric memory T cell division in response to rechallenge. J. Immunol.188, 4145–4148 (2012). [DOI] [PMC free article] [PubMed] [Google Scholar]
- 12.Kakaradov, B. et al. Early transcriptional and epigenetic regulation of CD8(+) T cell differentiation revealed by single-cell RNA sequencing. Nat. Immunol.18, 422–432 (2017). [DOI] [PMC free article] [PubMed] [Google Scholar]
- 13.Guo, A. et al. cBAF complex components and MYC cooperate early in CD8+ T cell fate. Nature10.1038/s41586-022-04849-0 (2022). [DOI] [PMC free article] [PubMed] [Google Scholar]
- 14.Dotti, G., Gottschalk, S., Savoldo, B. & Brenner, M. K. Design and development of therapies using chimeric antigen receptor-expressing T cells. Immunol. Rev.257, 107–126 (2014). [DOI] [PMC free article] [PubMed] [Google Scholar]
- 15.Pasqual, G. et al. Monitoring T cell-dendritic cell interactions in vivo by intercellular enzymatic labelling. Nature553, 496–500 (2018). [DOI] [PMC free article] [PubMed] [Google Scholar]
- 16.Ghassemi, S. et al. Reducing ex vivo culture improves the antileukemic activity of chimeric antigen receptor (CAR) T cells. Cancer Immunol. Res.6, 1100–1109 (2018). [DOI] [PMC free article] [PubMed] [Google Scholar]
- 17.Rafiq, S., Hackett, C. S. & Brentjens, R. J. Engineering strategies to overcome the current roadblocks in CAR T cell therapy. Nat. Rev. Clin. Oncol.17, 147–167 (2020). [DOI] [PMC free article] [PubMed] [Google Scholar]
- 18.Sheih, A. et al. Clonal kinetics and single-cell transcriptional profiling of CAR-T cells in patients undergoing CD19 CAR-T immunotherapy. Nat. Commun.11, 219 (2020). [DOI] [PMC free article] [PubMed] [Google Scholar]
- 19.Sommermeyer, D. et al. Chimeric antigen receptor-modified T cells derived from defined CD8+ and CD4+ subsets confer superior antitumor reactivity in vivo. Leukemia30, 492–500 (2016). [DOI] [PMC free article] [PubMed] [Google Scholar]
- 20.Zhao, Z. et al. Structural design of engineered costimulation determines tumor rejection kinetics and persistence of CAR T cells. Cancer Cell28, 415–428 (2015). [DOI] [PMC free article] [PubMed] [Google Scholar]
- 21.Brentjens, R. J. et al. Eradication of systemic B-cell tumors by genetically targeted human T lymphocytes co-stimulated by CD80 and interleukin-15. Nat. Med.9, 279–286 (2003). [DOI] [PubMed] [Google Scholar]
- 22.Hao, Y. et al. Integrated analysis of multimodal single-cell data. Cell184, 3573–3587.e3529 (2021). [DOI] [PMC free article] [PubMed] [Google Scholar]
- 23.Stuart, T. et al. Comprehensive integration of single-cell data. Cell177, 1888–1902.e1821 (2019). [DOI] [PMC free article] [PubMed] [Google Scholar]
- 24.Wensveen, F. M. et al. Apoptosis threshold set by Noxa and Mcl-1 after T cell activation regulates competitive selection of high-affinity clones. Immunity32, 754–765 (2010). [DOI] [PubMed] [Google Scholar]
- 25.Qi, Q. et al. Diversity and clonal selection in the human T-cell repertoire. Proc. Natl Acad. Sci. USA111, 13139–13144 (2014). [DOI] [PMC free article] [PubMed] [Google Scholar]
- 26.Shifrut, E. et al. Genome-wide CRISPR screens in primary human T cells reveal key regulators of immune function. Cell175, 1958–1971.e1915 (2018). [DOI] [PMC free article] [PubMed] [Google Scholar]
- 27.Hamieh, M. et al. CAR T cell trogocytosis and cooperative killing regulate tumour antigen escape. Nature568, 112–116 (2019). [DOI] [PMC free article] [PubMed] [Google Scholar]
- 28.Borsa, M. et al. Modulation of asymmetric cell division as a mechanism to boost CD8(+) T cell memory. Sci. Immunol.4, eaav1730 (2019). [DOI] [PubMed] [Google Scholar]
- 29.Arsenio, J. et al. Early specification of CD8+ T lymphocyte fates during adaptive immunity revealed by single-cell gene-expression analyses. Nat. Immunol.15, 365–372 (2014). [DOI] [PMC free article] [PubMed] [Google Scholar]
- 30.Bergen, V., Lange, M., Peidli, S., Wolf, F. A. & Theis, F. J. Generalizing RNA velocity to transient cell states through dynamical modeling. Nat. Biotechnol.38, 1408–1414 (2020). [DOI] [PubMed] [Google Scholar]
- 31.La Manno, G. et al. RNA velocity of single cells. Nature560, 494–498 (2018). [DOI] [PMC free article] [PubMed] [Google Scholar]
- 32.Van de Sande, B. et al. A scalable SCENIC workflow for single-cell gene regulatory network analysis. Nat. Protoc.15, 2247–2276 (2020). [DOI] [PubMed] [Google Scholar]
- 33.Monaco, G. et al. RNA-seq signatures normalized by mRNA abundance allow absolute deconvolution of human immune cell types. Cell Rep.26, 1627–1640.e1627 (2019). [DOI] [PMC free article] [PubMed] [Google Scholar]
- 34.Attwooll, C., Lazzerini Denchi, E. & Helin, K. The E2F family: specific functions and overlapping interests. EMBO J.23, 4709–4716 (2004). [DOI] [PMC free article] [PubMed] [Google Scholar]
- 35.Best, J. A. et al. Transcriptional insights into the CD8+ T cell response to infection and memory T cell formation. Nat. Immunol.14, 404–412 (2013). [DOI] [PMC free article] [PubMed] [Google Scholar]
- 36.Sebzda, E., Zou, Z., Lee, J. S., Wang, T. & Kahn, M. L. Transcription factor KLF2 regulates the migration of naive T cells by restricting chemokine receptor expression patterns. Nat. Immunol.9, 292–300 (2008). [DOI] [PubMed] [Google Scholar]
- 37.Carlson, C. M. et al. Kruppel-like factor 2 regulates thymocyte and T-cell migration. Nature442, 299–302 (2006). [DOI] [PubMed] [Google Scholar]
- 38.Brien, J. D. et al. Interferon regulatory factor-1 (IRF-1) shapes both innate and CD8+ T cell immune responses against West Nile virus infection. PLoS Pathog.7, e1002230 (2011). [DOI] [PMC free article] [PubMed] [Google Scholar]
- 39.Kye, Y.-C. et al. STAT1 maintains naïve CD8+ T cell quiescence by suppressing the type I IFN-STAT4-mTORC1 signaling axis. Sci. Adv.7, eabg8764 (2021). [DOI] [PMC free article] [PubMed] [Google Scholar]
- 40.Huang, Z. et al. IL-27 promotes the expansion of self-renewing CD8+ T cells in persistent viral infection. J. Exp. Med.216, 1791–1808 (2019). [DOI] [PMC free article] [PubMed] [Google Scholar]
- 41.Gil, M. P., Salomon, R., Louten, J. & Biron, C. A. Modulation of STAT1 protein levels: a mechanism shaping CD8 T-cell responses in vivo. Blood107, 987–993 (2006). [DOI] [PMC free article] [PubMed] [Google Scholar]
- 42.Kurd, N. S. et al. Early precursors and molecular determinants of tissue-resident memory CD8(+) T lymphocytes revealed by single-cell RNA sequencing. Sci. Immunol.5, eaaz6894 (2020). [DOI] [PMC free article] [PubMed] [Google Scholar]
- 43.Zhang, W. et al. Genomic expression analysis by single-cell mRNA differential display of quiescent CD8 T cells from tumour-infiltrating lymphocytes obtained from in vivo liver tumours. Immunology127, 83–90 (2009). [DOI] [PMC free article] [PubMed] [Google Scholar]
- 44.Pauken, K. E. et al. Epigenetic stability of exhausted T cells limits durability of reinvigoration by PD-1 blockade. Science354, 1160–1165 (2016). [DOI] [PMC free article] [PubMed] [Google Scholar]
- 45.Chen, Z. et al. In vivo CD8(+) T cell CRISPR screening reveals control by Fli1 in infection and cancer. Cell184, 1262–1280.e1222 (2021). [DOI] [PMC free article] [PubMed] [Google Scholar]
- 46.Vasilevsky, N. A., Ruby, C. E., Hurlin, P. J. & Weinberg, A. D. OX40 engagement stabilizes Mxd4 and Mnt protein levels in antigen-stimulated T cells leading to an increase in cell survival. Eur. J. Immunol.41, 1024–1034 (2011). [DOI] [PMC free article] [PubMed] [Google Scholar]
- 47.Heckler, M. et al. Inhibition of CDK4/6 promotes CD8 T-cell memory formation. Cancer Discov.11, 2564–2581 (2021). [DOI] [PMC free article] [PubMed] [Google Scholar]
- 48.Clambey, E. T. et al. The Ikaros transcription factor regulates responsiveness to IL-12 and expression of IL-2 receptor alpha in mature, activated CD8 T cells. PLoS ONE8, e57435 (2013). [DOI] [PMC free article] [PubMed] [Google Scholar]
- 49.O’Brien, S. et al. Ikaros imposes a barrier to CD8+ T cell differentiation by restricting autocrine IL-2 production. J. Immunol.92, 5118–5129 (2014). [DOI] [PMC free article] [PubMed] [Google Scholar]
- 50.Karginov, T. A., Ménoret, A. & Vella, A. T. Optimal CD8+ T cell effector function requires costimulation-induced RNA-binding proteins that reprogram the transcript isoform landscape. Nat. Commun.13, 3540 (2022). [DOI] [PMC free article] [PubMed] [Google Scholar]
- 51.Avitahl, N. et al. Ikaros sets thresholds for T cell activation and regulates chromosome propagation. Immunity10, 333–343 (1999). [DOI] [PubMed] [Google Scholar]
- 52.Winandy, S., Wu, P. & Georgopoulos, K. A dominant mutation in the Ikaros gene leads to rapid development of leukemia and lymphoma. Cell83, 289–299 (1995). [DOI] [PubMed] [Google Scholar]
- 53.Krönke, J. et al. Lenalidomide causes selective degradation of IKZF1 and IKZF3 in multiple myeloma cells. Science343, 301–305 (2014). [DOI] [PMC free article] [PubMed] [Google Scholar]
- 54.Liedmann, S. et al. Localization of a TORC1-eIF4F translation complex during CD8+ T cell activation drives divergent cell fate. Mol. Cell82, 2401–2414.e2409 (2022). [DOI] [PMC free article] [PubMed] [Google Scholar]
- 55.Ahmed, R., Bevan, M. J., Reiner, S. L. & Fearon, D. T. The precursors of memory: models and controversies. Nat. Rev. Immunol.9, 662–668 (2009). [DOI] [PubMed] [Google Scholar]
- 56.Kakaradov, B. et al. Early transcriptional and epigenetic regulation of CD8+ T cell differentiation revealed by single-cell RNA sequencing. Nat. Immunol.18, 422–432 (2017). [DOI] [PMC free article] [PubMed] [Google Scholar]
- 57.Joshi, N. S. et al. Inflammation directs memory precursor and short-lived effector CD8+ T cell fates via the graded expression of T-bet transcription factor. Immunity27, 281–295 (2007). [DOI] [PMC free article] [PubMed] [Google Scholar]
- 58.Youngblood, B. et al. Effector CD8 T cells dedifferentiate into long-lived memory cells. Nature552, 404–409 (2017). [DOI] [PMC free article] [PubMed] [Google Scholar]
- 59.Littman, D. R. et al. Characterization of an expressed CD3-associated Ti gamma-chain reveals C gamma domain polymorphism. Nature326, 85–88 (1987). [DOI] [PubMed] [Google Scholar]
- 60.Ellebrecht, C. T. et al. Reengineering chimeric antigen receptor T cells for targeted therapy of autoimmune disease. Science353, 179–184 (2016). [DOI] [PMC free article] [PubMed] [Google Scholar]
- 61.Lee, J. et al. Antigen-specific B cell depletion for precision therapy of mucosal pemphigus vulgaris. J. Clin. Invest.130, 6317–6324 (2020). [DOI] [PMC free article] [PubMed] [Google Scholar]
- 62.Zhao, Y. et al. Multiple injections of electroporated autologous T cells expressing a chimeric antigen receptor mediate regression of human disseminated tumor. Cancer Res.70, 9053–9061 (2010). [DOI] [PMC free article] [PubMed] [Google Scholar]
- 63.Hamilton, J. R. et al. Targeted delivery of CRISPR-Cas9 and transgenes enables complex immune cell engineering. Cell Rep.35, 109207 (2021). [DOI] [PMC free article] [PubMed] [Google Scholar]
- 64.Brinkman, E. K., Chen, T., Amendola, M. & van Steensel, B. Easy quantitative assessment of genome editing by sequence trace decomposition. Nucleic Acids Res.42, e168–e168 (2014). [DOI] [PMC free article] [PubMed] [Google Scholar]
- 65.Choudhary, S. & Satija, R. Comparison and evaluation of statistical error models for scRNA-seq. Genome Biol.23, 27 (2022). [DOI] [PMC free article] [PubMed] [Google Scholar]
- 66.Wolf, F. A., Angerer, P. & Theis, F. J. SCANPY: large-scale single-cell gene expression data analysis. Genome Biol.19, 15 (2018). [DOI] [PMC free article] [PubMed] [Google Scholar]
- 67.Aibar, S. et al. SCENIC: single-cell regulatory network inference and clustering. Nat. Methods14, 1083–1086 (2017). [DOI] [PMC free article] [PubMed] [Google Scholar]
- 68.Mootha, V. K. et al. PGC-1α-responsive genes involved in oxidative phosphorylation are coordinately downregulated in human diabetes. Nat. Genet.34, 267–273 (2003). [DOI] [PubMed] [Google Scholar]
- 69.Subramanian, A. et al. Gene set enrichment analysis: a knowledge-based approach for interpreting genome-wide expression profiles. Proc. Natl Acad. Sci. USA102, 15545–15550 (2005). [DOI] [PMC free article] [PubMed] [Google Scholar]
- 70.Wu, T. et al. clusterProfiler 4.0: a universal enrichment tool for interpreting omics data. Innovation10.1016/j.xinn.2021.100141 (2021). [DOI] [PMC free article] [PubMed]
- 71.Borcherding, N., Bormann, N. L. & Kraus, G. scRepertoire: an R-based toolkit for single-cell immune receptor analysis. F1000Res.9, 47 (2020). [DOI] [PMC free article] [PubMed] [Google Scholar]
- 72.Ellebrecht, C. et al. Fate induction in CD8 chimeric antigen receptor T-cells through asymmetric cell division. Zenodo 10.5281/zenodo.11672288 (2024).
Associated Data
This section collects any data citations, data availability statements, or supplementary materials included in this article.
Supplementary Materials
Uncropped immunoblots from Extended Data Fig. 11.
Nucleotide and amino acid sequences of CD19-sortase, gdTCR-sortase, anti-gdTCR CAR, anti-CD19 CAR, CD3d-P2A-CD3g, CD3z-P2A-CD3e and IgG4 hinge.
Guide RNA sequences for CRISPR knockout of human CD19 and human IKZF1.
Primer sequences for PCR amplification of IKZF1 locus for subsequent tracking of indels by decomposition analysis.
Custom TotalSeq-C antibody cocktail containing 198 antibodies detecting human surface proteins and seven isotype controls.
Live-cell imaging of CD19-targeting CD8 CART cells (blue, CellTrace Violet) interacting with Nalm6 cells (green, GFP) expressing CD19-sortase loaded with LPETG peptide (AF647, white), demonstrating enrichment of LPETG signal at the immune synapse between target and CART cells. Target cells were used in fivefold excess. Images were obtained every 45 s.
Live-cell imaging indicates LPETG (AF647, red) peptide is retained on one daughter CART cell during mitosis, while the other daughter cell remains label-free. Arrow indicates mitosis of interest. Images were obtained every 3 min.
Data Availability Statement
Single-cell sequencing data have been deposited in the NCBI Gene Expression Omnibus and are accessible through the accession number GSE268878. Source data are provided with this paper.
Scripts for single-cell sequencing analysis are available at Zenodo (10.5281/zenodo.11672288)72.


