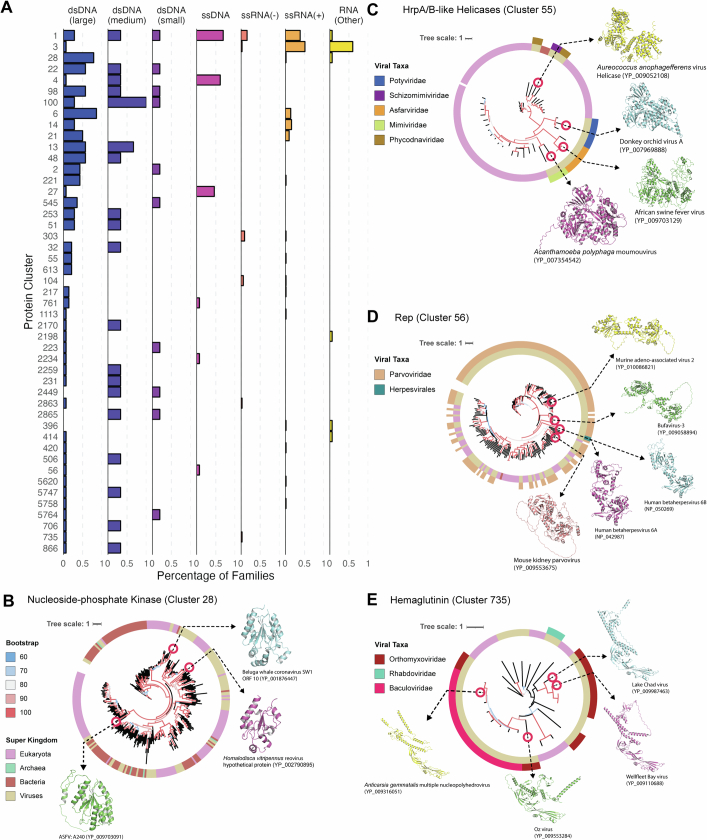
Extended Data Fig. 5. Horizontal gene transfer drives the emergence of taxonomically-diverse protein clusters.
A. Protein clusters were ranked as follows: 1) by the number of genome types of viral species that encode cluster members, followed by 2) the number of viral families that encode cluster members. The top 50 protein clusters by this metric were included in the plot. Each row is a protein cluster (with the number indicating the protein cluster ID). The X axis indicates the percentage of viral families of each genome type that contain a viral species that encodes a member of the protein cluster. B. A polyphyletic protein cluster of a nucleotide-phosphate kinase fold. The ring indicates the Superkingdom of each member of the tree. The structures of individual members are highlighted. The scale bar indicates substitutions per site. C. A polyphyletic protein cluster of HrpA/B-like helicases. The inner ring indicates the Superkingdom of each member of the tree, with the same color key as panel B. The outer ring indicates the viral taxa (here, viral family) of relevant members of the tree. The structures of individual members are highlighted. The scale bar indicates substitutions per site. D. A monophyletic protein cluster of Rep-like proteins shows sequence similarity between Parvovirus Rep proteins and a Rep-like protein in HHV6A and HHV6B. The inner ring indicates the Superkingdom of each member of the tree, with the same color key as panel B. The outer ring indicates the viral taxa (here, viral family) of relevant members of the tree. The structures of individual members are highlighted. The scale bar indicates substitutions per site. E. A monophyletic protein cluster of Hemagglutinin-like proteins shows sequence similarity between a clade of orthomyxovirus and baculovirus hemagglutinins. The inner ring indicates the Superkingdom of each member of the tree, with the same color key as panel B. The outer ring indicates the viral taxa (here, viral family) of relevant members of the tree. The structures of individual members are highlighted. The scale bar indicates substitutions per site.

