Abstract
Salinity stress adversely affects plant growth by disrupting water uptake, inducing ion toxicity, initiating osmotic stress, impairing growth, leaf scorching, and reducing crop yield. To mitigate this issue, the application of kaempferol (KP), caffeic acid (CA), and plant growth-promoting rhizobacteria (PGPR) emerges as a promising technology. Kaempferol, a flavonoid, protects plants from oxidative stress, while caffeic acid, a plant-derived compound, promotes growth by regulating physiological processes. PGPR enhances plant health and productivity through growth promotion, nutrient uptake, and stress mitigation, providing a sustainable solution. However, combining these compounds against drought requires further scientific justification. That’s why the current study was conducted using 4 treatments, i.e., 0, 20 µM KP, 30 μM CA, and 20 µM KP + 30 μM CA without and with PGPR (Bacillus altitudinis). There were 4 replications following a completely randomized design. Results showed that 20 µM KP + 30 μM CA with PGPR caused significant enhancement in potato stem length (14.32%), shoot root, and leaf dry weight (16.52%, 11.04%, 67.23%), than the control. The enrichment in potato chlorophyll a, b, and total (31.86%, 46.05%, and 35.52%) was observed over the control, validating the potential of 20 µM KP + 30 μM CA + PGPR. Enhancement in shoot N, P, K, and Ca concentration validated the effective functioning of 20 µM KP + 30 μM CA with PGPR evaluated to control. In conclusion, 20 µM KP + 30 μM CA with PGPR is the recommended amendment to alleviate salinity stress in potatoes.
Keywords: Salinity stress, Antioxidant, Growth attributes, Caffeic acid, Flavonoid
Subject terms: Plant sciences, Plant stress responses, Abiotic
Introduction
Soil salinization poses a significant hazard to approximately 800 million hectares of global agricultural land1. This concern is intensified by climate fluctuations and the utilization of deficient irrigation water, contributing to its ongoing proliferation2. The increased salinity in the soil has detrimental effects on soil structure and plant health, leading to ionic imbalances and osmotic stress3. Consequently, plants experience physiological drought and nutrient deficiencies, initiating a rise in reactive oxygen species (ROS) within the plants. These ROS harm proteins, nucleic acids, and lipids4.
Plants contain the flavonoid kaempferol, a potent antioxidant that protects against oxidative stress and increases resilience5. It strengthens defensive systems, protects against infections, and regulates hormones, which positively affect development and growth, including the development and seed germination6. Furthermore, natural plant chemical called caffeic acid promotes healthy plant development by boosting stress tolerance, functioning as an antioxidant, controlling physiological processes, including hormone signaling and photosynthesis, and strengthening defenses against pests and diseases7.
In addition to the above, plant growth-promoting rhizobacteria, or PGPR, benefit plants by encouraging growth, making it easier to absorb nutrients, and reducing environmental stress8. In addition, they promote systemic resistance and inhibit soil-borne diseases, which improves plant health and yield. PGPR provides an environmentally responsible and sustainable means of enhancing crop performance in agriculture9.
After rice, wheat, and maize, potatoes (Solanum tuberosum L.) are the fourth most important staple in the world10. Rice is a great source of minerals, ascorbic acid, dietary fiber, riboflavin, proteins, and carbs. Potato shows a key role in addressing the nutritional needs of the world's population11. With estimates projecting a global population between 8.8 and 10 billion by the mid-century. Potato is key to securing food and nutritional requirements, especially in developing nations12.
To lessen the impacts of salt stress on potato plants, the current study investigates the potential of KP and CA combined with PGPR. The present study addresses the knowledge gap about which treatment works best for potatoes when paired with PGPR to reduce salt stress. We hypothesized that applying KP and CA along with PGPR would play a role in improving potato growth and production while allivate the adverse effects of salt stress.
Material and methods
Experimental site
In 2022, an experiment will be conducted at the Research Solution experimental area (30° 09′ 41.6″ N 71° 36′ 38.0″ E). Soil samples were acquired from the research area. These samples went through air drying and were sieved through a 2-mm mesh to assess their physicochemical properties. The physiochemical characteristics of soil and irrigation water are provided in Table 1.
Table 1.
Pre-experimental soil and irrigation characteristics.
| Soil | Values | References | Irrigation | Values | References |
|---|---|---|---|---|---|
| pH | 815 | 13 | pH | 7.18 | 14 |
| ECe (dS/m) | 2.39 | 15 | EC (µS/cm) | 378 | |
| SOM (%) | 0.54 | 16 | Bicarbonate (meq./L) | 4.69 | |
| Texture | Clay Loam | 17 | Carbonates (meq./L) | 0.01 | |
| Extractable Sodium (µg/g) | 116 | 18 | Chloride (meq./L) | 0.02 | |
| Extractable Potassium (µg/g) | 131 | 19 | Sodium (mg/L) | 107 | |
| Total Nitrogen (%) | 0.04 | 20 | Ca + Mg (meq./L) | 2.75 | |
| Available Phosphorus (µg/g) | 6.22 | 21 | |||
Isolation, incubation, and purification of PGPR isolates
To isolation, Bacillus altitudinis, 1.0 g of homogenized soil from the rhizosphere, underwent serial dilutions ranging from 10–1 to 10–7. To facilitate the isolation of ACC deaminase-producing Bacillus altitudinis, a DF minimal salt medium supplemented with ACC (nitrogen source) was prepared,22. The Petri dishes containing the isolated samples were then incubated at 25 °C for 48 h. In the subsequent purification step, 55 isolates were selected and subjected to repeated streaking on DF media to obtain pure strains.
Treatments plan
The treatments include a control, 20 µM KP (Kaempferol), 30 µM CA (Caffeic acid), and 20 µM KP + 20 µM CA. All the treatments were applied with or without PGPR (Bacillus altitudinis). A fully randomized design (CRD) was used in the trial, with four replications for each treatment.
Sowing and sterilization of seeds
The study used potato seeds from a licensed seed trader in Punjab, Pakistan. They underwent a meticulous surface sterilization process, including three washes with 95% ethanol, exposure to a 5% sodium hypochlorite solution, and three additional rinses with sterilized deionized water to ensure complete removal of residues from the sterilizing agents23. After sterilization, 15 seeds were placed in each pot with 5 kg of soil, and thinning was performed to plant 6 healthy seedlings in each pot.
Fertilizer
To meet the nutritional needs of potatoes, we implemented a nitrogen (N) application at a rate of 100 kg/acre (equivalent to around 0.31 g/10 kg soil), obtained from urea. Simultaneously, phosphorus (P) was introduced at a rate of 50 kg/acre (approximately 0.15 g/10 kg soil), obtanied from a single superphosphate, by recommended application protocols. Additionally, to enhance potassium (K) levels, we augmented the soil with 50 kg per acre of potassium sulfate (about 0.15 g/10 kg soil).
Irrigation
The irrigation control for individual pots was meticulously handled using a moisture gauge (ADVANCED™; 4 in 1 Soil Meter; China). Regular monitoring ensured the maintenance of moisture levels within the specified range, by the device's scale. The term 'wet' on the scale corresponded approximately to 70% of the soil's field capacity, and daily supervision was undertaken to uphold this standard.
Data collection
After cultivation of 65 days from the planting of seed tubers, specifically during the tuber initiation stage, four plants were randomly selected from each experimental plot. These chosen plants were carefully uprooted and promptly transferred to the laboratory to measure various parameters. The assessment included determining the average length of the main stem. Following the uprooting process, the plant shoots and roots were carefully separated. Following that, both parts were dried at 70 °C until a consistent weight was obtained. Chlorophyll content and the dry weight of the roots and shoots were measured and recorded. Conversely, the amount of N, P, as well as K in leaves that were collected and harvested 65 days after germination was measured.
Estimation of chlorophyll
This study involved preparing freshly harvested leaf specimens with 80% acetone, centrifuging them, and extracting the remaining material. The supernatant was then used for color extraction, and the accumulated supernatants were used to assess chlorophyll content. Specific wavelengths were used for absorbance measurements, including 663 nm for chlorophyll a, 645 nm for chlorophyll b, and 470 nm for carotenoids. The resulting analysis provided valuable insights into leaf composition24.
Total soluble sugar contents
The approach proposed by25 was employed for assessing the total sugar content by utilizing anthrone and 80% sulfuric acid (H2SO4). The mixture in test tubes was subjected to a water bath for 10 min, heated, and cooled in ice water. The optical density was measured at a wavelength of 620 nm.
Total soluble proteins
Determining total soluble protein levels in this study utilized the Biuret method26. Following the addition of necessary chemical components and thorough shaking, the tubes were subjected to an incubation period at room temperature for 25 min. The optical density was observed using a UV-spectrophotometer at a wavelength of 545 nm. A standard curve for protein was established using bovine serum albumin, enabling the calculation of the total protein content.
Gas exchange attributes
Net transpiration rate, stomatal conductance, net photosynthetic rate, and Intercellular CO2 concentration were examined using the CI-340 Photosynthesis system. The assessments were performed within the peak sunlight hours, specifically from 10:30 to 11:30 AM, to guarantee an ideal and saturating light intensity conducive to effective photosynthesis27.
Antioxidants
The study assessed superoxide dismutase (SOD) activity by observing the inhibition of nitro blue tetrazolium reduction in riboflavin, using a reaction mixture under illumination and 560 nm absorbance measurements28. The activity of peroxidase (POD) was assessed by observing substrate oxidation, with the absorbance surge gauged at 420 nm wavelength29. The catalase activity was determined by tracking the decomposition of hydrogen peroxide, with a quantified reduction in absorbance at 240 nm30. The sample extract was analyzed for malondialdehyde (MDA) by reacting it with thiobarbituric acid (TBA) and measuring its absorbance at 532 nm31.
Nutrient analysis
The analysis of leaf nutrient content, including nitrogen, phosphorus, potassium, and calcium, was conducted on dried leaves through the utilization of a digested extract. The preparation of the digested extract followed the sulphonic-perchloric acid method32. For the determination of leaf nitrogen content, the Kjeldahl digestion method33. The quantification of phosphorus in the leaf involved the application of an ascorbic colorimetric method34. Additionally, potassium and calcium levels in the leaf were assessed using the flame photometer method35 on the digested aqueous extract.
Statistical analysis
Statistical analysis was conducted to compare the data, utilizing standard methods. The treatment's significance was assessed using a Two-way ANOVA, with the Tukey test performed for paired comparisons with a significance level of p ≤ 0.05. Additionally, OriginPro software36 was used to create cluster plot hierarchical cluster plots, convex hulls, and Pearson correlation analyses.
Results
Stem length, shoot root, and leaf dry weight.
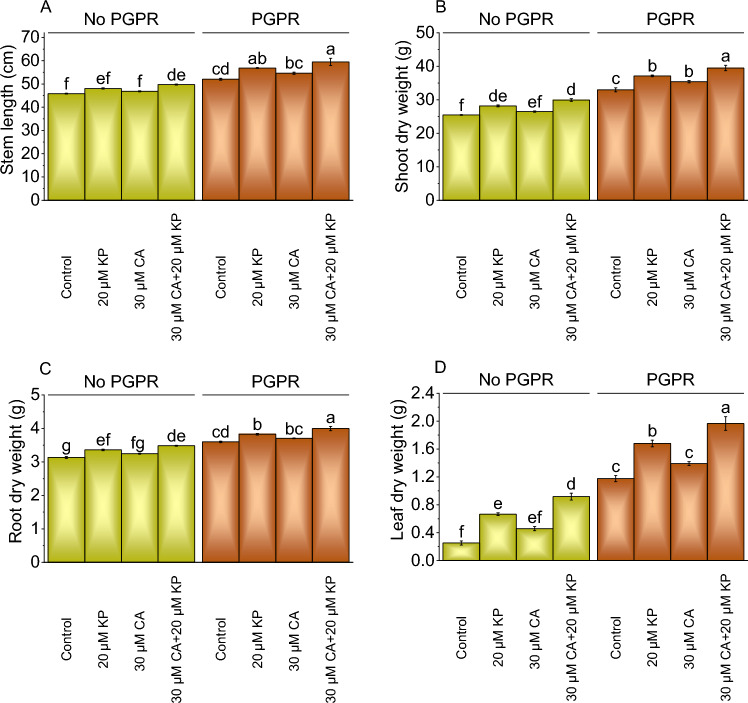
In the experiment measuring the effect of different treatments (20 μM KP, 30 μM CA) on stem length (cm) with and without PGPR. When treated with 20 μM KP, the stem length increased to 4.93% compared to the control, and 30 μM CA resulted in a 2.22% increase without PGPR. The combination of 30 μM CA and 20 μM KP led to a more pronounced effect, resulting in an 8.60% increase over the control without PGPR. When treated with 20 μM KP with PGPR, the stem length increased to a 9.30% rise over the control. Treatment with 30 μM CA alone with PGPR resulted in a 5.00% increase, and 30 μM CA + 20 μM KP had the most substantial impact showing a 14.32% increase from the control (Fig. 1A).
Fig. 1.
Effect of treatments on stem length (A), shoot dry weight (B), root dry weight (C), and leaf dry weight (D) of potato cultivated with and without PGPR. The bars showed the mean of four replicates with ± SE. The distinct letters on the bars indicate significant variations found at p < 0.05 using the Tukey test.
In the absence of PGPR, adding 20 μM KP treatment resulted in a 10.58% increase in shoot dry weight and 30 μM CA led to a 3.93% increase. The combined 30 μM CA + 20 μM KP treatment resulted in a significant 17.45% increase in shoot dry weight than the control under no PGPR. Adding PGPR with 20 μM KP resulted in a 12.62% increase in shoot dry weight and 30 μM CA with PGPR led to a 7.39% increase. The combined treatment of 30 μM CA and 20 μM KP with PGPR showed the highest percentage increase, with a 19.74% rise in shoot dry weight over the control (Fig. 1B).
In the case of root dry weight, the application of 20 μM KP led to a 7.26% increase, 30 μM CA showed a 3.59% rise, and combining 30 μM CA with 20 μM KP resulted in an 11.17% increase over the control under no PGPR. In contrast, when PGPR was introduced with 20 μM KP led to a 6.32% increase more than the control, with 30 μM CA showed a 2.92% increase, and combining 30 μM CA with 20 μM KP resulted in an 11.04% increase (Fig. 1C).
The application of 20 μM KP, 30 μM CA, and 20 μM KP + 30 μM CA without PGPR resulted in a remarkable increase of 98.37%, 81.19%, and 99.37% in root dry weight parallel to the control. When PGPR was added with 20 μM KP, 30 μM CA, and 20 μM KP + 30 μM CA treatment resulted in 42.98%, 18.30%, and 67.23% increase in root dry weight over the control (Fig. 1D).
Chlorophyll and carotenoid content
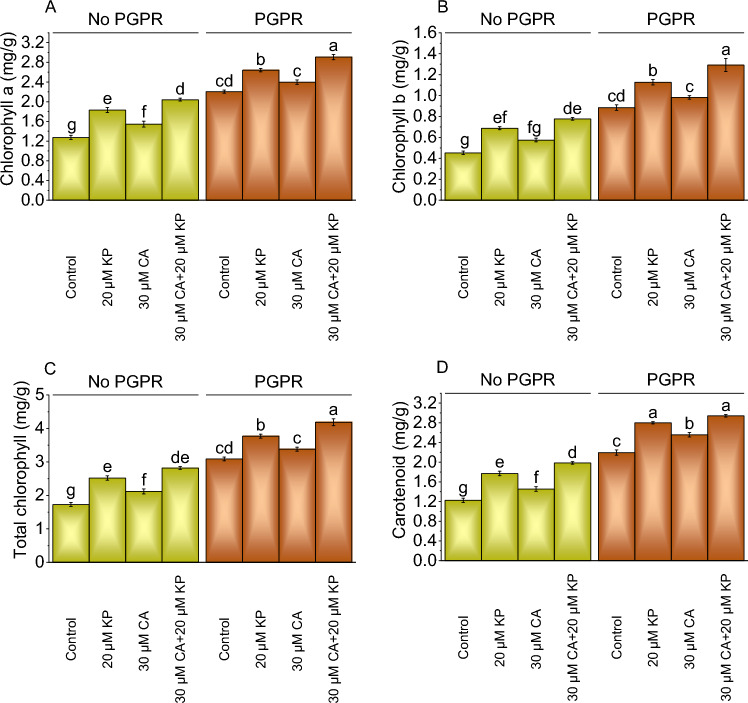
The chlorophyll a content in the plant samples was assessed in the absence of PGPR, the application of 20 μM KP led to a significant 43.73% increase in chlorophyll a, adding 30 μM CA, and 30 μM CA + 20 μM KP resulted in a 21.18% and 60.20% increase over the control. Applying PGPR with 20 μM KP and 30 μM CA led to a 19.84% and 8.84% increase in chlorophyll a content above the control. The combined treatment of 30 μM CA and 20 μM KP under PGPR showed a 31.86% increase in chlorophyll a content more than the control (Fig. 2A).
Fig. 2.
Effect of treatments on chlorophyll a (A), chlorophyll b (B), total chlorophyll (C), and carotenoid (D) of potato cultivated with and without PGPR. The bars showed the mean of four replicates with ± SE. The distinct letters on the bars indicate significant variations found at p < 0.05 using the Tukey test.
In the absence of PGPR, adding 20 μM KP resulted in a 51.93% increase in chlorophyll b, while 30 μM CA led to a 27.07% rise above the control. Without PGPR, the 30 μM CA + 20 μM KP exhibited the highest increase of 71.82% in chlorophyll b contents. In the presence of PGPR, the addition of 20 μM KP resulted in a 27.40% intensification in chlorophyll b related to the control, 30 μM CA showed an 11.02% rise, and the combination of 30 μM CA and 20 μM KP yielded a 46.05% increase (Fig. 2B).
With no PGPR, total chlorophyll showed a 45.88% increase with 20 μM KP treatment in contrast to the control, while 30 μM CA treatment resulted in a 22.72% increase, and combined treatment of 30 μM CA and 20 μM KP caused a 63.24% increase. In contrast, with PGPR, 20 μM KP treatment showed a 22.01% increase in total chlorophyll content, while 30 μM CA treatment exhibited a 9.47% increase above the control. The combined treatment of 30 μM CA and 20 μM KP with PGPR resulted in a 35.52% improvement in total chlorophyll content in comparison to the control (Fig. 2C).
In no PGPR, adding 20 μM KP resulted in a 44.49% increase in carotenoid content, 30 μM CA showed an 18.78% rise, and the combination of 30 μM CA and 20 μM KP exhibited a 62.04% enhancement from the control. Adding 20 μM KP treatment with PGPR showed a 27.56% increase in carotenoid more than the control, 30 μM CA exhibited a 16.51% rise, and the combination of 30 μM CA and 20 μM KP resulted in a 34.05% increase (Fig. 2D).
Gass exchange attributes
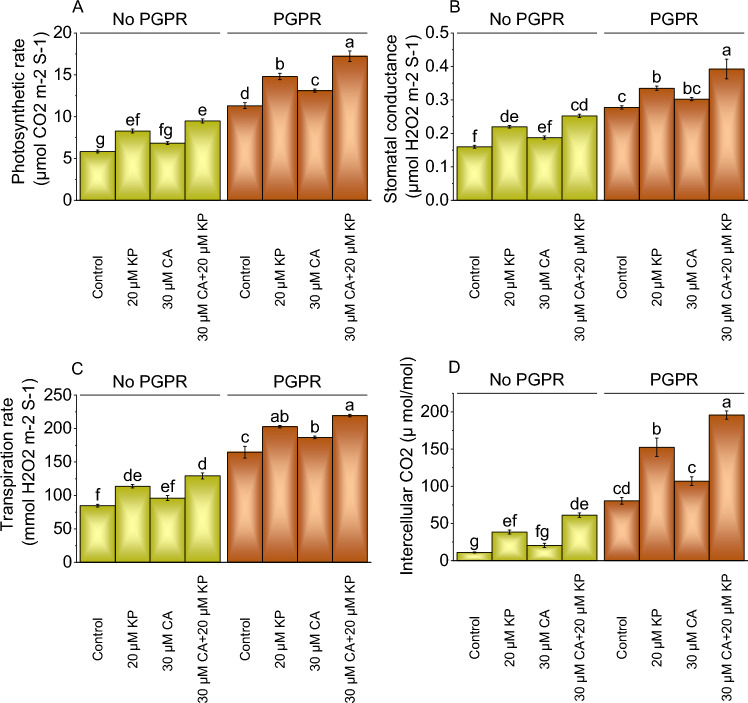
The photosynthetic rate exhibited significant variations across different treatments. In the absence of PGPR, applying 20 μM KP caused a 41.87% rise in photosynthetic rate than the control, while 30 μM CA led to a 17.21% rise. A combined treatment of 30 μM CA and 20 μM KP showed a substantial 62.54% enhancement in photosynthetic rate without PGPR. When PGPR was applied with 20 μM KP resulted 30.86% increase in photosynthetic rate, a 15.96% rise at 30 μM CA, and a remarkable 52.34% rise with the combined 30 μM CA and 20 μM KP treatment more than the control (Fig. 3A).
Fig. 3.
Effect of treatments on photosynthetic rate (A), stomatal conductance (B), transpiration rate (C), and intracellular CO2 (D) of potato cultivated with and without PGPR. The bars showed the mean of four replicates with ± SE. The distinct letters on the bars indicate significant variations found at p < 0.05 using the Tukey test.
In the absence of PGPR, 20 μM KP treatment resulted in a 37.50% increase in stomatal conductance over the control, while 30 μM CA treatment showed a 17.19% increase. The combined treatment of 30 μM CA and 20 μM KP exhibited the highest increase of 57.81% in stomatal conductance without PGPR. In the presence of PGPR, the addition of 20 μM KP led to a 20.72% increase in stomatal conductance, 30 μM CA showed a 9.01% increase, and the combination of 30 μM CA and 20 μM KP resulted in a 41.44% increase from the control (Fig. 3B).
In the absence of PGPR, 20 μM KP exhibited a 34.12% increase in transpiration rate, while 30 μM CA showed a 13.30% rise over the control. The combined application of 30 μM CA and 20 μM KP led to a substantial 52.35% surge in stomatal conductance without PGPR. In the presence of PGPR, the 20 μM KP treatment resulted in a 23.17% rise, 30 μM CA showed a 13.46% increase, and the combination of 30 μM CA and 20 μM KP exhibited a 33.24% rise in stomatal conductance assessed over the PGPR control (Fig. 3C).
Under no PGPR, applying 20 μM KP led to a 58.02% increase in intercellular CO2 level, while 30 μM CA resulted in a modest 5.81% rise from the control. The combined treatment of 30 μM CA and 20 μM KP exhibited a substantial 99.39% increase in intercellular CO2 level compared to the control. In contrast, when PGPR was present, the addition of 20 μM KP caused a 54.52% elevation in intercellular CO2 level, 30 μM CA led to an 8.35% increase, and the combination of 30 μM CA and 20 μM KP resulted in a significant 98.45% rise related to the PGPR control (Fig. 3D).
Total soluble sugars, soluble proteins, and free amino acids
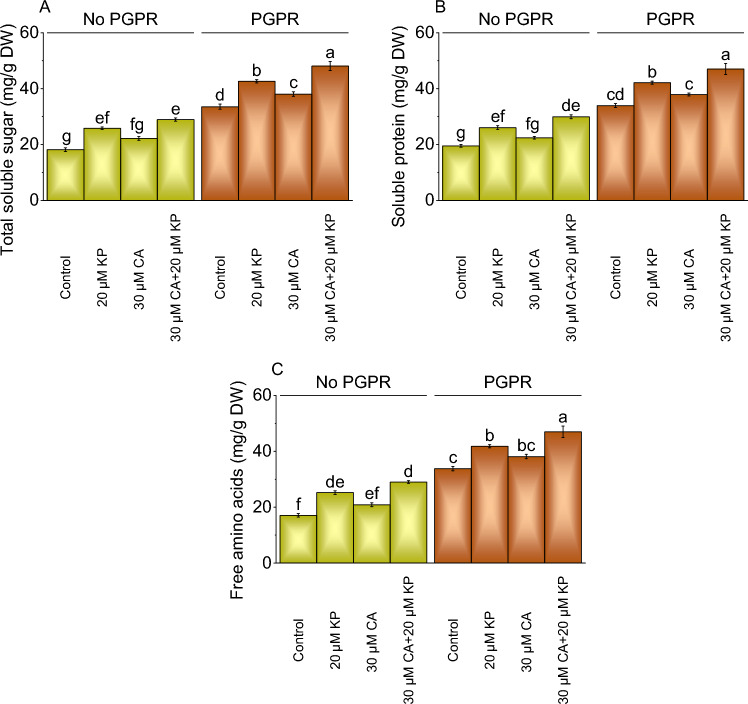
The total soluble sugar content in plant samples varied across different treatments. Without PGPR, treatment 20 μM KP showed a 42.11% increase, while the 30 μM CA treatment exhibited a 21.96% rise, and the combined application of 30 μM CA and 20 μM KP resulted in a 59.23% rise. With PGPR, adding 20 μM KP and 30 μM CA treatments showed a 2.04% and 28.94% increase in total soluble sugars, over the control (Fig. 4A).
Fig. 4.
Effect of treatments on total soluble sugars (A), soluble proteins (B), and free amino acids (C) of potato cultivated with and without PGPR. The bars showed the mean of four replicates with ± SE. The distinct letters on the bars indicate significant variations found at p < 0.05 using the Tukey test.
Without PGPR, treatment 20 μM KP showed a 33.41% increase in soluble proteins, 30 μM CA resulted in a 14.78% increase while combining 30 μM CA with 20 μM KP showed a significant 53.28% increase. Adding 20 μM KP with PGPR led to a 24.10% increase in soluble proteins, 30 μM CA resulted in an 11.66% increase, and the combined treatment showed a substantial 38.58% increase (Fig. 4B).
The free amino acid content in plant samples treated with 20 μM KP without PGPR showed a 47.66% increase over the control. Treatment with 30 μM CA without PGPR resulted in a 22.20% rise over the control and application of 30 μM CA + 20 μM KP without PGPR exhibited a 69.78% increase in free amino acids. In contrast to the control, adding 20 μM KP with PGPR resulted in a 23.70% rise in free amino acids, while 30 μM CA showed a 12.79% increase. The combined application of 30 μM CA and 20 μM KP with PGPR led to a 39.03% rise in free amino acids compared to the control (Fig. 4C).
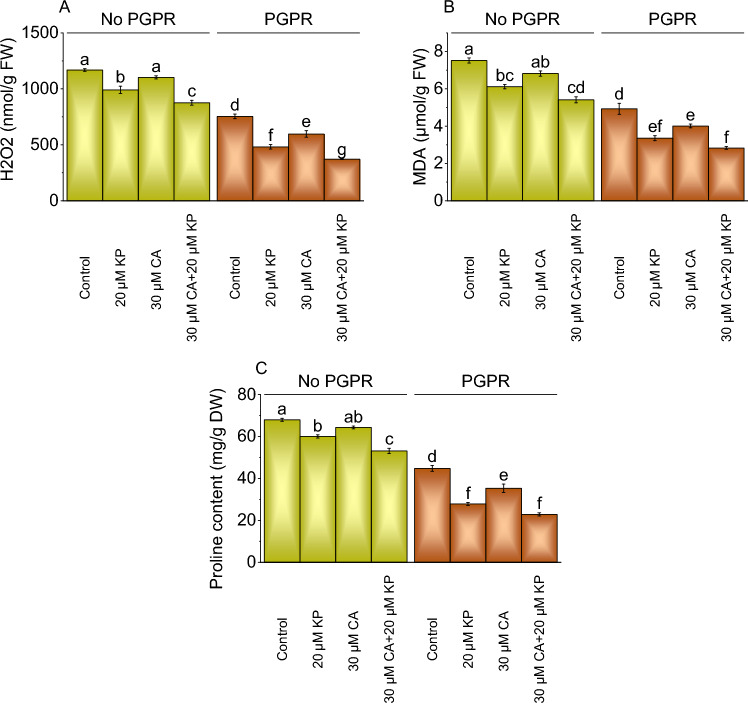
H2O2, MDA, and proline content
Adding 20 μM KP to plants without PGPR resulted in a 17.88% decrease in H2O2 levels than the control. The addition of 30 μM CA alone led to a 6.00% decrease in H2O2 level, and 30 μM CA + 20 μM KP without PGPR exhibited a substantial 33.34% rise to the control. The application of PGPR with 20 μM KP showed a 99.82% reduction in H2O2 levels, and the introduction of 30 μM CA resulted in a 26.31% decrease, while the combined treatment of 30 μM CA and 20 μM KP with PGPR showed a remarkable 99.82% decrease from the control (Fig. 5A).
Fig. 5.
Effect of treatments on total H2O2 (Hydrogen Peroxide) (A), MDA (Malondialdehyde) (B), and proline content (C) of potato cultivated with and without PGPR. The bars showed the mean of four replicates with ± SE. The distinct letters on the bars indicate significant variations found at p < 0.05 using the Tukey test.
In the absence of PGPR, the addition of 20 μM KP resulted in a 22.93% reduction in MDA activity over the control, while 30 μM CA showed a 10.22% decrease. The combined treatment of 30 μM CA and 20 μM KP led to a significant 39.00% reduction in MDA levels without PGPR over the control. In contrast to the control, the application of 20 μM KP with PGPR led to a substantial 47.02% decrease from the control, while 30 μM CA with PGPR showed a 23.00% reduction. The combined treatment of 30 μM CA and 20 μM KP with PGPR exhibited the most significant reduction, with a 74.14% decrease in MDA activity more than the control (Fig. 5B).
The proline content measured across different treatments in the absence of PGPR, the application of 20 μM KP resulted in a 13.23% decrease, while 30 μM CA treatment led to a 5.65% decrease. The combined treatment of 30 μM CA and 20 μM KP without PGPR caused a significant 27.98% decrease in proline content. With PGPR, the addition of 20 μM KP with PGPR led to a substantial 61.04% decrease, while 30 μM CA treatment resulted in a 26.78% decrease over the control. The combined treatment of 30 μM CA and 20 μM KP with PGPR induced a remarkable 95.80% decrease in proline content than the control (Fig. 5C).
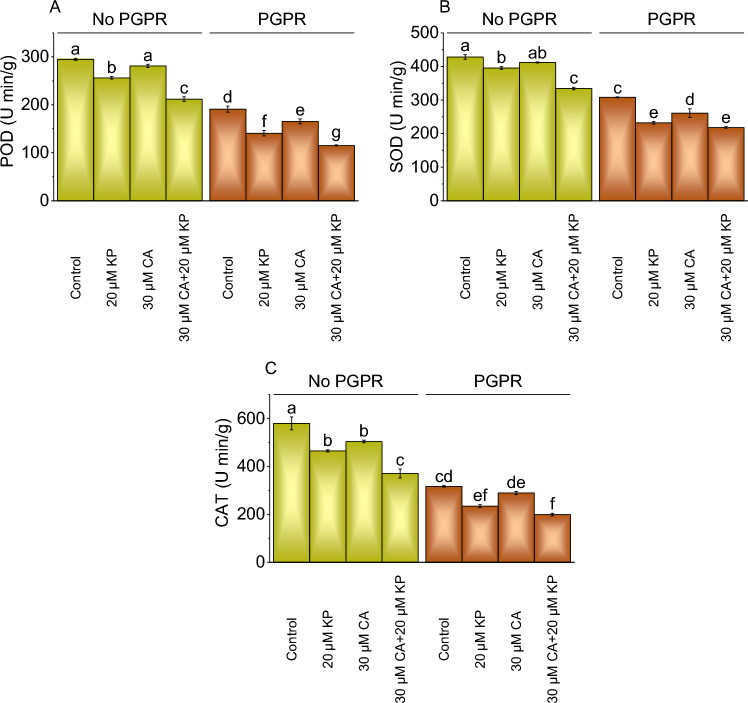
POD, SOD, and CAT activity
In no PGPR, the treatment with 20 μM KP exhibited a 15.09% decline in POD activity from the control, while 30 μM CA showed a 4.92% decrease. The combined treatment of 30 μM CA and 20 μM KP caused a 39.11% decrease in POD activity more than the control. The application of PGPR with 20 μM KP led to a 35.83% decrease in POD activity, 30 μM CA showed a 15.47% decrease, and the combined treatment showed a remarkable 65.70% decrease in POD activity than the control (Fig. 6A).
Fig. 6.
Effect of treatments on POD (Peroxidase) (A), SOD (Superoxide Dismutase) (B), and CAT (Catalase) (C) of potato cultivated with and without PGPR. The bars showed the mean of four replicates with ± SE. The distinct letters on the bars indicate significant variations found at p < 0.05 using the Tukey test.
In the absence of PGPR, the application of 20 μM KP led to an 8.28% decrease in SOD activity over the control, while 30 μM CA resulted in a 3.88% decrease. The combination of 30 μM CA and 20 μM KP showed a substantial 28.05% decrease in SOD contrasted to the control. The application PGPR with 20 μM KP, 30 μM CA, and 30 μM CA + 20 μM KP led to a notable 32.54%, 17.94%, and 41.11% decrease in SOD activity more than the control (Fig. 6B).
The CAT levels without PGPR treated with 20 μM KP showed a 24.65% decrease, while treatment with 30 μM CA resulted in a 14.98% reduction assessed over the control. The combined treatment of 30 μM CA and 20 μM KP exhibited a significant 56.28% decrease in CAT levels over the control in no PGPR. Treatment of 20 μM KP with PGPR led to a 35.19% decrease in CAT activity, 30 μM CA and 30 μM CA + 20 μM KP showed a 30 μM CA and 59.10% reduction evaluated to the PGPR control (Fig. 6C).
Leaf N, P, K, and Ca
Leaf nitrogen content varied significantly across different treatments. Under no PGPR, 20 μM KP resulted in a 3.00% increase in leaf nitrogen, while 30 μM CA led to a 1.58% decrease compared to the control. The combined application of 30 μM CA and 20 μM KP exhibited a 7.57% increase in leaf N without PGPR. In the presence of PGPR, the application of 20 μM KP resulted in an 8.15% increase more than the control, 30 μM CA showed a 4.07% increase, and the combined treatment demonstrated the highest boost with an 11.03% increase in leaf N competed to the control (Table 2).
Table 2.
Effect of treatments on N, P, K, and Ca of shoot in potato.
| Treatment | Shoot N (%) | Shoot P (%) | Shoot K (%) | Shoot Ca (%) |
|---|---|---|---|---|
| No PGPR | ||||
| Control | 3.17ef | 1.58f | 3.25f | 0.41f |
| 20 μM KP | 3.27ef | 2.19e | 3.56e | 0.44de |
| 30 μM CA | 3.22f | 1.85ef | 3.32f | 0.42ef |
| 30 μM CA + 20 μM KP | 3.41de | 2.89d | 3.70de | 0.45cd |
| PGPR | ||||
| Control | 3.56cd | 3.30c | 3.88cd | 0.46bcd |
| 20 μM KP | 3.85ab | 4.13b | 4.24ab | 0.48ab |
| 30 μM CA | 3.71bc | 3.76b | 4.08bc | 0.47bc |
| 30 μM CA + 20 μM KP | 3.95a | 4.60a | 4.40a | 0.49a |
The values are means four replicates. Significant variations were observed at p < 0.05 for different letters; Tukey Test. PGPR instead of PGPR.
With no PGPR, applying 20 μM KP resulted in a 38.61% increase in leaf phosphorus above the control, while 30 μM CA led to a 16.77% rise. A combined treatment of 30 μM CA and 20 μM KP exhibited the highest percentage increase of 83.07% over the control without PGPR. In contrast, with PGPR the application of 20 μM KP led to a 25.34% increase, 30 μM CA resulted in a 14.04% rise, and the combined treatment showed a 39.45% increase compared to the PGPR control (Table 2).
Leaf potassium levels were measured under different treatments. The addition of 20 μM KP caused a 9.30% rise in lea K over the control, while 30 μM CA showed a 2.15% increase. The combined application of 30 μM CA and 20 μM KP led to a notable 13.84% increase from the control without PGPR. Conversely, in the presence of PGPR, the 20 μM KP treatment exhibited a 9.14% increase in leaf K in contrast to the control, 30 μM CA showed a 5.09% increase, and the combined 30 μM CA and 20 μM KP treatment resulted in a significant 13.26% rise related to the PGPR control (Table 2).
In comparison to the control group, applying 20 μM KP resulted in a 7.33% increase in leaf Ca, while 30 μM CA led to a 2.02% rise. Combining 30 μM CA with 20 μM KP exhibited a higher percentage increase of 10.21% without PGPR. In contrast to the control, the addition of 20 μM KP and 30 μM CA with PGPR resulted in 3.70% and 1.58% increases in leaf Ca, respectively from the control. The combined treatment of 30 μM CA and 20 μM KP with PGPR demonstrated a 7.02% rise over the PGPR control (Table 2).
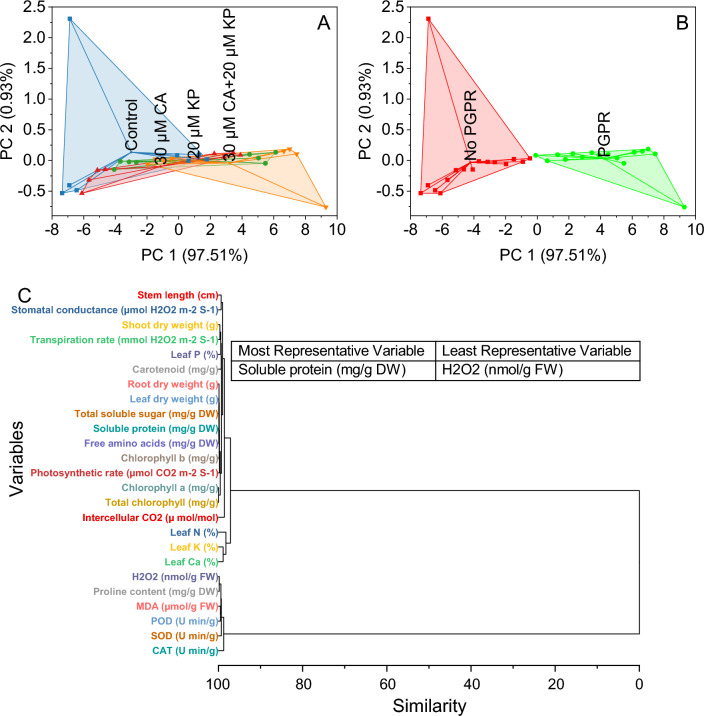
Convex hull and hierarchical cluster analysis
In the control group, scores were distributed with PC1 at 97.51% and PC2 at 0.93%. Control samples exhibited similar patterns, with coordinates such as − 6.87405, 2.30868, and other closely related values. The addition of 20 μM KP shifted the distribution, indicating a shift in the treatment effect. For instance, scores like − 4.07552, and − 0.14597, were associated with the 20 μM KP treatment. Similarly, the introduction of 30 μM CA and the combination of 30 μM CA with 20 μM KP displayed distinct clusters on the Convex Hull plot, reflecting treatment-specific variations (Fig. 7A).
Fig. 7.
Cluster plot convex hull for treatments (A), PGPR levels (B), and hierarchical cluster analysis (C) for studied attributes.
In the presence of PGPR, where PC1 accounted for 97.32% and PC2 for 0.94%, the samples were primarily labeled as no PGPR. These samples exhibited scores ranging from − 7.33598 to − 2.70506 on PC1 and from − 0.58878 to 0.00853 on PC2. In contrast, the PGPR samples demonstrated a separate cluster with scores ranging from − 0.12298 to 9.264 on PC1 and from − 0.78609 to 0.16349 on PC2 (Fig. 7B).
Variables such as chlorophyll a, total chlorophyll, soluble protein, free amino acids, leaf dry weight, and total soluble sugar exhibited close similarity, forming distinct clusters. Similarly, variables including Root dry weight, H2O2, proline content, chlorophyll b, and photosynthetic rate were clustered together. Shoot dry weight and transpiration rate formed another cluster, while MDA and POD demonstrated a close relationship in a separate cluster. Leaf P and carotenoid showed proximity, as did stem length and stomatal conductance. SOD, Leaf K, and Leaf Ca shared a common cluster, while CAT, Intercellular CO2, and Leaf N were grouped. Notably, two distinct major clusters emerged, one comprising variables related to plant physiology and the other involving variables associated with enzymatic activities (Fig. 7C).
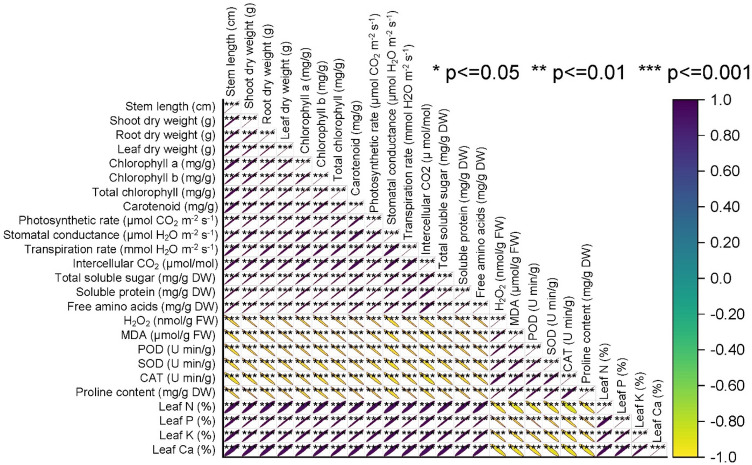
Pearson correlation analysis
The results indicate strong positive correlations among several key physiological and biochemical parameters. Notably, stem length exhibited a highly positive correlation with shoot dry weight (r = 0.98983), root dry weight (r = 0.9871), and leaf dry weight (r = 0.98794). These findings suggest a strong positive association between stem length and the overall plant biomass. Chlorophyll (a, b, and total) content showed strong positive correlations with each other (r values ranging from 0.96792 to 0.99912), indicating a close relationship among these photosynthetic pigments. Similarly, carotenoid content positively correlated with chlorophyll a, b, and total chlorophyll (r values ranging from 0.96705 to 0.99111). Photosynthetic parameters, such as photosynthetic rate, stomatal conductance, and transpiration rate, exhibited strong positive correlations among themselves (r values ranging from 0.95415 to 0.99579), suggesting their coordinated response in plant physiology. The analysis also revealed strong positive correlations among various biochemical parameters, such as total soluble sugar, soluble protein, and free amino acids (r values ranging from 0.98093 to 0.99839), indicating a close association in their metabolic regulation. Conversely, oxidative stress markers like H2O2, MDA, POD, SOD, and CAT demonstrated negative correlations with plant growth and photosynthetic parameters, highlighting a potential antagonistic relationship between oxidative stress and overall plant health (Fig. 8).
Fig. 8.
Pearson correlation analysis of the studied attributes.
Discussion
Salinity stress adversely impacts crop production by disrupting water uptake and nutrient absorption, reducing growth and yield37. High salt concentrations in the soil delay plant metabolism, causing physiological imbalances that compromise38. It reduces water uptake, causes ionic and oxidative stress, and disrupts essential plant processes like photosynthesis and nutrient uptake39–42. Salinity negatively impacts seed germination, plant growth, and yield, affecting soil microbial activity and fertility43–45. The flavonoid kaempferol is well-known for its role in several physiological functions, such as cell division and elongation46. Kaempferol encourages the elongation and differentiation of plant cells, eventually resulting in longer stems. Conversely, the phenolic compound caffeic acid has been shown to have growth-promoting properties. It can promote the expression of genes linked to cell wall remodeling, leading to increased cell division and elongation47. It and other phenolic compounds increasen plants treated with ferulic acid and salicylic acid under salt stress, improving antioxidant activities and photosynthetic performance48. Salicylic acid enhances salt tolerance by restoring membrane potential and preventing K+ loss49, increasing nutrient content and antioxidant metabolism50, and improving chlorophyll content and membrane stability51. As a phenolic substance, caffeic acid scavenges reactive oxygen species and keeps chlorophyll molecules from being oxidatively damaged52. Improvements in transpiration rate, photosynthetic rate, stomatal conductance, and intercellular CO2 have been associated with the direct and indirect effects of caffeic acid and kaempferol on leaf physiology53. Caffeic acid helps reduce salinity stress by increasing nutrient uptake efficiency, antioxidant activity, and decreasing ion toxicity54. It also improves plant water relations, K+ uptake, and antioxidant enzyme activities in wheat under salt stress55. The improvement in antioxidant enzyme activities (SOD, POD, CAT, and APX) further supports the notion that CA bolsters the plant's defense mechanisms against oxidative damage. The elevated activities of these enzymes in CA-treated plants likely contribute to the observed reduction in ROS levels, thus mitigating the oxidative damage induced by salinity stress. The genotype-specific response, with FSD-08 showing higher enzyme activities, may be indicative of a more robust antioxidant system in this genotype when supplemented with CA55. Nutrient homeostasis is critical for plant growth and development, particularly under stress conditions. Salinity often disrupts the uptake and balance of essential nutrients, such as nitrogen (N), phosphorus (P), and potassium (K), while also affecting the K+/Na+ ratio, which is vital for cellular ion homeostasis. Our results indicate that CA treatment improved the uptake of N, P, and K and the K+/Na+ ratio in the grains of both wheat genotypes. The greater improvement observed in the FSD-08 genotype underscores its superior capacity for maintaining nutrient balance under saline conditions when aided by CA54. When applied as a combine amendment, kaempferol and caffeic acid might potentially enhance photosynthetic efficiency, nitrogen uptake, and biomass accumulation in shoots, promoting carbon dioxide absorption and protein synthesis, respectively56. These substances may work in combination to improve photosynthetic activity and food uptake, which could ultimately increase shoot dry weight57.
Conclusion
In conclusion, using 20 µM KP + 20 µM CA with PGPR (Bacillus altitudinis) has the potential to improve potato growth under salinity stress. The use of 20 µM KP + 20 µM CA treatment with PGPR PGPR (Bacillus altitudinis) significantly enhances the uptake of vital nutrients such as nitrogen (N), phosphorus (P), and potassium (K) in shoot systems and chlorophyll content, which are crucial for promoting potato growth in salinity stress. Additionally, applying 20 µM KP + 20 µM CA with PGPR (Bacillus altitudinis) exhibits the ability to regulate salinity antioxidants, thereby mitigating salinity's adverse effects on potatoes. Further extensive field investigations are warranted to validate the effectiveness of 20 µM KP + 20 µM CA with PGPR (Bacillus altitudinis) as a primary solution for alleviating salinity stress in potatoes, ensuring its practical application in agriculture.
Acknowledgements
This project was supported by Researchers Supporting Project Number (RSP2025R230), King Saud University, Riyadh, Saudi Arabia.
Author contributions
Conceptualization; M.B.H.; A.E.; Conducted experiment; A.E.; M.R.; M.B.H.; Formal analysis; A.E.; M.R.; R.D.; Methodology; R.D.; S.T.A.H.; Writing—original draft; M.J.A.; M.R.; T.A.A.; S.A.A.; Writing—review and editing; M.J.A.; M.R.; T.A.A.; S.A.A.; S.T.A.H.
Funding
This project was supported by Researchers Supporting Project Number (RSP2025R230), King Saud University, Riyadh, Saudi Arabia.
Data availability
All data generated or analysed during this study are included in this published article.
Competing interests
The authors declare no competing interests.
Ethics approval and consent to participate
We all declare that manuscript reporting studies do not involve any human participants, human data, or human tissue. So, it is not applicable. Experimental research and field studies on plants (either cultivated or wild), including the collection of plant material, must comply with relevant institutional, national, and international guidelines and legislation. We confirmed that all methods were performed in accordance with the relevant guidelines/regulations/legislation.
Footnotes
Publisher's note
Springer Nature remains neutral with regard to jurisdictional claims in published maps and institutional affiliations.
Contributor Information
Abdullah Ehsan, Email: abdullahehsanbzu1@gmail.com.
Rahul Datta, Email: rahulmedcure@gmail.com.
References
- 1.Singh, A. Soil salinity: A global threat to sustainable development. Soil Use Manag.38, 39–67 (2022). [Google Scholar]
- 2.Alayafi, A. H. Effect of Irrigation Water Salinity and Silicon Application on Yield of Maize (Zea mays L.) and Water Use Efficiency Under Trickle Irrigation System (King Abdulaziz University, 2022). [Google Scholar]
- 3.Rafay, M. & Usman, M. Soil salinity hinders plant growth and development and its remediation—A review. J. Agric. Res61, 189–200 (2023). [Google Scholar]
- 4.Hasanuzzaman, M. & Fujita, M. Plant responses and tolerance to salt stress: Physiological and molecular interventions. Int. J. Mol. Sci.23, 4810 (2022). [DOI] [PMC free article] [PubMed] [Google Scholar]
- 5.Shahbaz, M. et al. Anticancer, antioxidant, ameliorative and therapeutic properties of kaempferol. Int. J. Food Prop.26, 1140–1166 (2023). [Google Scholar]
- 6.Chen, W. et al. Competition between anthocyanin and kaempferol glycosides biosynthesis affects pollen tube growth and seed set of Malus. Hortic. Res.8, 173 (2021). [DOI] [PMC free article] [PubMed] [Google Scholar]
- 7.Tajner-Czopek, A. et al. Study of antioxidant activity of some medicinal plants having high content of caffeic acid derivatives. Antioxidants9, 412 (2020). [DOI] [PMC free article] [PubMed] [Google Scholar]
- 8.Vocciante, M., Grifoni, M., Fusini, D., Petruzzelli, G. & Franchi, E. The role of plant growth-promoting rhizobacteria (PGPR) in mitigating plant’s environmental stresses. Appl. Sci.12, 1231 (2022). [Google Scholar]
- 9.Basu, A. et al. Plant growth promoting rhizobacteria (PGPR) as green bioinoculants: Recent developments, constraints, and prospects. Sustainability13, 1140 (2021). [Google Scholar]
- 10.Singh, B. P., Singh, B. & Lal, M. K. Seven decades of potato research in India: Achievements and future thrusts. Int. J. Innov. Hortic.11, 158–183 (2022). [Google Scholar]
- 11.Kharumnuid, P. et al. Potato production for nutritional security and doubling farmers income. J. Pharmacogn. Phytochem.10, 193–197 (2021). [Google Scholar]
- 12.Devaux, A. et al. The potato of the future: Opportunities and challenges in sustainable agri-food systems. Potato Res.64, 681–720 (2021). [DOI] [PMC free article] [PubMed] [Google Scholar]
- 13.Page, A. L., Miller, R. H. & Keeny, D. R. Soil pH and lime requirement. In Methods of Soil Analysis: Part 2 Chemical and Microbiological Properties, 9.2.2/Agronomy Monographs (ed. Page, A. L.) 199–208 (American Society of Agronomy, Inc. and Soil Science Society of America, Inc., 1983). 10.2134/agronmonogr9.2.2ed. [Google Scholar]
- 14.Estefan, G., Sommer, R. & Ryan, J. Methods of Soil, Plant, and Water Analysis: A Manual for the West Asia and North Africa Region (International Center for Agricultural Research in the Dry Areas (ICARDA), 2013). [Google Scholar]
- 15.Rhoades, J. D. Salinity: Electrical conductivity and total dissolved solids. In Methods of Soil Analysis, Part 3, Chemical Methods Vol. 5 (eds Sparks, D. L. et al.) 417–435 (Soil Science Society of America, 1996). [Google Scholar]
- 16.Nelson, D. W. & Sommers, L. E. Total carbon, organic carbon, and organic matter. In Methods of Soil Analysis: Part 2 Chemical and Microbiological Properties (ed. Page, A. L.) 539–579 (American Society of Agronomy, Crop Science Society of America, and Soil Science Society of America, 1982). [Google Scholar]
- 17.Gee, G. W. & Bauder, J. W. Particle-size analysis. In Methods of Soil Analysis. Part 1. Physical and Mineralogical Methods (ed. Klute, A.) 383–411 (Wiley, 2018). 10.2136/sssabookser5.1.2ed.c15. [Google Scholar]
- 18.Donald, A. H. & Hanson, D. Determination of potassium and sodium by flame emmision spectrophotometery. In Handbook of Reference Methods for Plant Analysis (ed. Kalra, Y.) 153–155 (CRC Press, 1998). [Google Scholar]
- 19.Pratt, P. F. Potassium. In Methods of Soil Analysis, Part 2: Chemical and Microbiological Properties (ed. Norman, A. G.) 1022–1030 (Wiley, 2016). 10.2134/agronmonogr9.2.c20. [Google Scholar]
- 20.Bremner, M. Nitrogen-total. In Methods of Soil Analysis Part 3. Chemical Methods-SSSA Book Series 5 (eds Sumner, D. L. et al.) 1085–1121 (Wiley, 1996). [Google Scholar]
- 21.Kuo, S. Phosphorus. In Methods of Soil Analysis Part 3: Chemical Methods (eds Sparks, D. L. et al.) 869–919 (Wiley, 2018). 10.2136/sssabookser5.3.c32. [Google Scholar]
- 22.Dworkin, M. & Foster, J. W. Experiments with some microorganisms which utilize ethane and hydrogen. J. Bacteriol.75, 592–603 (1958). [DOI] [PMC free article] [PubMed] [Google Scholar]
- 23.Ahmad, I. et al. Cadmium-tolerant bacteria induce metal stress tolerance in cereals. Environ. Sci. Pollut. Res.21, 11054–11065 (2014). [DOI] [PubMed] [Google Scholar]
- 24.Arnon, D. I. Copper enzymes in isolated chloroplasts, polyphenoloxidase in beta vulgaris. Plant Physiol.24, 1–15 (1949). [DOI] [PMC free article] [PubMed] [Google Scholar]
- 25.Yemm, E. W. & Willis, A. J. The estimation of carbohydrates in plant extracts by anthrone. Biochem. J.57, 508–514 (1954). [DOI] [PMC free article] [PubMed] [Google Scholar]
- 26.Racusen, D. & Johnstone, D. B. Estimation of protein in cellular material. Nature191, 492–493 (1961). [DOI] [PubMed] [Google Scholar]
- 27.Nazar, R., Khan, M. I. R., Iqbal, N., Masood, A. & Khan, N. A. Involvement of ethylene in reversal of salt-inhibited photosynthesis by sulfur in mustard. Physiol. Plant152, 331–344 (2014). [DOI] [PubMed] [Google Scholar]
- 28.Dhindsa, R. S., Plumb-Dhindsa, P. L. & Reid, D. M. Leaf senescence and lipid peroxidation: Effects of some phytohormones, and scavengers of free radicals and singlet oxygen. Physiol. Plant56, 453–457 (1982). [Google Scholar]
- 29.Hori, M. et al. Changes in the hepatic glutathione peroxidase redox system produced by coplanar polychlorinated biphenyls in Ah-responsive and-less-responsive strains of mice: Mechanism and implications for toxicity. Environ. Toxicol. Pharmacol.3, 267–275 (1997). [DOI] [PubMed] [Google Scholar]
- 30.Aebi, H. Catalase in vitro. In Oxygen Radicals in Biological Systems: Methods in Enzymology Vol. 105 (ed. Packer, L.) 121–126 (Elsevier, 1984). [Google Scholar]
- 31.Jiang, M. & Zhang, J. Effect of abscisic acid on active oxygen species, antioxidative defence system and oxidative damage in leaves of maize seedlings. Plant Cell Physiol.42, 1265–1273 (2001). [DOI] [PubMed] [Google Scholar]
- 32.Azab, E. M. A. Performance of Catharanthus roseus plants in response to gamma irradiation. Soc. Adv. Sci.33(1), 130–140 (2016). [Google Scholar]
- 33.Azab, E. & Soror, A. S. Physiological behavior of the aquatic plant Azolla sp. in response to organic and inorganic fertilizers. Plants9, 924 (2020). [DOI] [PMC free article] [PubMed] [Google Scholar]
- 34.Murphy, J. & Riley, J. P. A modified single solution method for the determination of phosphate in natural waters. Anal. Chim. Acta27, 31–36 (1962). [Google Scholar]
- 35.Bovay, E. & Cossy, A. Determination of potassium, calcium, magnesium, and sodium in flashed vegetable material by flame spectrophotometry. Mitt. Geb. Lebensmitt. Hyg.46, 540–568 (1955). [PubMed] [Google Scholar]
- 36.OriginLab Corporation. OriginPro. (OriginLab, Northampton, MA, USA., 2021).
- 37.Chourasia, K. N. et al. Salinity stress in potato: Understanding physiological, biochemical and molecular responses. Life11, 545 (2021). [DOI] [PMC free article] [PubMed] [Google Scholar]
- 38.Sanwal, S. K. et al. Salinity stress tolerance in potato cultivars: Evidence from physiological and biochemical traits. Plants11, 1842 (2022). [DOI] [PMC free article] [PubMed] [Google Scholar]
- 39.Carillo, P. et al. Salinity stress and salt tolerance. Abiotic Stress Plants Mech. Adapt.1, 21–38 (2011). [Google Scholar]
- 40.Nouha, K. et al. Physiological and biochemical responses in Mediterranean saltbush (Atriplex halimus L., Amaranthaceae Juss.) to heavy metal pollution in arid environment. Pak. J. Bot.56, 1717–1726 (2024). [Google Scholar]
- 41.Iftikhar, N. & Perveen, S. Riboflavin (vitamin B2) priming modulates growth, physiological and biochemical traits of maize (Zea mays L.) under salt stress. Pak. J. Bot.56, 1209–1224 (2024). [Google Scholar]
- 42.Hamdi, J., Kmeli, N., Bettaieb, I. & Bouktila, D. Genome-wide analysis of bZIP family genes identifies their structural diversity, evolutionary patterns and expression profiles in response to salt stress in sugar beet. Pak. J. Bot.56, 477–489 (2024). [Google Scholar]
- 43.Hussain, S. S. et al. Salt tolerance in maize with melatonin priming to achieve sustainability in yield on salt affected soils. Pak. J. Bot.55, 19–35 (2023). [Google Scholar]
- 44.Albaqami, M. Salt-induced systemic Ca2+ signal regulates pre-mRNA splicing in Arabidopsis thaliana. Pak. J. Bot.55, 453–458 (2023). [Google Scholar]
- 45.Melino, V. & Tester, M. Salt-tolerant crops: Time to deliver. Annu. Rev. Plant Biol.74, 671–696 (2023). [DOI] [PubMed] [Google Scholar]
- 46.Felice, M. R., Maugeri, A., De Sarro, G., Navarra, M. & Barreca, D. Molecular pathways involved in the anti-cancer activity of flavonols: A focus on myricetin and kaempferol. Int. J. Mol. Sci.23, 4411 (2022). [DOI] [PMC free article] [PubMed] [Google Scholar]
- 47.Huang, R. et al. Caffeic acid enhances storage ability of apple fruit by regulating fatty acid metabolism. Postharvest. Biol. Technol.192, 112012 (2022). [Google Scholar]
- 48.Linić, I. et al. Ferulic acid and salicylic acid foliar treatments reduce short-term salt stress in Chinese cabbage by increasing phenolic compounds accumulation and photosynthetic performance. Plants10, 2346 (2021). [DOI] [PMC free article] [PubMed] [Google Scholar]
- 49.Jayakannan, M., Bose, J., Babourina, O., Rengel, Z. & Shabala, S. Salicylic acid improves salinity tolerance in Arabidopsis by restoring membrane potential and preventing salt-induced K+ loss via a GORK channel. J. Exp. Bot.64, 2255–2268 (2013). [DOI] [PMC free article] [PubMed] [Google Scholar]
- 50.Khan, N. A., Syeed, S., Masood, A., Nazar, R. & Iqbal, N. Application of salicylic acid increases contents of nutrients and antioxidative metabolism in mungbean and alleviates adverse effects of salinity stress. Int. J. Plant Biol.1, e1 (2010). [Google Scholar]
- 51.Farhangi-Abriz, S. & Ghassemi-Golezani, K. How can salicylic acid and jasmonic acid mitigate salt toxicity in soy bean plants? Ecotoxicol. Environ. Saf. 147, 1010-1016 (2018). [DOI] [PubMed] [Google Scholar]
- 52.Huang, R. et al. Caffeic acid regulated respiration, ethylene and reactive oxygen species metabolism to suppress senescence of Malus domestica. Postharvest. Biol. Technol.194, 112074 (2022). [Google Scholar]
- 53.Arikan, B., Yildiztugay, E. & Ozfidan-Konakci, C. Protective role of quercetin and kaempferol against oxidative damage and photosynthesis inhibition in wheat chloroplasts under arsenic stress. Physiol. Plant175, e13964 (2023). [DOI] [PubMed] [Google Scholar]
- 54.Zafar-ul-Hye, M., Nawaz, M. S., Asghar, H., Waqas, M. & Mahmood, F. Caffeic acid helps to mitigate adverse effects of soil salinity and other abiotic stresses in legume. J. Genet. Genom.4(1), 1-6 (2020). [Google Scholar]
- 55.Mehmood, H. et al. Assessing the potential of exogenous caffeic acid application in boosting wheat (Triticum aestivum L.) crop productivity under salt stress. PLoS ONE16, e0259222 (2021). [DOI] [PMC free article] [PubMed] [Google Scholar]
- 56.Marchiosi, R. et al. Biosynthesis and metabolic actions of simple phenolic acids in plants. Phytochem. Rev.19, 865–906 (2020). [Google Scholar]
- 57.Nie, F. et al. Kaempferol promotes proliferation and osteogenic differentiation of periodontal ligament stem cells via Wnt/β-catenin signaling pathway. Life Sci.258, 118143 (2020). [DOI] [PubMed] [Google Scholar]
Associated Data
This section collects any data citations, data availability statements, or supplementary materials included in this article.
Data Availability Statement
All data generated or analysed during this study are included in this published article.


