Abstract
We present novoRNABreak, a unified framework for cancer specific novel splice junction and fusion transcript detection in RNA-seq data obtained from human cancer samples. novoRNABreak is based on a local assembly model, which offers a tradeoff between the alignment-based and de novo whole transcriptome assembly (WTA) methods. This approach is accurate and sensitive in assembling novel junctions that are difficult to directly align or have multiple alignments. Additionally, it is more efficient due to the strategy that focuses on junctions rather than full length transcripts. The performance of novoRNABreak is demonstrated by a comprehensive set of experiments using synthetic data generated based on genome reference, as well as real RNA-seq data from breast cancer and prostate cancer samples. The results show that our tool has a better performance by fully utilizing unmapped reads and precisely identifying the junctions where short reads or small exons have multiple alignments. novoRNABreak is a fully-fledged program available on GitHub (https://github.com/KChen-lab/novoRNABreak).
Keywords: novoRNABreak, unified framework, local assembly model, cancer specific, novel splice junctions, fusion transcripts
Introduction
Splice junctions are conserved structures in eukaryotic genome that are recognized by RNA splicing machinery. Alternative splicing is one of the reasons for the production of many different transcripts (isoforms) from the same genetic locus. Dysregulation of RNA splicing has been found to be associated with many human diseases [1, 2], and established as one of the hallmarks of cancer [3]. Fusion transcripts, resulting from gene fusion have been reported to be the driver mutations in neoplasia [4], including TMPRSS2-ERG in prostate cancer [5], BCR-ABL1 in chronic myeloid leukemia [6], and EML4-ALK in non-small-cell lung cancer [7]. Thus, the identification of the junctions that provides valuable insights into alternative splicing and gene fusion events is biologically important and can potentially apply to cancer diagnosis, prognosis, and therapy [8].
With the advancement of next-generation sequencing (NGS) technologies, rapid and cheap genome-wide transcriptome analysis makes comprehensive detection of junctions possible. However, most of the available tools for junction detection primarily rely on approaches which directly align paired-end short reads to the genomic refer-ence and identify the junctions from discordant read pairs, such as TopHat [9], Bellerophontes [10], Chimerascan [11], TumorFusions [12], INTEGRATE [13]. Although computationally efficient, alignment-based approaches are fundamentally limited in detecting sequences that are substantially different from the reference, as such are most likely containing novel junctions due to challenges in accurately splitting and aligning short fragments. Moreover, short reads/exons that can be easily error mapped to multiple locations will significantly decrease the accuracy of the pre-dictions. On the other hand, de novo whole transcriptome assembly (WTA) approaches, such as MINTIE [14], KisSplice [15], and TAP [16], which attempt to assemble all reads into a single consensus transcriptome, are computationally intensive and require high sequence coverage to achieve high sensitivity in assembling junctions. In the paper, we developed a new local-assembly-based pipeline to overcome those drawbacks by offering a tradeoff between the alignment-based and the de novo whole transcriptome assembly (WTA) approaches.
In this study, we proposed a local assembly-based framework, called novoRNABreak, which modifies our well-attested genomic structural variation breakpoint assembly tool novoBreak [17] to assemble novel junctions in RNA-seq data. It is a unified framework for novel splice junctions and fusion transcripts detection, which can identify the novel splice junctions and fusion transcript events according to the location of the splicing (one gene or two separate genes). The schematic diagrams of those events are shown in Figure 1 and Figure 2.
Figure 1:
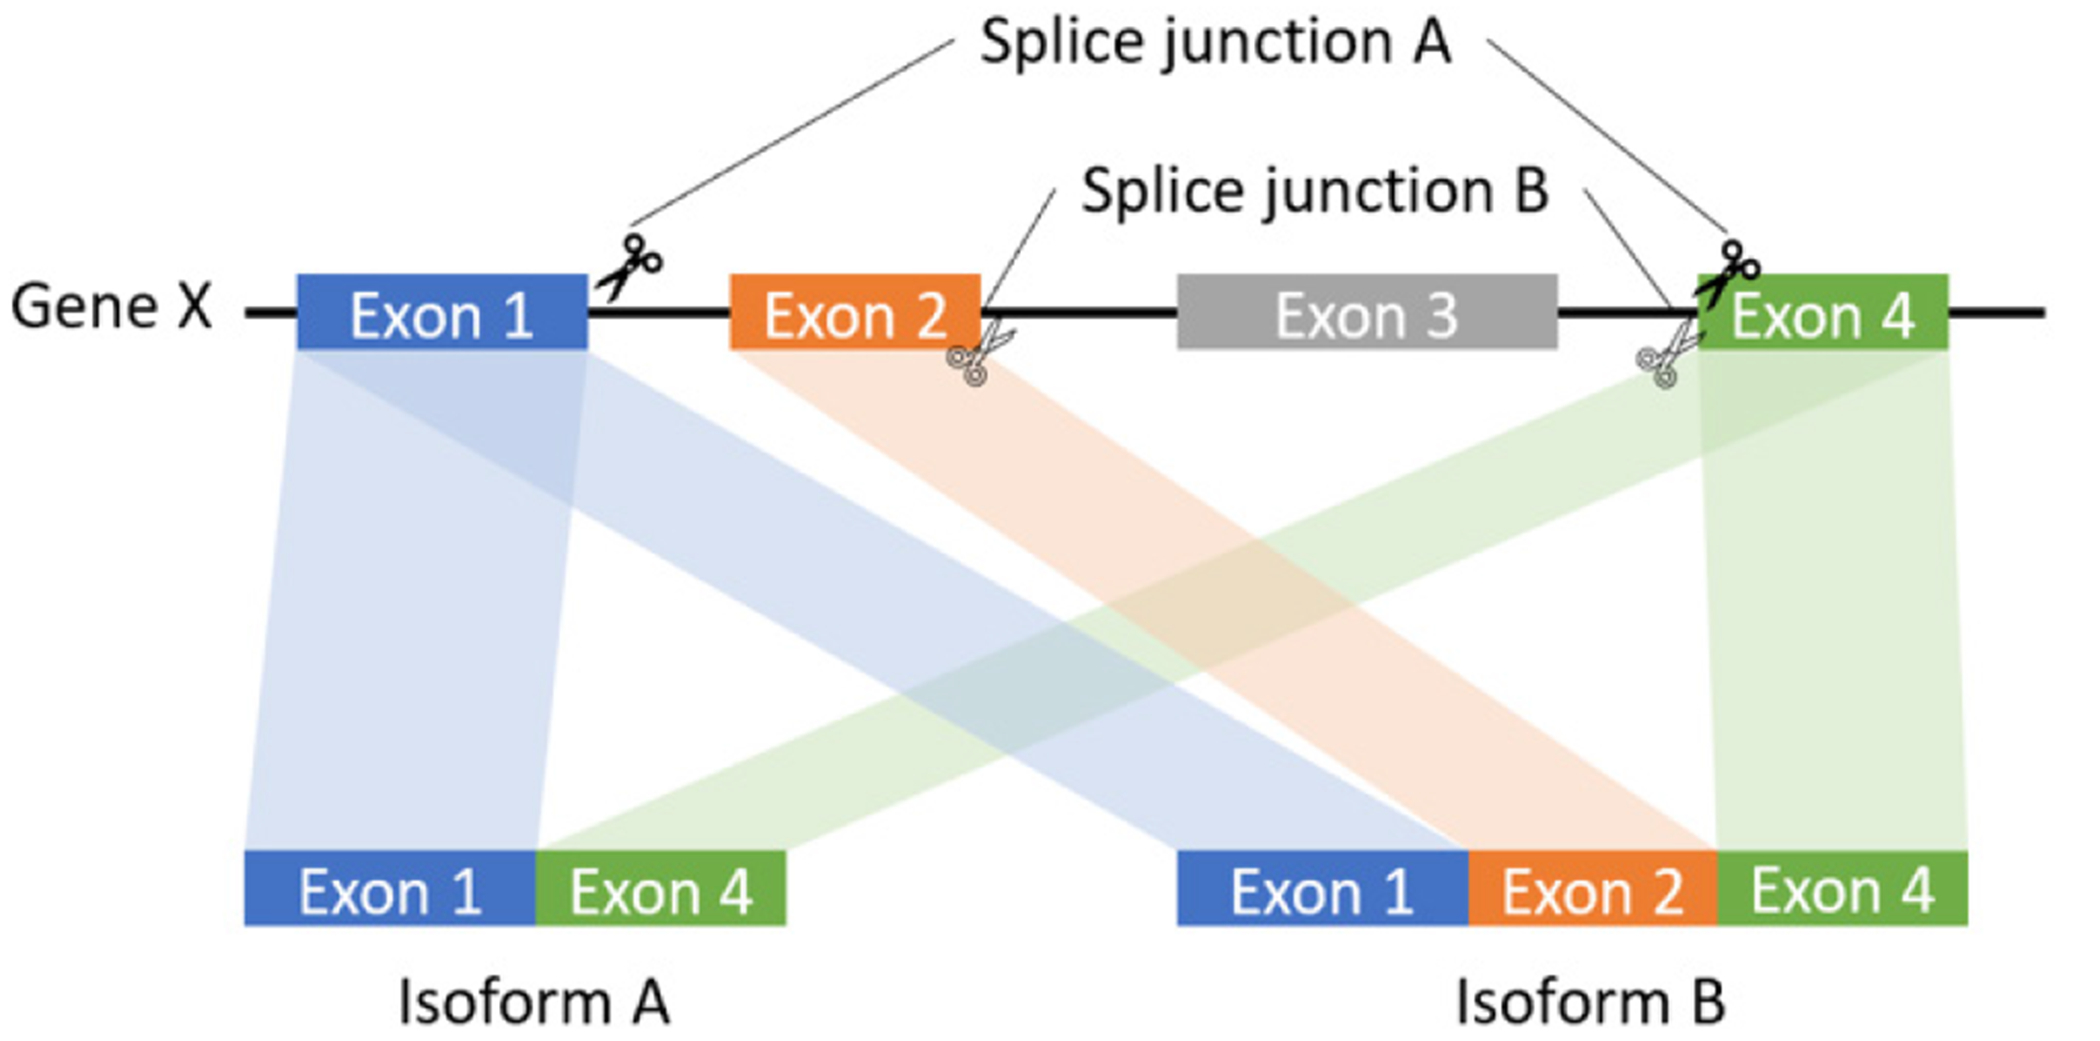
The schematic diagram of splice junction: sequences to aid in the process of removing introns by the RNA splicing machinery of one gene.
Figure 2:
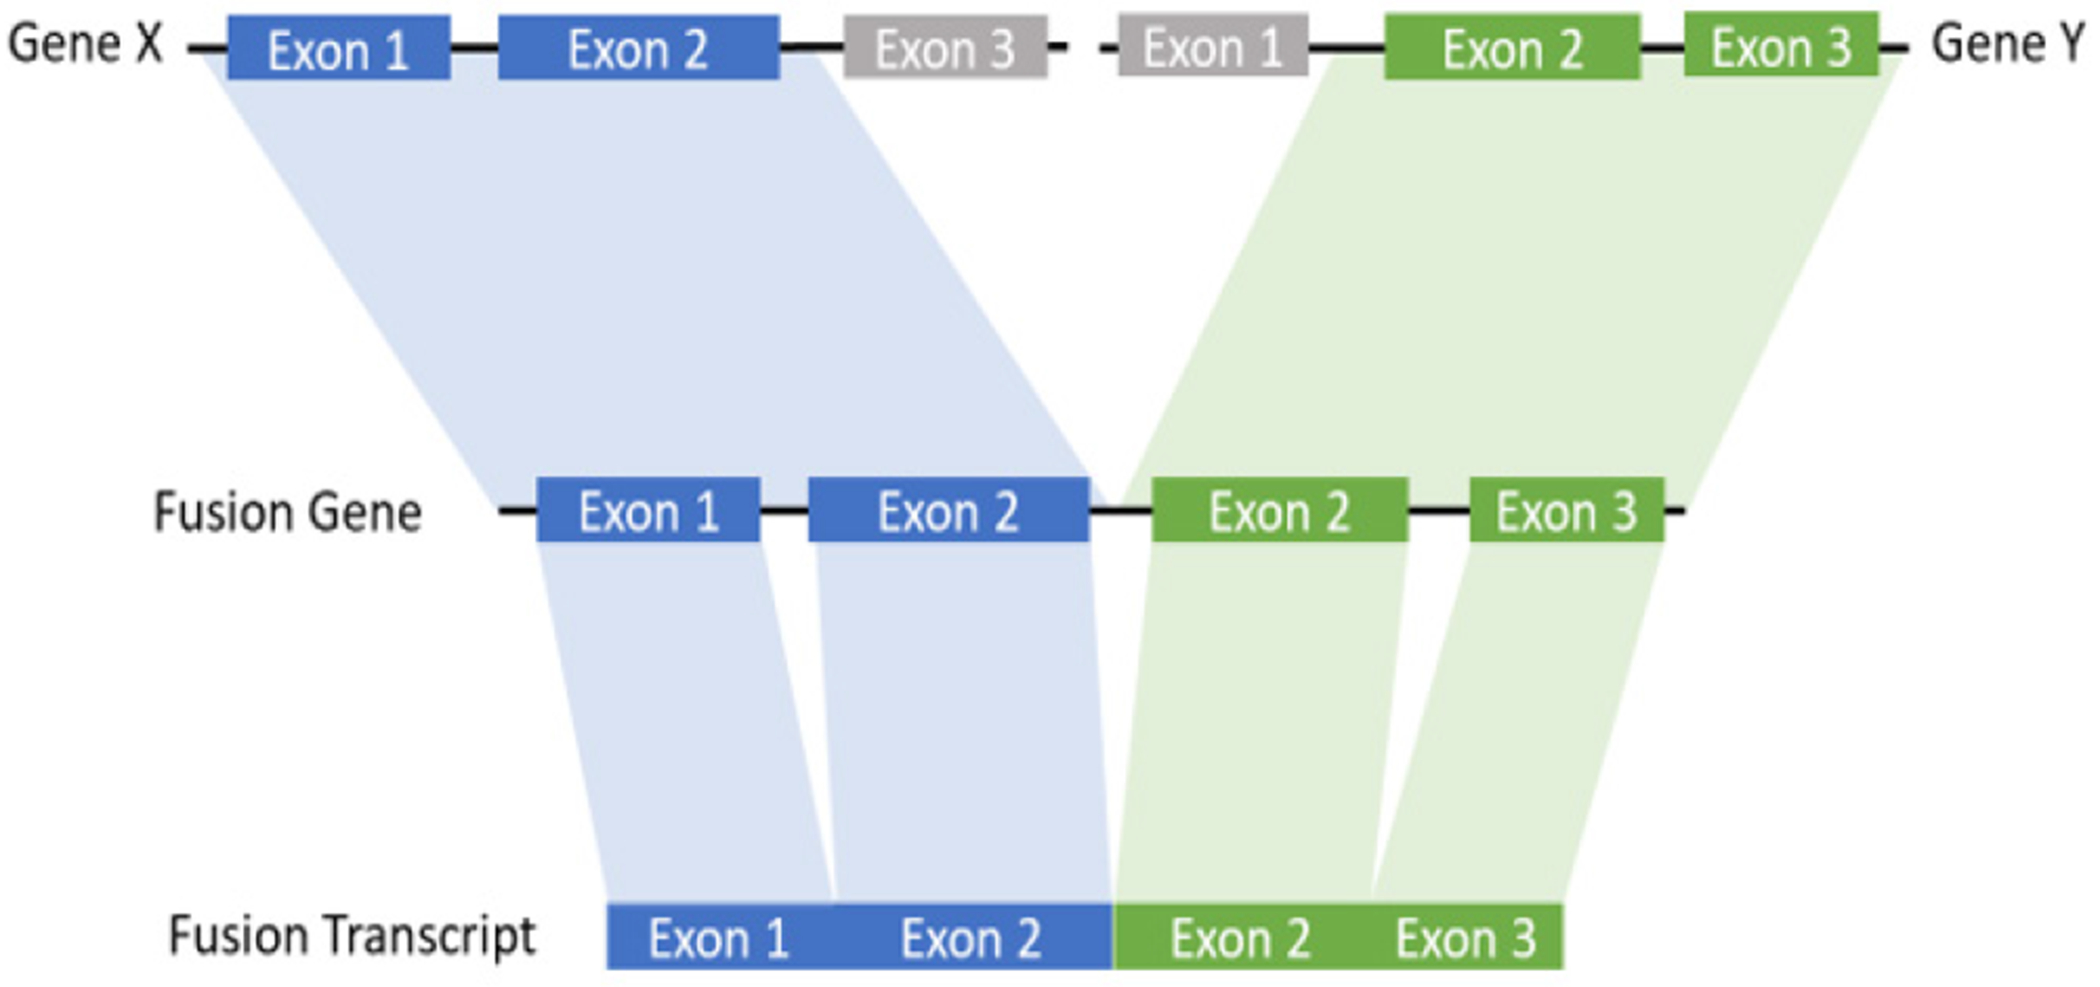
The schematic diagram of fusion transcript: a hybrid RNA is composed of transcripts of two separate genes.
With our k-mer guided local assemble model, our tool can fully use the unaligned sequences which is more sensitive in detecting the junctions that are substantially different from the reference. As we will show in our experiment, more than 90% of the unmapped reads can be aligned confidently as assembled contigs after using our framework, indicating superior sensitivity of our tool in assembling structurally altered sequences in RNA-seq data. In addition, we argue that many alignment-based approaches, e.g., STAR [18], TopHat [9], etc, will produce a high proportion of multiple alignments, particularly for short reads or short exons. This proportion can be significantly reduced by locally assembling the short reads into longer contigs.
The performance of novoRNABreak is demonstrated by a comprehensive set of experiments, including synthetic data generated from the genome reference, as well as real RNA-seq data from breast cancer, and The Cancer Genome Atlas (TCGA) prostate (PRAD) cancer samples. Results show that our tool achieves higher precision by assembling short reads into longer contigs and higher sensitivity by fully using the unmapped reads.
Materials and Methods
Alignment Strategy
novoRNABreak, which modifies our well-attested genomic structural variation breakpoint assembly tool novoBreak, assembles novel junctions from RNA-seq data. Un-like many alignment-based or WTA approach methods in the literature, novoRNABreak consists of 4 steps shown in the Figure 3: First, RNA-seq reads and reference sequences will be decomposed into k-mers. We default to 31 as the k-mer size to achieve a balanced performance [17] and pick standard transcriptome databases such as NCBI RefSeq [19], Ensembl [20] and GENCODE [21] as the reference. Second, novel splice junction k-mers, which are absent in either the reference transcriptome or the normal samples but unique in the tumor RNA-seq reads, will be identified. Third, reads containing novel k-mers will be partitioned into clusters and assembled into sequences contigs using SSAKE [22], meaning that each of the contig contains at least one novel junction. Finally, the assembled contigs, which are now considerably longer than raw reads, are aligned using Burrows-Wheeler Aligner (BWA) [23] or STAR [18]. Based on the alignment, the preliminary candidates of the junctions can be detected.
Figure 3:
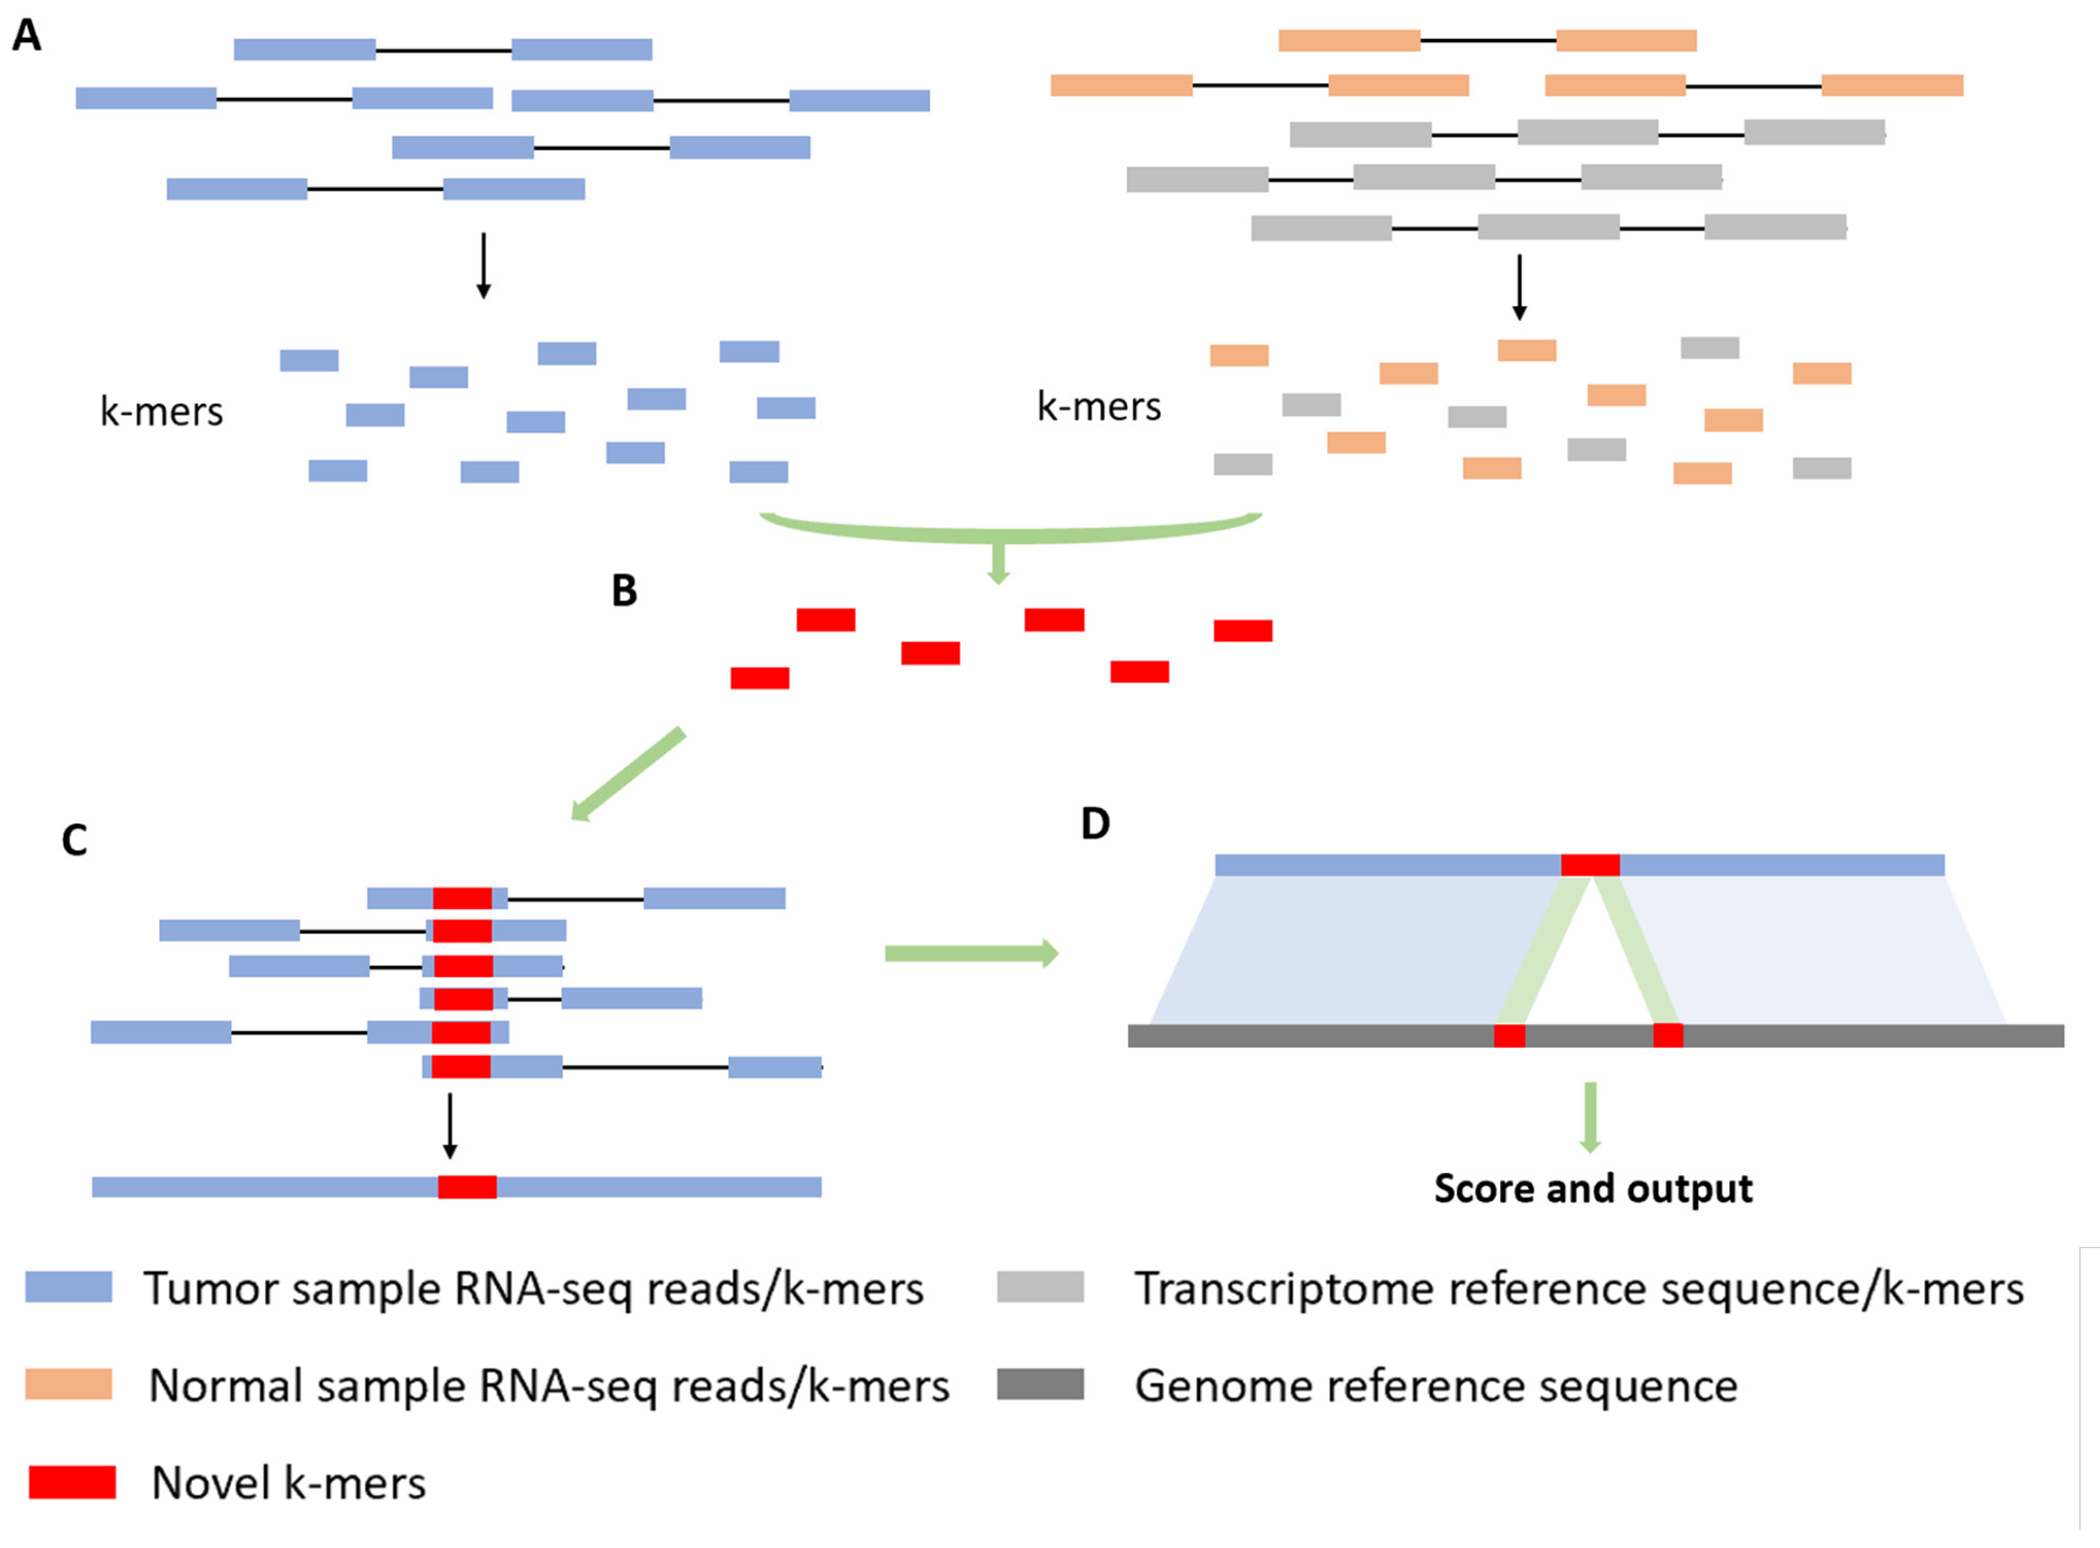
Alignment strategy. (A) Decompose RNA-seq reads and reference into k-mers. (B) Identify novel k-mers from tumor samples compared to normal samples and reference. (C) Partition reads containing novel k-mers into clusters and assemble into contigs. (D) Align against the genomic reference.
Filtering Strategy
As suggested by (24), BWA exhibited the best performance in terms of alignment rate and gene coverage, making it well-suited for our fusion transcription detection mode. However, it’s important to note that certain aligners such as STAR are specifically designed to recognize splice junctions, which makes it the preferred choice for our splicing junction detection mode. In the following sections, we will outline different filtering strategies for these two modes.
Fusion Transcript Filters
The filters used for fusion transcripts, which are applied to the output obtained from the BWA alignment, include: (1) PCR-Artifact filter: It identifies and removes all duplicated reads introduced by the polymerase chain reaction (PCR) amplification process, e.g., Picard tool from Broad Institute [25]. (2) Anchor length filter: Anchor length is the number of nucleotides overlapping each side of the break point and it can provide assurance of quality by removing all the junction-spanning reads having the anchor length lower than a threshold, e.g., 10bp. (3) Quality-Based filter: It uses the mapping quality parameter in the sam/bam file to discard the candidates with the mapping quality lower than a threshold. (4) Junction-Spanning reads filter: It considers the number of reads supporting the detected junctions and deletes the candidates with the number of supporting reads lower than a threshold, e.g., 3 reads, except when the contig is assembled by many short reads (at least 5) and has a high mapping quality (at least 60) at the same time. Note, the filter (1) and filter (4) are based on the actual mapped reads, and the filter (2) and (3) are based on the ensembled contigs. (5) Read-Through transcripts filter. It removes the RNA molecules formed by exons of adjacent genes, usually generated by the RNA-polymerase failing the recognition of the gene end. (6) Homology-Based filter: It is designed to remove the artifacts that are resulting from misalignment of read sequences due to polymorphisms and homology [26–28], e.g., HLA genes. (7) Ribosomal RNA-Based filter: It will remove highly expressed genes that are unlikely to be involved in fusions, such as ribosomal RNA [26, 28]. Note: genes are annotated by ANNOVAR [32].
Splicing Junction Filters
The splicing junction detection process primarily involves the two-pass alignment approach implemented by STAR [29] and the filters include: (1) Junction length filter: We limit the length of the junction in the range of 20 to 1,000,000 bp as this range covers most of the known intron size in eukaryote. (2) Anchor length filter: The same idea with fusion transcript filter to require reads span novel splice junctions by at least 8 nucleotides. (3) Canonical/semi-canonical splice filter: The canonical splice sites are those with “GT” at the donor site, and “AG” at the acceptor site (“GC-AG” and “AT-AC” are called semi-canonical), which covers more than 99% of introns [31]. Candidates lacking canonical or semi-canonical splice sites will be subject to penalties. Candidates possessing “GT-AG” boundaries will be given top priority with-out any penalty, followed by those with “GC-AG” and “AT-AC” boundaries which will incur lower penalties.
Results
In this section, we present the result of a comprehensive set of numerical experiments, using both synthetic and read dataset, to assess the performance of novoRNABreak and compare it against that of other popular methods in the literature.
Experiments with Synthetic Data
We generated three sets of simulated reads (with read length = 50, 75, and 100 bp respectively). For each generated reads at 10, 25, 50, and 80-fold sequencing depths using the BEERS2 toolkit (https://github.com/itmat/BEERS2). In accordance with the findings of previous studies (33), exons ranging in length from 50 to 250 nucleotides have been shown to be optimal for efficient splicing. For our simulation data, we used an exon length of 120 nucleotides in average. Here, we compare our novoRNABreak with STAR (2Pass) (29), Tophat2 (34) and Portcullis (35) algorithms. The comparison results are shown in Figure 4. Sensitivity is calculated by diving the number of true positives by the total number of ground-truth junctions, and precision is equal to the number of true positives divided by the total number of the output junctions of each algorithm. Figure 4 illustrates that novoRNABreak consistently over performs the other tools by a significant margin in terms of precision, especially with shorter reads. This is understandable since the shorter reads/exons are more likely to align to multiple locations, which can lead to false positives in detecting splicing junctions. As a result, novoRNABreak’s ability to identify the splicing junctions with higher precision is particularly useful for the short reads or when the junctions between small exons. Although the sensitivity may be slightly lower than that of STAR and Portcullis, it improves as the sequencing depth increases, bringing it closer to the others after 50-fold, which fall in the range of most real RNA-seq datasets.
Figure 4:
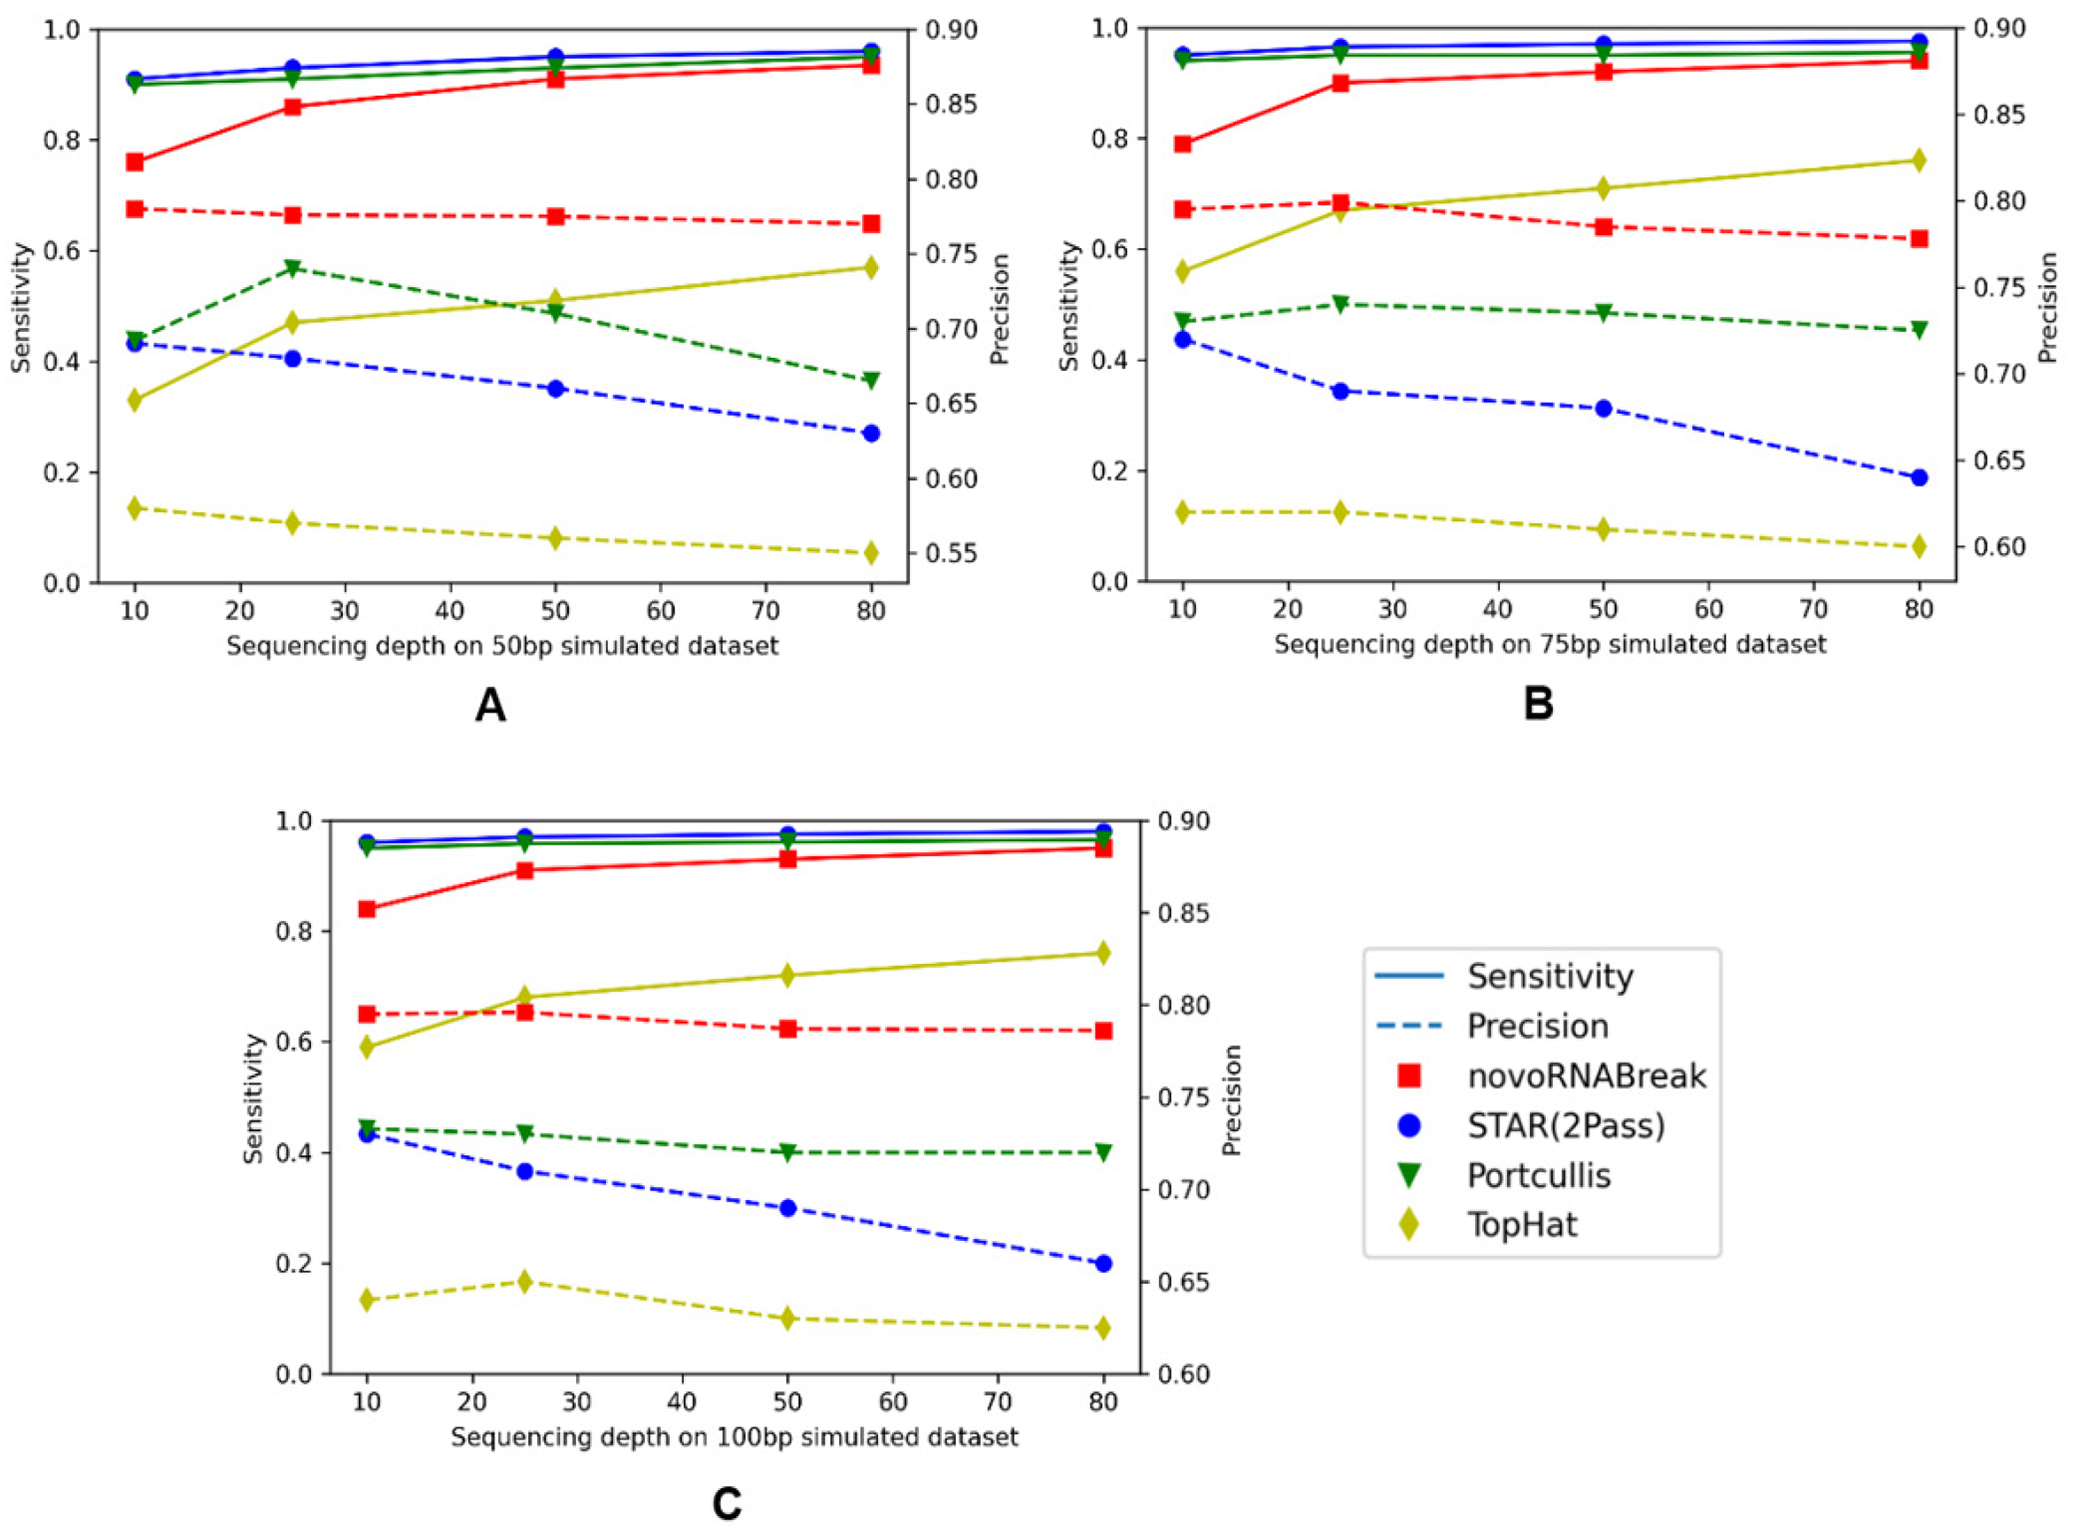
The novel splicing junction comparison among the novoRNABreak, STAR(2Pass), Portcullis, and TopHat algorithms. The x-axis is the sequencing depth and y-axis is the sensitivity(left) and precision(right). For 50bp reads in (A), 75bp reads in (B), and 150bp reads in (C). The points connected by full lines stand for sensitivity and the points connected by the dashed lines stand for precision.
Experiments with Real Data
In this section, we demonstrate the efficacy of our tool using two published real datasets. One is the breast cancer dataset, for which we use the experimentally validated ground-truth of fusion transcripts to evaluate the performance of our fusion transcript detection mode. Another is the TCGA PRAD dataset, and we highlight the advantages of our tool in both the novel splicing junction detection mode and the fusion transcript detection mode by comparing our results with those obtained using other tools.
Breast Cancer Dataset
The breast cancer dataset in this study consists 4 cell lines (BT-474, SK-BR-3, KPL-4, and MCF-7) which can be downloaded from NCBI Sequence Read Archive (SRA) with accession number SRP003186 [36]. There are total 26 experimentally verified fusion events for breast cancer cell lines (The fusion CSE1L-ENSG00000236127 was removed from the list due to the deprecation of ENSG00000236127) [37]. The comparison results are shown in Figure 5,
Figure 5:
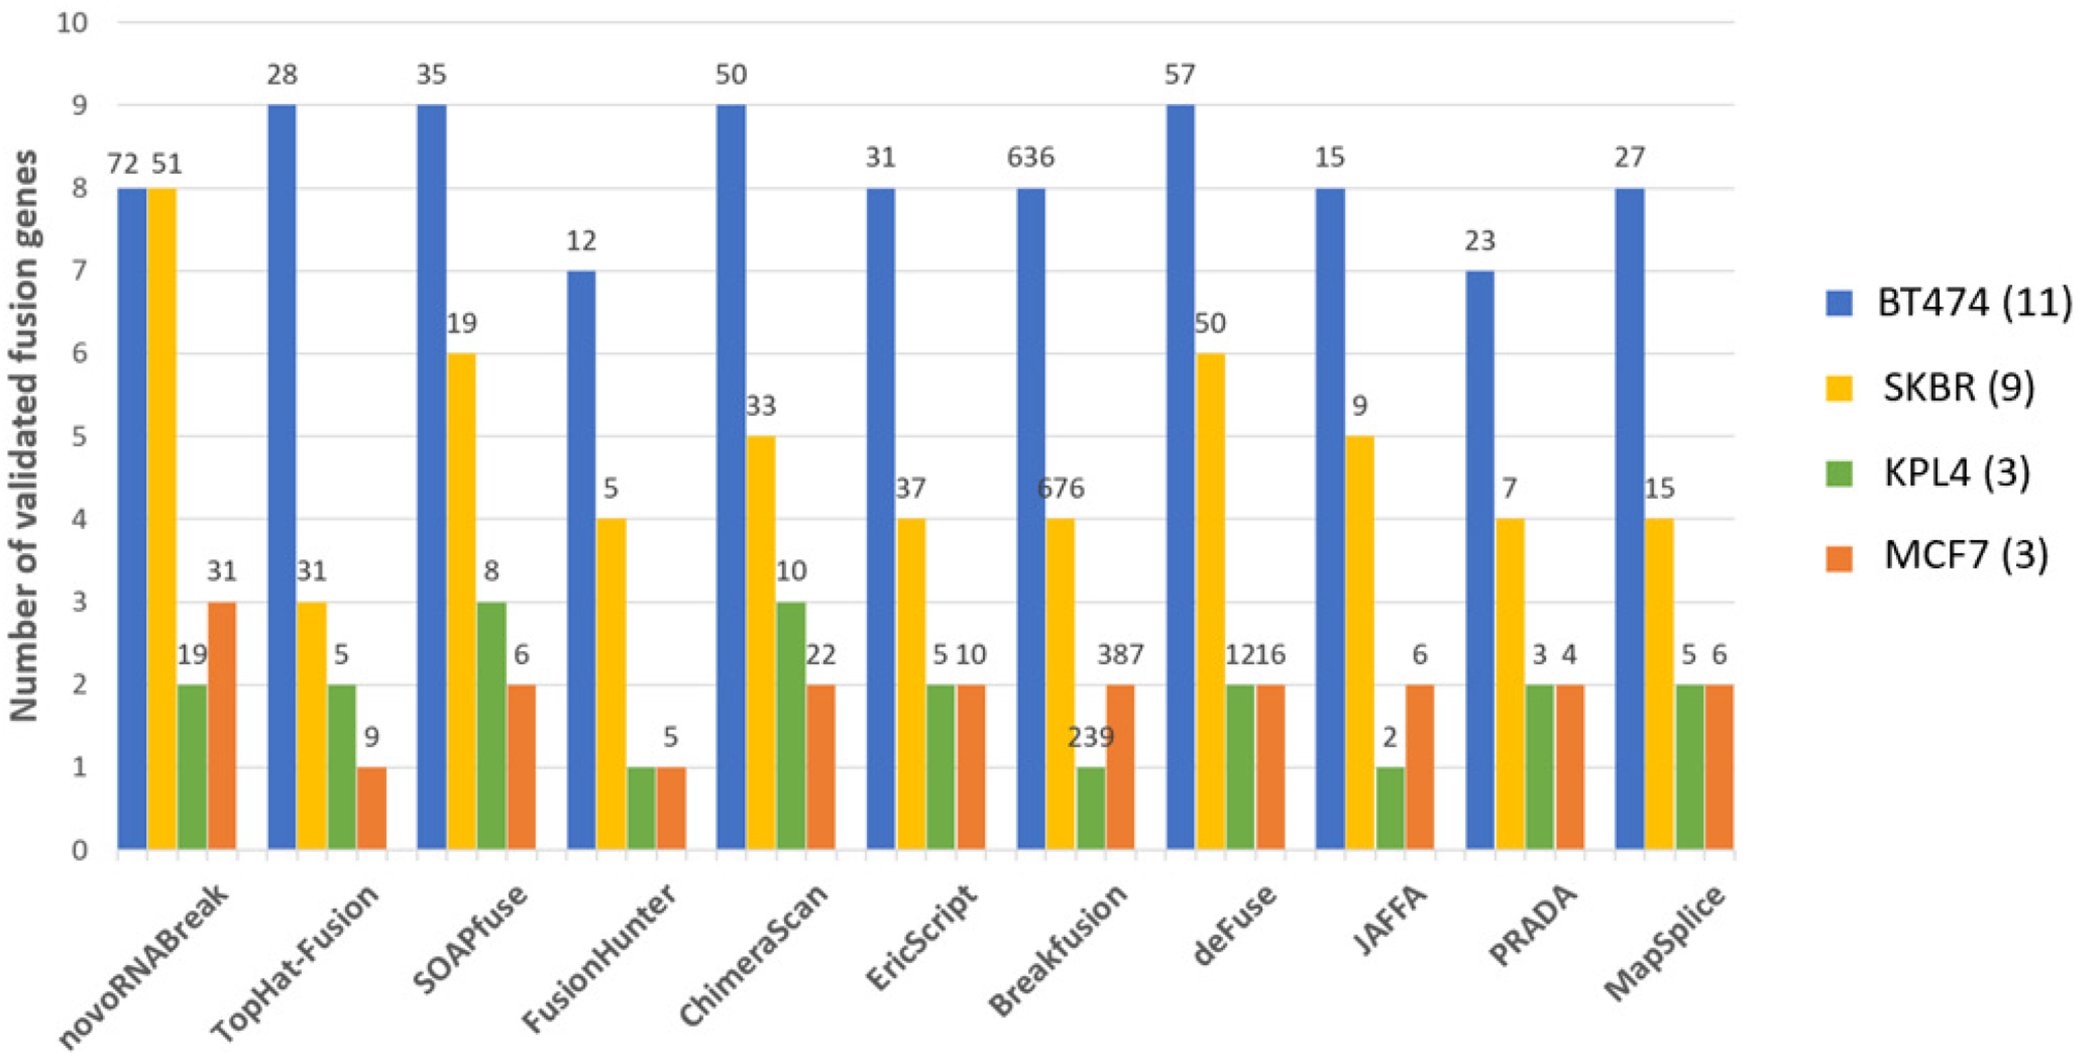
Fusion transcript detection results for the real breast cancer data set. The y-axis bars show the number of true detected positives (benchmarks). The total number of fusion detections re shown on the top of the bar
where the outcomes of other methods [11, 38–46] are picked from the review paper [47]. We can see that our tool detects the most of validated fusion transcript in total, although not the best in every cell line. We can reach a high sensitivity because our method can fully utilize the unmapped data. There are the total of 198,714,026 reads from those 4 cell lines, of which 7,341,176 reads are unmapped (3.7%). By using those unmapped reads only, we assembled 106,574 high-quality contigs, in which 8 true fusion transcripts can be identified and 5 of them passed all the filters (high quality). More importantly, 2 of them have no support from the mapped short reads, meaning that those 2 would theoretically be missed by the alignment-based methods.
TCGA PRAD Dataset
There are 499 tumor samples and 53 non-neoplastic samples in the TCGA PRAD dataset. As explained in [12], non-neoplastic samples in TCGA are frequently obtained through tissue biopsy adjacent to the location of the cancer which have the risk of being contaminated with tumor cells. We identified 7 out of 53 non-neoplastic samples as true normal using unsupervised clustering. With those normal samples, our tool can directly deliver the cancer specific novel junctions and fusion transcripts.
To assess the performance of our tool, we first applied the novel splicing junction detection mode to the dataset. As we lack ground-truth information, we evaluated our tool’s advantage based on the rate of multiple alignments. Directly aligning the data using STAR resulted in an average of 28.7% multiple alignments with a standard deviation of approximately 0.09. However, after using novoRNABreak (local assembly process), the proportion of multiple alignments decreased to an average of 19.8% with a standard deviation of 0.07. We anticipate that with sufficient coverage, our tool can produce more accurate results, as demonstrated in our synthetic experiment.
Conclusion
Here we present a unified framework for identifying tumor specific novel canonical splicing junctions and novel fusion transcripts from RNA-seq data. Our results suggest that our tool has a better performance by fully utilizing unmapped reads and precisely identifying the junctions when short reads or small exons have multiple alignments. Furthermore, the novel events detected from our method will improve our understanding of cancer mechanisms and facilitate discovery of new targets and development of RNA-based therapies.
Supplementary Material
Table 1:
Fusion events comparison between novoRNABreak, INTEGRATE, and TumorFusions.
| Fusion genes | novoBreak-rna | INTEGRATE | TumorFusions |
|---|---|---|---|
| TMPRSS2-ERG | ✓ | ✓ | ✓ |
| SLC45A3-ERG | ✓ | ✓ | ✓ |
| TMPRSS2-ETV4 | ✓ | ✓ | ✓ |
| TMPRSS2-ETV1 | ✓ | ✓ | ✓ |
| SLC45A3-ETV1 | ✓ | ✓ | ✓ |
| KLK2-FGFR2 | ✓ | ✓ | |
| TMPRSS2-ETV5 | ✓ | ✓ | |
| NDRG1-ERG | ✓ | ✓ | |
| ACER3-B3GNT6 | ✓ | ||
| KLK2-ETV1 | ✓ | ||
| ACPP-SKIL | ✓ |
Acknowledgement
This project has been made possible in part by the National Cancer Institute Informatics Technology for Cancer Research [U01CA247760 to KC], the Cancer Prevention & Research Institute of Texas [RP180248 to KC], the National Cancer Institute Cancer Center Support [P30 CA016672 to PP], the National Institute of General Medical Sciences [1R35GM138212 to ZC] and the National Human Genome Re-search Institute [U24-HG-007497 to CL].
Footnotes
Conflict of Interest
The authors declare that they have no competing interests.
Supplementary Material
Supplementary Data are available online.
References
- 1.Wang H, Hubbell E, Hu J, et al. Gene structure-based splice variant de convolution using a microarray platform. Bioinforma. Oxf. Engl 19 (2003): 15–322. [DOI] [PubMed] [Google Scholar]
- 2.Nagao K, Togawa N, Fujii K, et al. Detecting tissue-specific alternative splicing and disease-associated aberrant splicing of the PTCH gene with exon junction microarrays. Hum. Mol. Genet 14 (2005): 3379–3388. [DOI] [PubMed] [Google Scholar]
- 3.Urbanski L, Leclair N, and Anczuków O. Alternative-splicing defects in cancer: splicing regulators and their downstream targets, guiding the way to novel cancer therapeutics. Wiley Interdiscip. Rev. RNA 9 (2018): e1476. [DOI] [PMC free article] [PubMed] [Google Scholar]
- 4.Gao Q, Liang WW, Foltz SM, et al. Driver Fusions and Their Implications in the Development and Treatment of Human Cancers. Cell Rep 23 (2018): 227–238.e3. [DOI] [PMC free article] [PubMed] [Google Scholar]
- 5.Tomlins SA, Rhodes DR, Perner S, et al. Recurrent Fusion of TMPRSS2 and ETS Transcription Factor Genes in Prostate Cancer. Science 310 (2005): 644–648. [DOI] [PubMed] [Google Scholar]
- 6.Barnes DJ and Melo JV. Cytogenetic and molecular genetic aspects of chronic myeloid leukaemia. Acta Haematol 108(2002): 180–202. [DOI] [PubMed] [Google Scholar]
- 7.Soda M, Choi YL, Enomoto M, et al. Identification of the transforming EML4-ALK fusion gene in non-small-cell lung cancer. Nature 448(2007): 561–566. [DOI] [PubMed] [Google Scholar]
- 8.Hong Y, Kim WJ, Bang CY, et al. Identification of Alternative Splicing and Fusion Transcripts in Non-Small Cell Lung Cancer by RNA Sequencing. Tuberc. Respir. Dis 79(2016): 85–90. [DOI] [PMC free article] [PubMed] [Google Scholar]
- 9.Trapnell C, Pachter L and Salzberg SL. TopHat: discovering splice junctions with RNA-Seq. Bioinformatics 25(2009): 1105–1111. [DOI] [PMC free article] [PubMed] [Google Scholar]
- 10.Abate F, Acquaviva A, Paciello G, et al. Beller-ophontes: an RNA-Seq data analysis framework for chimeric transcripts discovery based on accurate fusion model. Bioinformatics 28(2012): 2114–2121. [DOI] [PubMed] [Google Scholar]
- 11.Iyer MK, Chinnaiyan AMandMaher CA. ChimeraScan: a tool for iden-tifying chimeric transcription in sequencing data. Bioinformatics 27(2011): 2903–2904. [DOI] [PMC free article] [PubMed] [Google Scholar]
- 12.Hu X, Wang Q, Tang M, et al. TumorFusions: an integrative resource for cancer-associated transcript fusions. Nucleic Acids Res 46 (2018): D1144–D1149. [DOI] [PMC free article] [PubMed] [Google Scholar]
- 13.Zhang J, White NM, Schmidt HK, et al. INTEGRATE: gene fusion discovery using whole genome and transcriptome data. Genome Res 26 (2016): 108–118. [DOI] [PMC free article] [PubMed] [Google Scholar]
- 14.Cmero M, Schmidt B, Majewski IJ, et al. MINTIE: identifying novel structural and splice variants in transcrip-tomes using RNA-seq data. Genome Biol 22 (2021): 296. [DOI] [PMC free article] [PubMed] [Google Scholar]
- 15.Sacomoto GA, Kielbassa J, Chikhi R, et al. KISSPLICE: de-novo calling alternative splicing events from RNA-seq data. BMC Bioinformatics 13(2012): S5. [DOI] [PMC free article] [PubMed] [Google Scholar]
- 16.Chiu R, Nip KM, Chu J. TAP: a targeted clinical genomics pipeline for detecting transcript variants using RNA-seq data. BMC Med. Ge-nomics 11(2018): 79. [DOI] [PMC free article] [PubMed] [Google Scholar]
- 17.Chong Z, Ruan J, Gao M, et al. novoBreak: local assembly for breakpoint detection in cancer genomes. Nat. Methods 14(2017): 65–67. [DOI] [PMC free article] [PubMed] [Google Scholar]
- 18.Dobin A, David CA, Schlesinger F, et al. STAR: ultrafast universal RNA-seq aligner. Bioinformatics 29(2013): 15–21. [DOI] [PMC free article] [PubMed] [Google Scholar]
- 19.Pruitt KD, Brown GR, Hiatt SM, et al. Ref-Seq: an update on mammalian reference sequences. Nucleic Acids Res 42(2014): D756–D763. [DOI] [PMC free article] [PubMed] [Google Scholar]
- 20.Flicek P, Amode MR, Barrell D, et al. Ensembl 2014. Nucleic Acids Res 42(2014): D749–D755. [DOI] [PMC free article] [PubMed] [Google Scholar]
- 21.Harrow J, Frankish A, Gonzalez JM, et al. GENCODE: The ref-erence human genome annotation for The ENCODE Project. Genome Res 22(2012): 1760–1774. [DOI] [PMC free article] [PubMed] [Google Scholar]
- 22.Warren RL, Sutton GG, Jones SJM, et al. Assembling millions of short DNA sequences using SSAKE. Bioinforma. Oxf. Engl 23(2007): 500–501. [DOI] [PMC free article] [PubMed] [Google Scholar]
- 23.Li H and Durbin R. Fast and accurate short read alignment with Burrows–Wheeler transform. Bioinformatics 25(2009): 1754–1760. [DOI] [PMC free article] [PubMed] [Google Scholar]
- 24.Musich R, Cadle-Davidson L and Osier MV. Comparison of Short-Read Sequence Aligners Indicates Strengths and Weaknesses for Biologists to Consider. Front. Plant Sci 12(2021). [DOI] [PMC free article] [PubMed] [Google Scholar]
- 25.Broad Institute. Picard Tools, GitHub Repository 10 (2018) [Google Scholar]
- 26.Maher CA, Palanisamy N, Brenner JC, et al. Chimeric transcript discovery by paired-end transcriptome sequencing. Proc. Natl. Acad. Sci 106 (2009): 12353–12358. [DOI] [PMC free article] [PubMed] [Google Scholar]
- 27.Yoshihara K, Wang Q, Torres-Garcia W, et al. The landscape and therapeutic relevance of cancer-associated transcript fusions. Oncogene 34 (2015): 4845–4854. [DOI] [PMC free article] [PubMed] [Google Scholar]
- 28.Conesa A, Madrigal P, Tarazona S, et al. A survey of best practices for RNA-seq data analysis. Genome Biol 17(2016): 13. [DOI] [PMC free article] [PubMed] [Google Scholar]
- 29.Veeneman BA, Shukla S, Dhanasekaran SM, et al. Two-pass alignment improves novel splice junction quantification. Bioinformatics 32(2016): 43–49. [DOI] [PMC free article] [PubMed] [Google Scholar]
- 30.Huang S, Zhang J, Li R, et al. SOAPsplice: Genome-Wide ab initio Detection of Splice Junctions from RNA-Seq Data. Front. Genet 2(2011). [DOI] [PMC free article] [PubMed] [Google Scholar]
- 31.Burset M, Seledtsov IA and Solovyev VV. Analysis of canonical and non-canonical splice sites in mammalian genomes. Nucleic Acids Res 28(2000): 4364–4375. [DOI] [PMC free article] [PubMed] [Google Scholar]
- 32.Wang K, Li M and Hakonarson H. ANNOVAR: functional annotation of genetic variants from high-throughput sequencing data. Nucleic Acids Res 38(2010): e164. [DOI] [PMC free article] [PubMed] [Google Scholar]
- 33.Movassat M, Forouzmand E, Reese F et al. Exon size and sequence conservation improves identification of splice-altering nucleotides. RNA 25(2019): 1793–1805. [DOI] [PMC free article] [PubMed] [Google Scholar]
- 34.Kim D, Pertea G, Trapnell C, et al. TopHat2: accurate alignment of transcriptomes in the presence of insertions, deletions and gene fusions. Genome Biol 14(2013): R36. [DOI] [PMC free article] [PubMed] [Google Scholar]
- 35.Mapleson D, Venturini L, Kaithakottil G, et al. Efficient and accurate detection of splice junctions from RNA-seq with Portcullis. GigaSci-ence 7(2018): giy131. [DOI] [PMC free article] [PubMed] [Google Scholar]
- 36.Edgren H, Murumagi A, Kangaspeska S, et al. Identification of fusion genes in breast cancer by paired-end RNA-sequencing. Genome Bi-ol 12(2011): R6. [DOI] [PMC free article] [PubMed] [Google Scholar]
- 37.Li Y, Heavican TB, Vellichirammal NN, et al. ChimeRScope: a novel alignment-free algorithm for fusion transcript prediction us-ing paired-end RNA-Seq data. Nucleic Acids Res 45(2017): e120. [DOI] [PMC free article] [PubMed] [Google Scholar]
- 38.Kim D and Salzberg SL. TopHat-Fusion: an algorithm for discovery of novel fusion transcripts. Genome Biol 12(2011): R72. [DOI] [PMC free article] [PubMed] [Google Scholar]
- 39.Jia W, Qiu K, He M, et al. SOAPfuse: an algorithm for identifying fusion transcripts from paired-end RNA-Seq data. Genome Biol 14(2013): R12. [DOI] [PMC free article] [PubMed] [Google Scholar]
- 40.Li Y, Chien J, Smith DI, et al. FusionHunter: identifying fusion tran-scripts in cancer using paired-end RNA-seq. Bioinforma. Oxf. Engl 27(2011): 1708–1710. [DOI] [PubMed] [Google Scholar]
- 41.Benelli M, Pescucci C, Marseglia G, et al. Discovering chimeric transcripts in paired-end RNA-seq data by using EricScript. Bioinforma. Oxf. Engl 28(2012): 3232–3239. [DOI] [PubMed] [Google Scholar]
- 42.Chen K, Wallis JW, Kandoth C, et al. BreakFusion: targeted assembly-based identification of gene fusions in whole transcriptome paired-end sequencing data. Bioinforma. Oxf. Engl 28(2012): 1923–1924. [DOI] [PMC free article] [PubMed] [Google Scholar]
- 43.McPherson A, Hormozdiari F, Zayed A, et al. deFuse: an algorithm for gene fusion discovery in tumor RNA-Seq data. PLoS Comput. Biol 7(2011): e1001138. [DOI] [PMC free article] [PubMed] [Google Scholar]
- 44.Davidson NM, Majewski IJ and Oshlack A. JAFFA: High sensitivity transcriptome-focused fusion gene detection. Genome Med 7(2015): 43. [DOI] [PMC free article] [PubMed] [Google Scholar]
- 45.Torres-García W, Zheng S, Sivachenko A, et al. PRADA: pipeline for RNA sequencing data analysis. Bioinforma. Oxf. Engl 30(2014): 2224–2226. [DOI] [PMC free article] [PubMed] [Google Scholar]
- 46.Wang K, Singh D, Zeng Z, et al. MapSplice: Accurate map-ping of RNA-seq reads for splice junction discovery. Nucleic Acids Res 38(2010): e178. [DOI] [PMC free article] [PubMed] [Google Scholar]
- 47.Liu S, Tsai WH, Ding Y, et al. Comprehensive evaluation of fusion tran-script detection algorithms and a meta-caller to combine top performing meth-ods in paired-end RNA-seq data. Nucleic Acids Res 44(2016): e47. [DOI] [PMC free article] [PubMed] [Google Scholar]
- 48.Song C and Chen H. Overview of research on fusion genes in prostate cancer. Transl. Cancer Res 9(2020) : 1998–2011. [DOI] [PMC free article] [PubMed] [Google Scholar]
Associated Data
This section collects any data citations, data availability statements, or supplementary materials included in this article.


