

Abstract
Introduction
Among many antiretroviral drugs, tenofovir alafenamide is used extensively in combination regimens of tenofovir/emtricitabine or tenofovir/emtricitabine/bictegravir. However, concerns have arisen about the potential of tenofovir alafenamide to exacerbate hyperlipidaemia. This meta‐analysis evaluates the relationship between tenofovir alafenamide use and lipid‐profile alterations in people living with HIV.
Methods
We searched PubMed, Ovid MEDLINE, EMBASE and the Cochrane Library to identify studies on changes in cholesterol levels (e.g. total cholesterol, low‐density and high‐density lipoprotein cholesterol, and triglycerides) in people living with HIV who received treatment with a regimen containing tenofovir alafenamide (data collected 31 March 2023, review completed 30 July 2023). Potential risk factors for worsening lipid profile during treatment with tenofovir alafenamide were also evaluated.
Results
Sixty‐five studies involving 39,713 people living with HIV were selected. Significant increases in total cholesterol, low‐density and high‐density lipoprotein cholesterol, and triglycerides were observed after treatment with tenofovir alafenamide. Specifically, low‐density lipoprotein cholesterol (+12.31 mg/dl) and total cholesterol (+18.86 mg/dl) increased markedly from the third month of tenofovir alafenamide use, with significant elevations observed across all time points up to 36 months. Comparatively, tenofovir alafenamide regimens resulted in higher lipid levels than tenofovir disoproxil fumarate regimens at 12 months of use. Notably, discontinuation of the tenofovir alafenamide regimen led to significant decreases in low‐density lipoprotein cholesterol (–9.31 mg/dl) and total cholesterol (–8.91 mg/dl). Additionally, tenofovir alafenamide use was associated with increased bodyweight (+1.38 kg; 95% confidence interval: 0.92–1.84), which became more pronounced over time. Meta‐regression analysis identified young age, male sex and low body mass index as risk factors for worsening cholesterol levels in individuals treated with tenofovir alafenamide.
Conclusions
Tenofovir alafenamide use in people living with HIV is associated with significant alterations in lipid profile.
Keywords: cholesterol, HIV, lipid profile, meta‐analysis, tenofovir alafenamide, tenofovir disoproxil fumarate
1. INTRODUCTION
The management of human immunodeficiency virus (HIV) infection has witnessed transformative advancements since the advent of antiretroviral therapy (ART), revolutionizing the prognosis for individuals diagnosed with HIV. The development and optimization of antiretroviral regimens have not only prolonged life expectancy but have also significantly enhanced the quality of life for people living with HIV, turning what was once considered a fatal diagnosis into a manageable chronic condition. Currently, combination drugs are widely used due to their convenience and improved drug adherence. Among these drugs, tenofovir takes particular importance since it is not only considered for ordinary HIV treatment but also for person living with HIV and hepatitis B virus and for individuals requiring pre‐exposure prophylaxis [1, 2, 3]. The adoption of tenofovir alafenamide (TAF) into antiretroviral regimens was largely driven by reduced nephrotoxicity and a lower impact on bone density than the forerunner tenofovir disoproxil fumarate (TDF) [4, 5]. Despite these advantages of TAF, emerging concerns regarding the potential impact of TAF on metabolic health, particularly lipid metabolism, have garnered attention within the medical and research communities, prompting a need for comprehensive evaluation [6, 7].
In chronic hepatitis B, another condition in which TAF is used, a meta‐analysis demonstrated that dyslipidaemia worsened following the use of TAF [8, 9]. Dyslipidaemia, manifesting as increased levels of lipids such as cholesterol and triglycerides in the bloodstream, is a significant risk factor for cardiovascular disease (CVD), a leading cause of morbidity and mortality worldwide [10]. In the context of HIV treatment, the long‐term use of ART has been associated with metabolic disturbances, including dyslipidaemia, which complicates the management of people living with or persons living with HIV by increasing the risk of CVD [11]. The incorporation of TAF into treatment protocols has been linked to altered lipid profiles, raising critical questions about the metabolic safety and potential role of TAF in exacerbating dyslipidaemia in people living with or persons living with HIV. Therefore, the aim of this meta‐analysis was to determine the extent to which TAF is associated with worsening dyslipidaemia in individuals undergoing HIV treatment, by synthesizing existing research on the impact of TAF on lipid levels.
2. METHODS
This systematic review and meta‐analysis adhered to the Preferred Reporting Items for Systematic Reviews and Meta‐Analyses (PRISMA) guidelines and the Meta‐analysis of Observational Studies in Epidemiology (MOOSE) checklist, and was registered beforehand with PROSPERO (International Prospective Register of Systematic Reviews, CRD42024513906). Ethics approval was waived from the Institutional Review Board and our study conformed to the ethical guidelines of the World Medical Association Declaration of Helsinki. Informed consent was waived due to meta‐analysis.
2.1. Inclusion criteria, exclusion criteria and study outcomes
We included randomized controlled trials (RCTs), and prospective and retrospective cross‐sectional or cohort studies that examined changes in lipid profiles in adults (aged ≥18 years) undergoing treatment with regimens containing TAF. Our inclusion criteria did not limit studies based on the duration of treatment, ethnicity or geographical location. For studies where only a subset of participants were switched from TAF to a non‐TAF regimen, we included the study if we could extract information specifically for the subgroup that used TAF. If at least one lipid profile parameter was reported with exact numerical values, the study was included. We excluded case reports, case series with fewer than five patients, review articles, studies involving people living with or persons living with HIV and hepatitis B virus or hepatitis C virus, and studies that did not report specific lipid‐profile values or presented values only as ratios. If all lipid profiles were not reported, the study was excluded. We focused on individuals with HIV who are on ART. Studies involving the prophylaxis group were excluded from our analysis. The primary objective of the study was to assess the extent of lipid‐profile alterations following treatment with TAF. This assessment considered lipid‐profile changes in three clinical scenarios: (1) before and after TAF treatment in the same individuals; (2) comparing TAF‐based regimens with TDF‐based regimens; and (3) following the discontinuation of TAF. Subgroup analyses were conducted based on various factors, such as study design, income level, age, sex distribution, year of publication, sample size and the presence of commercial funding. Additionally, the secondary objective was to identify risk factors for changes in total cholesterol or low‐density lipoprotein (LDL)‐cholesterol due to TAF use. This involved compiling all factors associated with cholesterol changes from each study and conducting a meta‐regression analysis on the factors frequently mentioned across multiple studies.
2.2. Search strategy
The search strategy encompassed terms related to HIV, cholesterol and TAF. Synonyms for these terms were identified and used to formulate the search approach. The specific keywords employed within the framework of the Patient/Problem, Intervention, Comparison, and Outcome (PICO) model are detailed in the Supplementary Materials. We conducted searches in databases including Medline (PubMed), EMBASE, Cochrane Library, Web of Science and KoreaMed, using Medical Subject Headings (MeSH) to find studies published in English from 1 January 2005 to 28 February 2023. Our data were collected on 31 March 2023, and the data review was completed on 30 July 2023. The methods section and Supplementary Materials provide details on the search strategies and the outcomes from each database search. A professional librarian (EAJ) executed all search activities.
2.3. Study selection and data extraction
Titles and abstracts were independently reviewed by two authors, while full‐text articles were independently assessed for their relevance to the study by two reviewers (J‐JY and MJK). In cases of disagreement between the reviewers, SKK resolved the discrepancies through discussion. Additionally, both researchers independently conducted a risk of bias evaluation for all studies included, and also extracted and documented the characteristics and findings of these studies using a standardized format.
2.4. Methodological quality and risk of bias assessment
The evaluation of bias risk varied based on the type of each study. For randomized trials, the assessment was conducted using the Cochrane risk of bias tool. Meanwhile, for non‐randomized studies, such as cohort studies, the Risk of Bias Assessment tool for Non‐randomized Studies (RoBANS) was employed. The detailed outcomes of these assessments are available in the risk of bias section in the Supplementary Materials. Disagreements between the two authors (J‐JY and MJK) were settled through discussion. To evaluate publication bias, funnel plots were used.
2.5. Statistical analyses
Analyses of lipid‐profile changes before and after treatment with TAF, and comparisons between the TAF‐regimen and TDF‐regimen groups, were presented as mean differences for continuous variables and as Freeman‐Tukey variants for binary variables. Estimations of variance between studies were performed using the DerSimonian‐Laird method. To assess heterogeneity across studies, we used the I 2 metric, which quantifies the proportion of total variation across studies due to heterogeneity rather than chance, and the p‐value from Cochran's Q test. The I 2 values can range from 0% (no observed heterogeneity) to 100% (maximum heterogeneity). Publication bias was assessed using the AS‐Thompson test. For the statistical analyses, we used RevMan 5 software from the Cochrane Library and the meta package in R software (version 4.1.0; R Foundation for Statistical Computing, Vienna, Austria).
Subgroup analyses were conducted to assess the impact of TAF on dyslipidaemia across various groups. Relevant definitions for subgroup analyses included high‐risk versus low‐risk ART regimens, treatment‐experienced versus treatment‐naïve, age groups, sex distribution, income level of study country, funding source and sample size. High‐risk regimens included those containing protease inhibitors or elvitegravir, which are known to significantly affect lipid profiles. Low‐risk regimens did not include these agents.
To identify risk factors associated with worsening lipid profiles in patients taking TAF, we performed meta‐regression analyses using study‐level factors. These factors included the average age of participants, average body mass index (BMI) of participants, the percentage of study participants with prior dyslipidaemia and other relevant study‐level characteristics. Each covariate was included in the meta‐regression model to adjust for its potential confounding effect on the lipid outcomes. We used the DerSimonian‐Laird method for random‐effects meta‐regression to account for between‐study heterogeneity. The number of models fit corresponded to the number of covariates evaluated, with each model assessing the independent effect of one covariate on the lipid outcomes. We reported the regression coefficients, 95% confidence intervals (CIs) and p‐values for each covariate to determine its significance. Additionally, we evaluated the proportion of variance explained (R 2) by each model to understand the contribution of each covariate to the observed lipid changes.
3. RESULTS
3.1. Characteristics of included studies
Ultimately, 65 studies were included for analysis (Figure 1). Information on the enrolled patients is presented in Table 1. Among the studies included, 35 were prospective, while 30 were retrospective. Twenty‐one studies were RCTs, and 44 were non‐RCTs, including cohort studies. Sixteen studies focused on treatment‐naive patients, 47 targeted treatment‐experienced patients, and the remaining two studies included both treatment‐naive and treatment‐experienced patients. The average age of study participants ranged from 31 to 69 years, with 63 studies predominantly involving male participants. The included studies were conducted across various geographical regions, reflecting a diverse population of people living with or persons living with HIV. The majority of the studies were from high‐income countries, particularly the United States and countries in Europe, while a smaller number of studies were conducted in Asia, Africa and South America.
Figure 1.
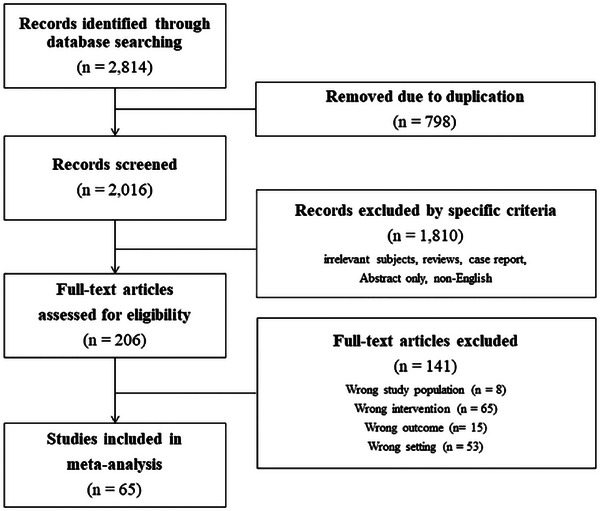
Flow charts of the study.
Table 1.
Characteristics of the included studies
| Author | Year | Study design | Study design | Hospitals | Country | Number of patients | Treatment experience | Age (years) | Male (%) |
|---|---|---|---|---|---|---|---|---|---|
| Abe et al. [12] | 2021 | Retrospective | Cohort | Single | Japan | 70 | Experienced | 44 | 92.9 |
| Adachi et al. [13] | 2022 | Retrospective | Cohort | Single | Japan | 119 | Naïve | 50 | 97 |
| Alejos et al. [14] | 2020 | Retrospective | Cohort | Multi | Spain | 446 | Naïve | 36 | 88.5 |
| Atencio et al. [15] | 2021 | Prospective | Cohort | Multi | Spain | 22 | Naïve | 34.8 | 100 |
| Baldin et al. [16] | 2021 | Retrospective | Cohort | Single | Italy | 126 | Experienced | 53.1 | 71.4 |
| Bendala‐Estrada et al. [17] | 2022 | Retrospective | Cohort | Single | Spain | 118 | Naïve | 51 | 86.4 |
| Bosch et al. [18] | 2023 | Prospective | RCT | Multi | South Africa | 70 | Naïve | 33 | 41 |
| Brunet et al. [19] | 2021 | Prospective | Cohort | Multi | USA | 6451 | Experienced | 47.9 | 84.3 |
| Cid‐Silva et al. [20] | 2019 | Retrospective | Cohort | Single | Spain | 233 | Naïve and experienced | 46.5 | 75.5 |
| Daar et al. [21] | 2018 | Prospective | RCT | Multi | Multi | 290 | Experienced | 48 | 84 |
| Dejesus et al. [22] | 2018 | Prospective | RCT | Multi | USA | 959 | Experienced | 41 | 89.3 |
| Eron et al. [23] | 2019 | Prospective | RCT | Multi | USA and Europe | 1141 | Experienced | 46 | 82 |
| Eron et al. [24] | 2018 | Prospective | RCT | Multi | USA and Europe | 362 | Naïve | 34 | 88 |
| Funderburg et al. [25] | 2016 | Prospective | RCT | Multi | USA | 98 | Naïve | 34 | 89 |
| Gallant et al. [26] | 2017 | Prospective | RCT | Multi | USA and Europe | 314 | Naïve | 31 | 91 |
| Gazzola et al. [7] | 2021 | Retrospective | Cohort | Single | Italy | 221 | Experienced | 45 | 78.7 |
| Giacomelli et al. [27] | 2021 | Retrospective | Cohort | Single | Italy | 261 | Experienced | 48 | 75.9 |
| Gilbert et al. [28] | 2022 | Retrospective | Cohort | Single | USA | 142 | Experienced | 66 | 90 |
| Hagins et al. [29] | 2021 | Prospective | RCT | Multi | USA | 495 | Experienced | 49 | 69 |
| Huhn et al. [30] | 2019 | Prospective | RCT | Multi | USA, Europe and Asia | 866 | Naïve | 33 | 85 |
| Ikeda et al. [31] | 2021 | Prospective | Cohort | Single | Japan | 31 | Experienced | 45 | 100 |
| Kanda et al. [32] | 2021 | Prospective | Cohort | Single | Japan | 118 | Experienced | 44 | 94 |
| Kauppinen et al. [33] | 2022 | Retrospective | Cohort | Single | Finland | 146 | Naïve | 50 | 79 |
| Kauppinen et al. [34] | 2019 | Retrospective | Cohort | Single | Finland | 490 | Experienced | 48 | 76 |
| Kim et al. [35] | 2022 | Retrospective | Cohort | Multi | Korea | 191 | Experienced | 43 | 90.6 |
| Kityo et al. [36] | 2019 | Prospective | RCT | Multi | USA, Europe and Asia | 234 | Experienced | 39 | 0 |
| Kovari et al. [37] | 2021 | Prospective | Cohort | Multi | Switzerland | 1712 | Experienced | 50 | 75 |
| Kuo et al. [38] | 2020 | Retrospective | Cohort | Single | Taiwan | 693 | Experienced | 43.9 | 95.1 |
| Lacey et al. [39] | 2020 | Retrospective | Cohort | Single | Ireland | 194 | Experienced | 46 | 70.6 |
| Lagoutte‐Renosi et al. [40] | 2021 | Retrospective | Cohort | Single | France | 103 | Experienced | 51 | 72.8 |
| Lazzaro et al. [41] | 2022 | Retrospective | Cohort | Single | Italy | 147 | Experienced | 57 | 70.7 |
| Maggiolo et al. [42] | 2021 | Prospective | Single arm | Multi | USA, Europe and Asia | 86 | Experienced | 69 | 87.2 |
| Maggiolo et al. [43] | 2019 | Prospective | RCT | Multi | USA, Europe and Asia | 110 | Experienced | 65 | 87 |
| Mallon et al. [6] | 2021 | Prospective | Cohort | Multi | USA | 6451 | Experienced | 48 | 84 |
| Martínez‐Sanz et al. [44] | 2023 | Prospective | Cohort | Multi | Spain | 1955 | Experienced | 38 | 86 |
| Mazzitelli et al. [45] | 2022 | Prospective | Cohort | Single | Italy | 290 | Experienced | 52 | 76.9 |
| Milinkovic et al. [46] | 2019 | Retrospective | Cohort | Single | UK | 385 | Experienced | 49 | 90 |
| Molina et al. [47] | 2018 | Prospective | RCT | Multi | USA and Europe | 282 | Experienced | 47 | 88 |
| Moschopoulos et al. [48] | 2023 | Retrospective | Cohort | Single | Greece | 62 | Experienced | 32.9 | 98.4 |
| Orkin et al. [49] | 2020 | Prospective | RCT | Multi | USA and Europe | 959 | Naïve | 31 | 91 |
| Orkin et al. [50] | 2020 | Prospective | RCT | Multi | USA and Europe | 725 | Naïve and experienced | 34 | 88 |
| Orkin et al. [51] | 2018 | Prospective | RCT | Multi | USA and Europe | 763 | Experienced | 46 | 82 |
| Petrakis et al. [52] | 2020 | Retrospective | Cohort | Single | Greece | 85 | Experienced | 43.91 | 82.9 |
| Plum et al. [53] | 2021 | Retrospective | Cohort | Single | Belgium | 98 | Experienced | 50 | 64.3 |
| Podzamczer et al. [54] | 2021 | Prospective | RCT | Multi | Spain | 151 | Naïve | 34 | 97 |
| Rizzardini et al. [55] | 2019 | Prospective | RCT | Multi | USA and Europe | 183 | Experienced | 49 | 85 |
| Rolle et al. [56] | 2020 | Retrospective | Cohort | Single | USA | 61 | Experienced | 53 | 77 |
| Rolle et al. [57] | 2021 | Retrospective | Cohort | Single | USA | 350 | Experienced | 57 | 80 |
| Sax et al. [58] | 2014 | Prospective | RCT | Multi | USA | 112 | Naïve | 34 | 96 |
| Schafer et al. [59] | 2019 | Retrospective | Cohort | Single | USA | 110 | Experienced | 50 | 72.7 |
| Schafer et al. [60] | 2022 | Retrospective | Cohort | Single | USA | 86 | Experienced | 47.1 | 67.4 |
| Schwarez‐Zander et al. [61] | 2020 | Retrospective | Cohort | Single | Germany | 347 | Experienced | 49 | 73 |
| Sekiya et al. [62] | 2023 | Retrospective | Cohort | Single | Japan | 328 | Experienced | 40.9 | 98.4 |
| Shokoohi et al. [63] | 2021 | Retrospective | Cohort | Single | Canada | 651 | Experienced | 48.2 | 92.9 |
| Squillace et al. [64] | 2020 | Prospective | Cohort | Multi | Italy | 190 | Experienced | 46.7 | 80 |
| Sun et al. [65] | 2022 | Retrospective | Cohort | Single | China | 91 | Naïve | 32 | 91.2 |
| Surial et al. [66] | 2021 | Prospective | Cohort | Multi | Switzerland | 3484 | Experienced | 50 | 75.3 |
| Tabak et al. [67] | 2020 | Prospective | Cohort | Multi | Turkey | 614 | Experienced | 42 | 89 |
| Taramasso et al. [68] | 2019 | Retrospective | Cohort | Multi | Italy | 573 | Experienced | 49.7 | 74.7 |
| Van Wyk et al. [69] | 2020 | Prospective | RCT | Multi | USA and Europe | 372 | Naïve | 40 | 93.2 |
| Verburgh et al. [70] | 2022 | Prospective | Cohort | Multi | Netherland | 1544 | Experienced | 51.5 | 85.6 |
| Walti et al. [71] | 2018 | Retrospective | Cohort | Single | Switzerland | 10 | Experienced | 55 | 90 |
| Winston et al. [72] | 2018 | Prospective | RCT | Multi | USA and Europe | 280 | Experienced | 52 | 86 |
| Wohl et al. [73] | 2016 | Prospective | RCT | Multi | USA, Europe and Asia | 866 | Naïve | 33 | 85 |
| Xia et al. [74] | 2021 | Prospective | Cohort | Single | China | 196 | Experienced | 37.5 | 96.9 |
Abbreviation: RCT, randomized controlled trial.
The heterogeneity among the included studies was assessed using the I 2 statistic. The I 2 values ranged from moderate to high for various lipid parameters, indicating substantial heterogeneity. Specifically, the I 2 values were 86% for high‐density lipoprotein (HDL)‐cholesterol at 3 months, 93% for LDL‐cholesterol at 3 months and 96% for total cholesterol at 3 months, suggesting considerable variability among the studies. Regarding the risk of bias, most RCTs were assessed as having a low risk of bias, while the cohort studies varied, with some showing a higher risk of bias due to potential confounding factors and selection bias (Supplementary Materials). For publication bias, the funnel plots for HDL‐cholesterol, LDL‐cholesterol, total cholesterol and triglycerides did not show significant asymmetry, suggesting a low likelihood of publication bias. The AS‐Thompson test results further supported this conclusion, indicating no significant evidence of publication bias in the included studies (Figures S1–S4).
3.2. Changes in lipid profile before and after using a TAF‐regimen
Initially, we analysed the lipid‐profile changes before and after implementation of a TAF‐based regimen (Table 2). Compared to baseline levels before TAF administration, HDL‐cholesterol increased significantly at all observed time points after starting TAF. Three months post‐TAF initiation, the increase in HDL‐cholesterol (ΔHDL) was 3.89 mg/dl (95% CI: 2.50–5.27), and at 12 months, ΔHDL was 2.47 mg/dl (95% CI: 1.66–3.29). For LDL cholesterol, there was a notable increase starting from the third month of TAF treatment, with a mean difference of 12.31 mg/dl, and at all subsequent time points up to 36 months, LDL cholesterol levels were significantly higher than baseline. Similarly, total cholesterol levels began to increase, with a mean difference of 18.86 mg/dl (95% CI: 10.49–27.23) from the third month of TAF treatment. Total cholesterol levels remained significantly elevated compared to baseline at all time points: 6, 12 and 24 months. Like the other lipid parameters, triglycerides also increased significantly after TAF administration compared to baseline levels. The study names and forest plots used in each analysis are presented in Figure S1.
Table 2.
Lipid‐profile changes during TAF treatment (vs. baseline)
| Outcome | Time point | No. of studies | Mean difference | 95% CI | I 2 | p for heterogeneity |
|---|---|---|---|---|---|---|
| HDL‐cholesterol | 3 months | 9 | 3.89 | 2.50–5.27 | 86 | <0.001 |
| 6 months | 18 | 3.54 | 2.19–4.89 | 94 | <0.001 | |
| 12 months | 36 | 2.47 | 1.66–3.29 | 92 | <0.001 | |
| 24 months | 13 | 3.40 | 2.95–3.84 | 54 | 0.009 | |
| 36 months | 5 | 3.17 | 1.64–4.70 | 87 | <0.001 | |
| LDL‐cholesterol | 3 months | 11 | 12.31 | 7.78–16.84 | 93 | <0.001 |
| 6 months | 22 | 10.27 | 6.66–13.89 | 93 | <0.001 | |
| 12 months | 39 | 9.06 | 6.39–11.72 | 95 | <0.001 | |
| 24 months | 13 | 13.00 | 7.67–18.33 | 96 | <0.001 | |
| 36 months | 5 | 13.03 | 5.77–20.30 | 96 | <0.001 | |
| Total cholesterol | 3 months | 11 | 18.86 | 10.49–27.23 | 96 | <0.001 |
| 6 months | 20 | 18.86 | 12.54–25.17 | 94 | <0.001 | |
| 12 months | 40 | 12.90 | 8.89–16.90 | 97 | <0.001 | |
| 24 months | 14 | 19.47 | 14.93–24.02 | 95 | <0.001 | |
| 36 months | 5 | 9.46 | 4.62–14.29 | 86 | <0.001 | |
| Triglycerides | 3 months | 10 | 17.16 | 12.14–22.17 | 75 | <0.001 |
| 6 months | 20 | 14.04 | 8.28–19.79 | 85 | <0.001 | |
| 12 months | 37 | 9.69 | 5.48–13.89 | 92 | <0.001 | |
| 24 months | 14 | 19.55 | 12.87–26.23 | 92 | <0.001 | |
| 36 months | 6 | 3.32 | –0.73 to 7.37 | 47 | 0.092 | |
| Total cholesterol/HDL‐cholesterol ratio | 3 months | 3 | 0.02 | –0.17 to 0.21 | 97 | <0.001 |
| 6 months | 7 | 0.07 | 0.01–0.12 | 73 | 0.001 | |
| 12 months | 30 | 0.06 | 0.01–0.12 | 100 | <0.001 | |
| 24 months | 7 | 0.22 | 0.11–0.34 | 91 | <0.001 | |
| 36 months | 4 | –0.04 | –0.10 to 0.02 | 76 | 0.005 |
Abbreviations: CI, confidence interval; HDL, high‐density lipoprotein; LDL, low‐density lipoprotein; TAF, tenofovir alafenamide.
3.3. Subgroup analyses in various situations, including ART risk group
We conducted analyses to assess the impact of TAF on dyslipidaemia across various subgroups (Table 3). While varying in degree, total cholesterol, LDL‐cholesterol and triglycerides increased significantly in all subgroups after 1 year of TAF use compared to baseline. Additionally, subgroup analyses were performed to examine the influence of other regimens that could affect dyslipidaemia, alongside TAF (Table 4). Regimens classified as high‐risk for causing dyslipidaemia included protease inhibitors or elvitegravir. Exacerbations of dyslipidaemia were noted both for high‐risk and low‐risk regimens, affecting both treatment‐naive and treatment‐experienced groups equally.
Table 3.
Pooled estimates and meta‐regression analyses (by different subgroups) of lipid‐profile changes after 1 year of TAF treatment
| Total cholesterol | LDL‐cholesterol | Triglycerides | HDL‐cholesterol | Total cholesterol/HDL‐cholesterol ratio | ||||||||||||||||
|---|---|---|---|---|---|---|---|---|---|---|---|---|---|---|---|---|---|---|---|---|
| n | Mean difference (95% CI) | Meta‐regression | n | Mean difference (95% CI) | Meta‐regression | n | Mean difference (95% CI) | Meta‐regression | n | Mean difference (95% CI) | Meta‐regression | n | Mean difference (95% CI) | Meta‐regression | ||||||
| p | R 2 (%) | p | R 2 (%) | p | R 2 (%) | p | R 2 (%) | p | R 2 (%) | |||||||||||
| Overall | 40 | 12.90 (8.89–16.90) | 39 | 9.06 (6.37–11.72) | 37 | 9.69 (5.48–13.89) | 36 | 2.47 (1.66–3.29) | 30 | 0.06 (0.01–0.12) | ||||||||||
| Study design | ||||||||||||||||||||
| Prospective | 25 | 14.28 (9.27–19.29) | 25 | 9.52 (6.36–12.69) | 22 | 9.65 (4.72–14.58) | 22 | 2.44 (1.37–3.51) | 19 | 0.07 (0.00–0.14) | ||||||||||
| Retrospective | 15 | 9.91 (3.84–15.97) | 0.357 | 3.0 | 14 | 8.27 (3.27–13.27) | 0.569 | 3.0 | 15 | 10.66 (1.19–20.12) | 0.998 | 0 | 14 | 2.31 (1.33–3.28) | 0.799 | 0 | 11 | 0.01 (–0.02 to 0.04) | 0.564 | 40.3 |
| Study design | ||||||||||||||||||||
| RCT | 19 | 14.99 (9.05–20.94) | 18 | 9.51 (5.61–13.42) | 14 | 8.80 (2.66–14.95) | 17 | 2.39 (1.15–3.63) | 17 | 0.19 (0.18–0.19) | ||||||||||
| Non‐RCT | 21 | 10.10 (5.24–14.94) | 0.319 | 2.6 | 21 | 8.42 (4.81–12.04) | 0.777 | 0 | 23 | 11.24 (4.50–17.98) | 0.661 | 0 | 19 | 2.43 (1.44–3.41) | 0.740 | 0 | 13 | 0.00 (0.00–0.00) | 0.188 | 41.1 |
| Income group | ||||||||||||||||||||
| High | 36 | 11.88 (7.61–16.14) | 35 | 8.27 (5.39–11.15) | 33 | 8.56 (3.83–13.29) | 32 | 2.19 (1.33–3.04) | 28 | 0.06 (0.00–0.11) | ||||||||||
| Low/middle | 4 | 28.33 (6.52–50.14) | 0.357 | 3.09 | 4 | 22.48 (6.81–38.15) | 0.027 | 0 | 4 | 24.51 (0.72–48.30) | 0.083 | 0 | 4 | 5.72 (2.50–8.94) | 0.026 | 0 | 2 | 0.07 (–0.11 to 0.27) | 0.882 | 0 |
| Age group | ||||||||||||||||||||
| < 40 years | 18 | 18.79 (12.71–24.86) | 16 | 11.79 (7.96–15.61) | 14 | 6.68 (5.36–8.00) | 14 | 3.66 (2.52–4.80) | 14 | 0.05 (0.01–0.08) | ||||||||||
| ≥40 years | 22 | 8.00 (3.03–12.97) | 0.008 | 7.5 | 13 | 7.29 (3.48–11.09) | 0.074 | 0 | 23 | 1.95 (0.34–3.56) | 0.104 | 0 | 22 | 1.63 (0.64–2.62) | 0.007 | 16.6 | 16 | 0.05 (–0.02 to 0.13) | 0.809 | 35.3 |
| Males | ||||||||||||||||||||
| ≥80% | 30 | 15.20 (10.65–19.76) | 30 | 10.70 (7.91–13.49) | 28 | 12.64 (7.95–17.34) | 26 | 2.89 (1.96–3.82) | 23 | 0.08 (0.01–0.14) | ||||||||||
| <80% | 10 | 3.54 (–1.25 to 8.33) | 0.026 | 21.7 | 9 | 1.42 (–2.09 to 4.94) | 0.004 | 27.0 | 9 | –1.37 (–8.02 to 5.27) | 0.006 | 12.5 | 10 | 1.14 (–0.18 to 2.46) | 0.067 | 11.2 | 7 | 0.00 (–0.06 to 0.07) | 0.206 | 0 |
| Years published | ||||||||||||||||||||
| 2014–2019 | 17 | 16.48 (10.10–22.86) | 17 | 10.88 (6.62–15.14) | 14 | 9.76 (2.81–16.71) | 16 | 3.01 (1.65–4.37) | 16 | 0.07 (0.00–0.15) | ||||||||||
| 2020–2023 | 23 | 10.20 (5.15–15.25) | 0.137 | 3.7 | 22 | 7.69 (4.23–11.14) | 0.275 | 0 | 23 | 9.75 (4.13–15.36) | 0.954 | 0 | 20 | 2.05 (1.05–3.06) | 0.345 | 0 | 14 | 0.04 (0.01–0.08) | 0.640 | 34.2 |
| PI‐based ART | ||||||||||||||||||||
| No | 29 | 13.69 (8.51–18.88) | 25 | 9.03 (5.56–12.49) | 25 | 4.56 (3.27–5.84) | 26 | 2.81 (1.79–3.83) | 19 | 0.03 (0.00–0.06) | ||||||||||
| Yes | 11 | 11.66 (4.36–18.96) | 0.704 | 0 | 14 | 9.29 (4.76–13.82) | 0.945 | 0 | 13 | 5.14 (3.46–6.82) | 0.870 | 0 | 10 | 1.77 (0.29–3.26) | 0.276 | 0 | 11 | 0.11 (0.02–0.20) | 0.130 | 44.5 |
| Sample size | ||||||||||||||||||||
| <200 | 20 | 14.71 (9.01–20.40) | 18 | 12.34 (7.51–17.17) | 18 | 14.02 (5.29–22.75) | 17 | 2.78 (1.77–3.80) | 14 | 0.01 (–0.01 to 0.04) | ||||||||||
| 200–500 | 14 | 7.74 (1.16–14.31) | 14 | 5.21 (1.16–9.26) | 14 | 4.82 (–1.85 to 11.50) | 6 | 3.16 (2.22–4.11) | 5 | 0.18 (0.15–0.22) | ||||||||||
| ≥500 | 6 | 20.05 (18.14–21.97) | 0.279 | 0 | 7 | 11.59 (6.83–16.35) | 0.967 | 0 | 5 | 15.01 (6.24–23.79) | 0.695 | 0 | 13 | 1.50 (0.03–2.96) | 0.530 | 0 | 11 | 0.06 (–0.02 to 0.15) | 0.259 | 89.8 |
| Funding | ||||||||||||||||||||
| Non‐SIT | 16 | 12.95 (8.55–17.35) | 15 | 9.75 (6.32–13.18) | 17 | 12.74 (5.81–19.67) | 13 | 2.44 (1.55–3.33) | 12 | 0.01 (0.00–0.02) | ||||||||||
| SIT | 24 | 12.23 (6.46–17.99) | 0.540 | 0 | 24 | 8.24 (4.62–11.86) | 0.339 | 0 | 20 | 7.94 (2.19–13.68) | 0.273 | 0 | 23 | 2.37 (1.27–3.48) | 0.578 | 0 | 18 | 0.05 (–0.02 to 0.14) | 0.638 | 81.6 |
| Treatment‐experience | ||||||||||||||||||||
| Experienced | 24 | 8.39 (3.21–13.57) | 25 | 7.62 (4.19–11.05) | 25 | 5.90 (1.24–10.55) | 24 | 1.49 (0.60–2.38) | 18 | 0.06 (0.00–0.14) | ||||||||||
| Naïve | 16 | 20.74 (13.84–27.64) | 0.005 | 0 | 14 | 12.12 (7.53–16.72) | 0.118 | 0 | 12 | 15.76 (9.57–21.95) | 0.013 | 26.0 | 12 | 4.49 (3.32–5.66) | <0.001 | 24.3 | 12 | 0.03 (0.00–0.07) | 0.774 | 1.7 |
Abbreviations: ART, antiretroviral therapy; CI, confidence interval; LDL, low‐density lipoprotein; PI, protease inhibitor; RCT, randomized controlled trial; SIT, sponsor‐initiated trial; TAF, tenofovir alafenamide.
Table 4.
Pooled estimates of lipid‐profile changes (by different drug regimen) after 1 year of TAF treatment
| Total cholesterol | LDL‐cholesterol | Triglycerides | HDL‐cholesterol | Total cholesterol/HDL‐cholesterol ratio | ||||||||||||||||
|---|---|---|---|---|---|---|---|---|---|---|---|---|---|---|---|---|---|---|---|---|
| n | Mean difference (95% CI) | I 2 | p for heterogeneity | n | Mean difference (95% CI) | I 2 | p for heterogeneity | n | Mean difference (95% CI) | I 2 | p for heterogeneity | n | Mean difference (95% CI) | I 2 | p for heterogeneity | n | Mean difference (95% CI) | I 2 | p for heterogeneity | |
| Treatment naïve | ||||||||||||||||||||
| High‐risk regimen | 14 | 19.82 (12.37–27.26) | 98 | <0.001 | 13 | 12.97 (7.63–18.32) | 95 | <0.001 | 10 | 15.49 (8.34–22.64) | 87 | <0.001 | 11 | 4.46 (3.15–5.77) | 75 | <0.001 | 11 | 0.05 (0.01–0.09) | 88 | <0.001 |
| Low‐risk regimen | 2 | 15.54 (9.40–21.68) | 70 | 0.073 | NA | NA | NA | NA | 2 | 19.84 (–5.12 to 44.80) | 82 | 0.028 | 1 | 5.00 (3.94–6.06) | NA | NA | 1 | –0.10 (–0.17 to –0.03) | NA | NA |
| Treatment‐experienced | ||||||||||||||||||||
| Previous PI (–), Current PI (–) | 6 | 16.43 (7.08–25.77) | 96 | <0.001 | 6 | 13.24 (7.21–19.27) | 93 | <0.001 | 6 | 10.22 (1.66–18.78) | 89 | <0.001 | 6 | 2.58 (0.78–4.38) | 91 | <0.001 | 5 | 0.08 (–0.01 to 0.17) | 91 | <0.001 |
| Previous PI (–), Current PI (+) | NA | NA | NA | NA | NA | NA | NA | NA | NA | NA | NA | NA | NA | NA | NA | NA | NA | NA | NA | NA |
| Previous PI (+), Current PI (–) | 8 | 2.24 (–3.95 to 8.44) | 94 | <0.001 | 7 | 1.49 (–2.84 to 5.81) | 91 | <0.001 | 7 | –1.31 (–10.37 to 10.11) | 91 | <0.001 | 11 | 0.96 (–0.29 to 2.22) | 89 | <0.001 | 6 | –0.01 (–0.22 to 0.20) | 96 | <0.001 |
| Previous PI (+), Current PI (+) | 7 | 10.91 (0.26–21.56) | 97 | <0.001 | 10 | 9.66 (3.98–15.34) | 95 | <0.001 | 9 | 10.39 (1.64–19.14) | 90 | <0.001 | 7 | 1.47 (–0.54 to 3.49) | 94 | <0.001 | 7 | 0.12 (0.01–0.22) | 93 | <0.001 |
Abbreviations: CI, confidence interval; LDL, low‐density lipoprotein; NA, not available; PI, protease inhibitor; TAF, tenofovir alafenamide.
3.4. Differences in lipid profile between TAF‐based regimens and TDF‐based regimens
Subsequently, we compared lipid‐profile differences between patients on TAF and TDF regimens (Table 5). After 12 months, TAF versus TDF regimens resulted in significantly higher levels of HDL‐cholesterol (mean difference 2.53 mg/dl; 95% CI: 1.02–4.05), LDL‐cholesterol (10.13 mg/dl; 95% CI: 6.66–13.59), total cholesterol (14.65 mg/dl; 95% CI: 9.99–19.32) and triglycerides (6.88 mg/dl; 95% CI: 0.41–13.35). The forest plots are presented in Figure S2.
Table 5.
Changes in lipid profile at 1 year after TAF versus TDF treatment
| Outcome | No. of studies | Mean difference | 95% CI | I 2 | p for heterogeneity |
|---|---|---|---|---|---|
| HDL‐cholesterol | 14 | 2.53 | 1.02–4.05 | 92 | <0.01 |
| LDL‐cholesterol | 17 | 10.13 | 6.66–13.59 | 89 | <0.01 |
| Total cholesterol | 18 | 14.65 | 9.99–19.32 | 93 | <0.01 |
| Triglycerides | 15 | 6.88 | 0.41–13.35 | 90 | <0.01 |
| Total cholesterol/HDL‐cholesterol ratio | 14 | 0.11 | 0.04–0.17 | 93 | <0.01 |
Abbreviations: CI, confidence interval; HDL, high‐density lipoprotein; LDL, low‐density lipoprotein; TAF, tenofovir alafenamide; TDF, tenofovir disoproxil fumarate.
3.5. Lipid‐prolife changes after discontinuation of TAF‐based regimens
Four studies reported lipid profiles after discontinuation of the TAF regimens. We analysed the lipid‐profile changes at 12 months after discontinuation of the TAF regimens (Table 6). Significant decreases in LDL‐cholesterol (mean difference 9.31 mg/dl; 95% CI: 5.36–13.27) and total cholesterol (8.91 mg/dl; 95% CI: 3.88–13.94) were observed 12 months after stopping TAF treatment compared with during TAF treatment. The forest plots are presented in Figure S3.
Table 6.
Changes in lipid profile 1 year after stopping TAF
| Outcome | No. of studies | Mean difference | 95% CI | I 2 | p for heterogeneity |
|---|---|---|---|---|---|
| HDL‐cholesterol | 4 | –1.86 | –3.19 to –0.53 | 44 | 0.15 |
| LDL‐cholesterol | 4 | –9.31 | –13.27 to –5.36 | 60 | 0.06 |
| Total cholesterol | 4 | –8.91 | –13.94 to –3.88 | 68 | 0.02 |
| Triglycerides | 4 | –9.28 | –12.99 to +5.57 | 0 | 0.68 |
Abbreviations: CI, confidence interval; HDL, high‐density lipoprotein; LDL, low‐density lipoprotein; TAF, tenofovir alafenamide.
3.6. Changes in bodyweight after TAF use
Twenty‐two studies documented changes in bodyweight after TAF use, revealing an average weight gain of 1.38 kg (95% CI: 0.92–1.84) over the entire observation period (Table 7). Weight gain was more pronounced the longer TAF was used: an increase of 0.64 kg (95% CI: 0.19–1.10) at 6 months, 0.91 kg (95% CI: 0.54–1.27) at 12 months, 1.71 kg (95% CI: 0.64–2.78) at 24 months and 3.42 kg (95% CI: 1.59–5.26) at 36 months. The forest plots are presented in Figure S4.
Table 7.
Changes in bodyweight (kg) during TAF treatment (vs. baseline)
| Outcome | No. of studies | Mean difference | 95% CI | I 2 | p for heterogeneity |
|---|---|---|---|---|---|
| Overall period | 22 | 1.38 | 0.92–1.84 | 92 | <0.01 |
| 6 months | 4 | 0.64 | 0.19–1.10 | 67 | 0.03 |
| 12 months | 13 | 0.91 | 0.54–1.27 | 75 | <0.01 |
| 24 months | 2 | 1.71 | 0.64–2.78 | 49 | 0.16 |
| 36 months | 4 | 3.42 | 1.59–5.26 | 94 | <0.01 |
Abbreviations: CI, confidence interval; TAF, tenofovir alafenamide.
3.7. Risk factors for worsening cholesterol in patients using TAF
Finally, a meta‐regression analysis was conducted to identify risk factors associated with worsening cholesterol in patients taking TAF. Our meta‐analysis considered eight risk factors: the proportion of treatment‐naive patients, age, sex, BMI, diabetes, hypertension, prior dyslipidaemia and smoking (Table 8). Our meta‐regression analysis identified several study‐level factors associated with changes in lipid profiles in patients taking TAF. Younger age, male sex and lower baseline BMI were found to be significant risk factors for worsening lipid profiles. Notably, studies with participants having a worse metabolic profile at baseline (higher LDL and total cholesterol) were associated with less worsening of lipids on TAF.
Table 8.
Meta‐regression analysis of risk factors for worsening lipid profiles in patients treated with TAF for 1 year
| Variable | Δ Total cholesterol | Δ LDL‐cholesterol | Δ Triglycerides | Δ HDL‐cholesterol | Δ Total cholesterol/HDL‐cholesterol ratio | ||||||||||
|---|---|---|---|---|---|---|---|---|---|---|---|---|---|---|---|
| No. | Coefficient (95% CI) | p | No. | Coefficient (95% CI) | p | No. | Coefficient (95% CI) | p | No. | Coefficient (95% CI) | p | No. | Coefficient (95% CI) | p | |
| Treatment‐naïve (vs. treatment‐experienced) | 40 | 12.268 (3.670–20.867) | 0.005 | 39 | 4.643 (–1.185 to 10.472) | 0.118 | 37 | 9.918 (2.083–17.754) | 0.013 | 36 | 3.170 (1.562–4.778) | 0.001 | 30 | –0.016 (–0.130 to 0.097) | 0.774 |
| Age | 40 | –0.843 (–1.198 to –0.488) | <0.001 | 39 | –0.421 (–0.684 to –0.158) | 0.001 | 37 | –0.648 (–1.085 to –0.211) | 0.003 | 36 | –0.148 (–0.220 to –0.077) | <0.001 | 30 | 0.000 (–0.005 to 0.004) | 0.733 |
| Male (%) | 40 | 0.294 (0.057–0.530) | 0.014 | 39 | 0.211 (0.057–0.364) | 0.007 | 37 | 0.330 (0.100–0.560) | 0.004 | 36 | 0.053 (0.008–0.099) | 0.020 | 30 | 0.001 (–0.001 to 0.004) | 0.475 |
| BMI (kg/m2) | 24 | –3.343 (–5.557 to –1.129) | 0.003 | 21 | –1.898 (–3.438 to –0.358) | 0.015 | 22 | –6.668 (–9.848 to –3.488) | <0.001 | 21 | –0.828 (–1.360 to –0.295) | 0.002 | 15 | 0.015 (0.000–0.031) | 0.044 |
| Diabetes (%) | 16 | –1.088 (–2.181 to +0.004) | 0.051 | 14 | –0.667 (–1.621 to 0.285) | 0.170 | 14 | –0.526 (–2.628 to 1.576) | 0.623 | 15 | –0.162 (–0.320 to –0.005) | 0.042 | 9 | 0.025 (0.003–0.047) | 0.021 |
| Hypertension (%) | 16 | –0.586 (–1.023 to –0.149) | 0.008 | 15 | –0.405 (–0.736 to –0.075) | 0.015 | 15 | –0.611 (–1.364 to 0.141) | 0.111 | 15 | –0.083 (–0.136 to –0.030) | 0.002 | 10 | 0.004 (–0.002 to 0.011) | 0.164 |
| Prior dyslipidaemia (%) | 13 | –0.581 (–1.054 to –0.107) | 0.016 | 12 | –0.365 (–0.657 to –0.072) | 0.014 | 14 | –1.060 (–1.680 to –0.439) | <0.001 | 12 | –0.105 (–0.174 to –0.037) | 0.003 | 7 | 0.006 (–0.012 to 0.025) | 0.515 |
| Smoking (%) | 14 | –0.362 (–1.087 to +0.362) | 0.327 | 10 | –0.161 (–0.640 to 0.318) | 0.510 | 11 | 0.033 (–0.683 to 0.749) | 0.927 | 12 | –0.040 (–0.122 to 0.041) | 0.331 | 9 | –0.004 (–0.009 to 0.000) | 0.094 |
| Baseline HDL‐cholesterol level | 29 | –2.187 (–2.972 to –1.401) | <0.001 | 26 | –1.434 (–2.022 to –0.845) | <0.001 | 24 | –1.845 (–2.779 to –0.911) | <0.001 | 28 | –0.458 (–0.619 to –0.297) | <0.001 | 20 | 0.000 (–0.005 to 0.007) | 0.871 |
| Baseline LDL‐cholesterol level | 29 | –0.817 (–1.247 to –0.388) | 0.002 | 28 | –0.548 (–0.817 to –0.278) | <0.001 | 26 | –1.084 (–1.530 to –0.639) | <0.001 | 28 | –0.173 (–0.277 to –0.068) | 0.001 | 21 | –0.006 (–0.011 to –0.002) | 0.001 |
| Baseline total cholesterol level | 30 | –0.834 (–1.091 to –0.577) | <0.001 | 26 | –0.492 (–0.681 to –0.302) | <0.001 | 25 | –0.809 (–1.144 to –0.474) | <0.001 | 28 | –0.174 (–0.243 to –0.105) | <0.001 | 20 | –0.002 (–0.005 to 0.000) | 0.051 |
| Baseline triglyceride level | 28 | –0.237 (–0.518 to 0.043) | 0.097 | 26 | –0.115 (–0.313 to 0.082) | 0.251 | 28 | –0.315 (–0.622 to –0.008) | 0.044 | 26 | –0.025 (–0.102 to 0.051) | 0.513 | 19 | –0.002 (–0.004 to 0.001) | 0.111 |
Abbreviations: BMI, body mass index; CI, confidence interval; LDL, low‐density lipoprotein; TAF, tenofovir alafenamide.
4. DISCUSSION
This meta‐analysis consolidates existing evidence on the impact of TAF on lipid metabolism in individuals undergoing HIV treatment. Consistent with the primary objective, our findings indicate significantly altered lipid profiles post‐TAF treatment, characterized by increased levels of HDL‐cholesterol, LDL‐cholesterol, total cholesterol and triglycerides. Notably, discontinuation of TAF was associated with a marked decrease in LDL‐cholesterol and total cholesterol, suggesting a direct impact of TAF on lipid metabolism, although the influence of other factors alongside TAF discontinuation cannot be ruled out, especially since the four studies included in this analysis were not randomized.
Our study consolidates existing evidence on the impact of TAF on lipid metabolism in individuals undergoing HIV treatment. Consistent with the primary objective, our findings indicate significantly altered lipid profiles post‐TAF treatment, characterized by increased levels of HDL‐cholesterol, LDL‐cholesterol, total cholesterol and triglycerides. Notably, discontinuation of TAF was associated with a marked decrease in LDL‐cholesterol and total cholesterol, suggesting a direct impact of TAF on lipid metabolism. The observed improvements in lipid profiles upon discontinuation of TAF provide compelling evidence that TAF exacerbates hyperlipidaemia, which can be reversed by switching to alternative antiretroviral therapies. Given the significant increases in LDL and total cholesterol observed in our analysis, the potential increase in CVD risk necessitates vigilant metabolic health monitoring in patients on TAF.
Interestingly, while elevated HDL‐cholesterol could be interpreted as a positive outcome, given the protective role of HDL‐cholesterol against CVD, the simultaneous increase in LDL‐cholesterol and triglycerides complicates this narrative. While our study focused primarily on individual lipid parameters, the net impact of TAF on the total cholesterol to total cholesterol/HDL‐C ratio is also important to consider. Despite observing increases in both total cholesterol and HDL, the net change in the total cholesterol/HDL‐C ratio remained relatively even. However, the absolute increases in LDL and total cholesterol suggest an unfavourable cardiovascular profile, as elevated levels of these lipids are strongly associated with increased CVD risk. These changes align with research suggesting that certain ART agents, particularly regimens including TAF, may shift lipid profiles towards patterns associated with increased cardiovascular risk. Among ART agents, protease inhibitors and elvitegravir are known to require caution in patients with dyslipidaemia, and TAF should be added to this list.
Various antiretroviral drugs affect lipid profiles: for example, it is well known that protease inhibitors such as ritonavir, efavirenz and elvitegravir worsen lipid profiles, mostly affecting triglyceride levels [75, 76]. We tried to capture the lipid‐altering effects of antiretroviral drugs other than TAF. Although detailed data on all antiretroviral regimens were not available in the 39 articles included, efavirenz and elvitegravir were used in only a negligible proportion of the study populations. Thus, we evaluated subgroups according to the use of protease inhibitors before and during TAF use. After the discontinuation of protease inhibitors, our data suggested a decreasing trend in triglyceride levels, even after the initiation of TAF. However, the estimated change of –1.31 (95% CI –10.37 to 10.11) was not statistically significant. TAF‐induced changes in LDL‐cholesterol levels were unaffected by the discontinuation of protease inhibitors. In contrast to other drugs, TDF has a favourable effect on lipid profiles. We identified that 41.5% of the total study population switched from TDF to TAF, contributing to more dramatic changes in lipid levels. Interestingly, the potential mechanism behind TDF's beneficial impact on lipid profiles might be linked to its effect on nutrient absorption. TDF has been hypothesized to cause damage to enterocytes, which could impair nutrient absorption and suppress weight gain, subsequently affecting lipid levels [77]. This hypothesis suggests that the higher lipid levels observed with TAF use may partly reflect the resolution of TDF‐induced derangements.
Besides the use of people living with or persons living with HIV, TAF is also used to treat hepatitis B virus (HBV) infection. In patients with HBV infection, worsening dyslipidaemia after TAF use was reported in a meta‐analysis [8]. The exact reasons behind the less advantageous impact of TAF on lipid profiles remain unclear. However, based on study outcomes, we can suggest two plausible explanations. Firstly, TAF use correlates with weight gain, which can worsen metabolic conditions; indeed, in our study, body weight increased as the duration of TAF use increased. Studies from various regions reported immediate weight gain after switching to TAF in people living with or persons living with HIV. Such weight gain is likely to aggravate dyslipidaemia and metabolic disorders, linking TAF use to worsening lipid profiles. Secondly, TAF may directly worsen lipid profiles, whereas TDF appears to have a beneficial effect [78, 79, 80]. TDF, compared to TAF, presents a higher concentration of the active drug tenofovir in the bloodstream, which could positively influence lipid levels [81, 82]. Additionally, laboratory research indicates that TDF may reduce cholesterol in hepatocyte supernatant by stimulating the peroxisome proliferator‐activated receptor alpha pathway [83]. Such stimulation promotes the expression of genes like carnitine palmitoyltransferase 1 and CD36, with the latter facilitating the uptake of oxidized LDL‐cholesterol, HDL‐cholesterol and free fatty acids by the liver, thus offering a protective effect on lipids [84, 85, 86, 87]. Nonetheless, these mechanisms have not been definitively proven in human studies, underscoring the need for further investigation.
Our meta‐regression analysis revealed that younger age, male sex and lower baseline BMI were significant predictors of worsening lipid profiles in patients on TAF. Interestingly, a worse metabolic profile at baseline was associated with less worsening of lipids on TAF. This finding suggests that patients with higher baseline cholesterol levels may experience smaller increases in lipid levels during TAF treatment, aligning with some previous studies [8, 88]. Currently, the clinical implication of this finding is not clear. Further study is needed to identify whether TAF additionally increases cardiovascular risk in patients who already have dyslipidaemia. Basically, TAF could be switched to alternative antiretrovirals in patients with higher cardiovascular risks to avoid any potential harm.
The geographical distribution of the studies included in our meta‐analysis predominantly represents high‐income countries, such as the United States and European nations. This distribution suggests that the findings may be influenced by the healthcare infrastructure and resources available in these regions, which can affect the generalizability of the results to lower‐income countries. In high‐income countries, the monitoring and management of lipid profiles in people living with or persons living with HIV might be more systematic and accessible, potentially leading to better detection and treatment of dyslipidaemia. However, in low‐ and middle‐income countries, where fewer studies were conducted, healthcare resources may be limited, and the impact of TAF on lipid metabolism could be underreported or inadequately managed.
Our study has several limitations. Firstly, the heterogeneity among included studies, regarding study design, population demographics and treatment duration, may influence the generalizability of the overall findings. The potential for selection bias exists as we included only studies that provided exact numerical values for cholesterol level changes, excluding those that reported changes in percentages or proportions. Secondly, the main limitation of our study is that the impact of lipid changes caused by TAF on the long‐term cardiovascular outcome could not be determined by our study. Only four studies presented the other CVD risk factors and data on the long‐term cardiovascular outcome lacked in other studies. Additionally, even these four studies used different parameters to present CVD risk, making it difficult to integrate the results into meta‐analysis. However, we want to focus on the fact that the significant increases in LDL‐cholesterol and total cholesterol observed in our analysis could be associated with potential increases or with a potential increase in CVD risk. Although the direct association of TAF use with CVD event is beyond the scope of our study, an average increase of 12.31 mg/dl LDL‐cholesterol and 18.86 mg/dl in total cholesterol after TAF initiation could potentially increase CVD risk, particularly in individuals with additional risk factors such as hypertension, diabetes or smoking. Further studies should focus on long‐term outcomes of TAF treatment, especially concerning cardiovascular events. Although our analyses focused on antiretroviral drugs well known for affecting lipid profiles, some unexpected bias may have resulted from the effect of companion drugs. Thirdly, it was challenging to accurately estimate the potential effects of individual antiretroviral drugs other than TAF. A wide variety of antiretroviral regimens were used in conjunction with TAF in each study and some regimens were included in only one or two studies.
5. CONCLUSIONS
In conclusion, while TAF represents a significant advance in HIV treatment, its impact on lipid metabolism warrants careful consideration. The findings from this meta‐analysis highlight the necessity for comprehensive metabolic monitoring and management strategies for patients on TAF, to mitigate the increased risk of CVD. As the landscape of HIV treatment continues to evolve, so too must our understanding of the long‐term implications of ART on overall health.
COMPETING INTERESTS
The authors have no relevant financial or non‐financial interests to disclose.
AUTHORS’ CONTRIBUTIONS
Study concept and design: J‐JY and MJK; Provision of study materials or patients: J‐JY and EAJ; Collection and assembly of data: SGK and YSK; Data analysis and interpretation J‐JY and MJK; Manuscript writing: J‐JY; Final approval of manuscript: All authors.
FUNDING
This work was supported by the Soonchunhyang University Research Fund.
Supporting information
Figure S1. Forest plots and funnel plots of Table 2
Figure S2. Forest plots and funnel plots of Table 5
Figure S3. Forest plots and funnel plots of Table 6
Figure S4. Forest plots and funnel plots of Table 7
ACKNOWLEDGEMENTS
none
DATA AVAILABILITY STATEMENT
The datasets generated during and/or analysed during the current study are available from the corresponding author upon reasonable request.
REFERENCES
- 1. Gandhi RT, Bedimo R, Hoy JF, Landovitz RJ, Smith DM, Eaton EF, et al. Antiretroviral drugs for treatment and prevention of HIV infection in adults: 2022 recommendations of the International Antiviral Society‐USA Panel. JAMA. 2023;329(1):63–84. [DOI] [PubMed] [Google Scholar]
- 2. Korean Association for the Study of the Liver . KASL clinical practice guidelines for management of chronic hepatitis B. Clin Mol Hepatol. 2022;28(2):276–331. [DOI] [PMC free article] [PubMed] [Google Scholar]
- 3. Abdool Karim SS, Baxter C, Abdool Karim Q. Advancing HIV prevention using tenofovir‐based pre‐exposure prophylaxis. Antivir Ther. 2022;27(2). [DOI] [PubMed] [Google Scholar]
- 4. Fong TL, Lee BT, Tien A, Chang M, Lim C, Ahn A, et al. Improvement of bone mineral density and markers of proximal renal tubular function in chronic hepatitis B patients switched from tenofovir disoproxil fumarate to tenofovir alafenamide. J Viral Hepat. 2019;26(5):561–567. [DOI] [PubMed] [Google Scholar]
- 5. Soldado‐Folgado J, Rins‐Lozano O, Arrieta‐Aldea I, Gonzale‐Mena A, Canas‐Ruano E, Knobel H, et al. Changes in bone quality after switching from a TDF to a TAF based ART: a pilot randomized study. Front Endocrinol (Lausanne). 2023;14:1076739. [DOI] [PMC free article] [PubMed] [Google Scholar]
- 6. Mallon PWG, Brunet L, Fusco JS, Prajapati G, Beyer A, Fusco GP, et al. Lipid changes after switch from TDF to TAF in the OPERA Cohort: LDL cholesterol and triglycerides. Open Forum Infect Dis. 2022;9(1):ofab621. [DOI] [PMC free article] [PubMed] [Google Scholar]
- 7. Gazzola L, Tagliaferri G, De Bona A, Mondatore D, Borsino C, Bini T, et al. Dyslipidaemia after switch to tenofovir alafenamide (TAF)‐based cART regimens in a cohort of HIV‐positive patients: what clinical relevance? HIV Med. 2021;22(2):140–145. [DOI] [PubMed] [Google Scholar]
- 8. Hwang EG, Jung EA, Yoo JJ, Kim SG, Kim YS. Risk of dyslipidemia in chronic hepatitis B patients taking tenofovir alafenamide: a systematic review and meta‐analysis. Hepatol Int. 2023;17(4):860–869. [DOI] [PubMed] [Google Scholar]
- 9. Park JW, Yoo JJ, Kim SG, Kim YS. Response to letter to editor for risk of dyslipidemia in chronic hepatitis B patients taking tenofovir alafenamide: a systematic review and meta‐analysis. Hepatol Int. 2024;18(2):700–701. [DOI] [PubMed] [Google Scholar]
- 10. Nelson RH. Hyperlipidemia as a risk factor for cardiovascular disease. Prim Care. 2013;40(1):195–211. [DOI] [PMC free article] [PubMed] [Google Scholar]
- 11. Feeney ER, Mallon PW. HIV and HAART‐associated dyslipidemia. Open Cardiovasc Med J. 2011;5:49–63. [DOI] [PMC free article] [PubMed] [Google Scholar]
- 12. Abe K, Obara T, Kamio S, Kondo A, Imamura J, Goto T, et al. Renal function in Japanese HIV‐1‐positive patients who switch to tenofovir alafenamide fumarate after long‐term tenofovir disoproxil fumarate: a single‐center observational study. AIDS Res Ther. 2021;18(1):94. [DOI] [PMC free article] [PubMed] [Google Scholar]
- 13. Adachi E, Ikeuchi K, Koga M, Yotsuyanagi H. Changes in inflammatory biomarkers when switching from three‐drug regimens to dolutegravir plus lamivudine in people living with HIV. AIDS Res Hum Retroviruses. 2022;38(12):881–883. [DOI] [PubMed] [Google Scholar]
- 14. Alejos B, Suárez‐García I, Rava M, Bautista‐Hernández A, Gutierrez F, Dalmau D, et al. Effectiveness and safety of first‐line antiretroviral regimens in clinical practice: a multicentre cohort study. J Antimicrob Chemother. 2020;75(10):3004–3014. [DOI] [PubMed] [Google Scholar]
- 15. Atencio P, Conesa‐Buendía FM, Cabello‐Ubeda A, Lla‐Mas‐granda P, Pérez‐Tanoira R, Prieto‐Pérez L, et al. Bone deleterious effects of different NRTIs in treatment‐naïve HIV patients after 12 and 48 weeks of treatment. Curr HIV Res. 2021;19(5):434–447. [DOI] [PMC free article] [PubMed] [Google Scholar]
- 16. Baldin G, Ciccullo A, Lombardi F, D'Angelillo A, Dusina A, Emiliozzi A, et al. Short communication: comparing lamivudine+dolutegravir and bictegravir/emtricitabine/tenofovir alafenamide as switch strategies: preliminary results from clinical practice. AIDS Res Hum Retroviruses. 2021;37(6):429–432. [DOI] [PubMed] [Google Scholar]
- 17. Bendala‐Estrada AD, Diaz‐Almiron M, Busca C, Mican R, Cadiñanos J, Montes ML, et al. Change in metabolic parameters after switching from triple regimens with tenofovir alafenamide to dolutegravir‐based dual therapy. Bi‐lipid study. HIV Med. 2023;24(5):558–567. [DOI] [PubMed] [Google Scholar]
- 18. Bosch B, Akpomiemie G, Chandiwana N, Sokhela S, Hill A, McCann K, et al. Weight and metabolic changes after switching from tenofovir alafenamide (TAF)/emtricitabine (FTC)+dolutegravir (DTG), tenofovir disoproxil fumarate (TDF)/FTC+DTG and TDF/FTC/efavirenz (EFV) to TDF/lamivudine (3TC)/DTG. Clin Infect Dis. 2023:76(8):1492–1495. [DOI] [PubMed] [Google Scholar]
- 19. Brunet L, Mallon P, Fusco JS, Wohlfeiler MB, Prajapati G, Beyer A, et al. Switch from tenofovir disoproxil fumarate to tenofovir alafenamide in people living with HIV: lipid changes and statin underutilization. Clin Drug Investig. 2021;41(11):955–965. [DOI] [PMC free article] [PubMed] [Google Scholar]
- 20. Cid‐Silva P, Fernández‐Bargiela N, Margusino‐Framiñán L, Balboa‐Barreiro V, Mena‐De‐Cea Á, López‐Calvo S, et al. Treatment with tenofovir alafenamide fumarate worsens the lipid profile of HIV‐infected patients versus treatment with tenofovir disoproxil fumarate, each coformulated with elvitegravir, cobicistat, and emtricitabine. Basic Clin Pharmacol Toxicol. 2019;124(4):479–490. [DOI] [PubMed] [Google Scholar]
- 21. Daar ES, DeJesus E, Ruane P, Crofoot G, Oguchi G, Creticos C, et al. Efficacy and safety of switching to fixed‐dose bictegravir, emtricitabine, and tenofovir alafenamide from boosted protease inhibitor‐based regimens in virologically suppressed adults with HIV‐1: 48 week results of a randomised, open‐label, multicentre, phase 3, non‐inferiority trial. Lancet HIV. 2018;5(7):e347–e356. [DOI] [PubMed] [Google Scholar]
- 22. Dejesus E, Haas B, Segal‐Maurer S, Ramgopal MN, Mills A, Margot N, et al. Superior efficacy and improved renal and bone safety after switching from a tenofovir disoproxil fumarate‐ to a tenofovir alafenamide‐based regimen through 96 weeks of treatment. AIDS Res Hum Retroviruses. 2018;34(4):337–342. [DOI] [PubMed] [Google Scholar]
- 23. Eron JJ, Orkin C, Cunningham D, Pulido F, Post FA, De Wit S, et al. Week 96 efficacy and safety results of the phase 3, randomized EMERALD trial to evaluate switching from boosted‐protease inhibitors plus emtricitabine/tenofovir disoproxil fumarate regimens to the once daily, single‐tablet regimen of darunavir/cobicistat/emtricitabine/tenofovir alafenamide (D/C/F/TAF) in treatment‐experienced, virologically‐suppressed adults living with HIV‐1. Antiviral Res. 2019;170:104543. [DOI] [PubMed] [Google Scholar]
- 24. Eron JJ, Orkin C, Gallant J, Molina JM, Negredo E, Antinori A, et al. A week‐48 randomized phase‐3 trial of darunavir/cobicistat/emtricitabine/tenofovir alafenamide in treatment‐naive HIV‐1 patients. AIDS. 2018;32(11):1431–1442. [DOI] [PMC free article] [PubMed] [Google Scholar]
- 25. Funderburg NT, McComsey GA, Kulkarni M, Bannerman T, Mantini J, Thornton B, et al. Equivalent decline in inflammation markers with tenofovir disoproxil fumarate vs. tenofovir alafenamide. EBioMedicine. 2016;13:321–327. [DOI] [PMC free article] [PubMed] [Google Scholar]
- 26. Gallant J, Lazzarin A, Mills A, Orkin C, Podzamczer D, Tebas P, et al. Bictegravir, emtricitabine, and tenofovir alafenamide versus dolutegravir, abacavir, and lamivudine for initial treatment of HIV‐1 infection (GS‐US‐380‐1489): a double‐blind, multicentre, phase 3, randomised controlled non‐inferiority trial. Lancet. 2017;390(10107):2063–2072. [DOI] [PubMed] [Google Scholar]
- 27. Giacomelli A, Conti F, Pezzati L, Oreni L, Ridolfo AL, Morena V, et al. Impact of switching to TAF/FTC/RPV, TAF/FTC/EVG/cobi and ABC/3TC/DTG on cardiovascular risk and lipid profile in people living with HIV: a retrospective cohort study. BMC Infect Dis. 2021;21(1):595. [DOI] [PMC free article] [PubMed] [Google Scholar]
- 28. Gilbert JM, Vest K, Kish TD. Long‐term evaluation of changes in kidney function after switching from tenofovir disoproxil fumarate to tenofovir alafenamide in patients living with HIV. Pharmacy (Basel). 2022;10(6). [DOI] [PMC free article] [PubMed] [Google Scholar]
- 29. Hagins D, Kumar P, Saag M, Wurapa AK, Brar I, Berger D, et al. Switching to bictegravir/emtricitabine/tenofovir alafenamide in Black Americans with HIV‐1: a randomized phase 3b, multicenter, open‐label study. J Acquir Immune Defic Syndr. 2021;88(1):86–95. [DOI] [PMC free article] [PubMed] [Google Scholar]
- 30. Huhn GD, Shamblaw DJ, Baril JG, Hsue PY, Mills BL, Nguyen‐Cleary T, et al. Atherosclerotic cardiovascular disease risk profile of tenofovir alafenamide versus tenofovir disoproxil fumarate. Open Forum Infect Dis. 2020;7(1):ofz472. [DOI] [PMC free article] [PubMed] [Google Scholar]
- 31. Ikeda M, Wakabayashi Y, Okamoto K, Yanagimoto S, Okugawa S, Moriya K. Changing trends in lipid profile and biomarkers of renal function and bone metabolism before and after switching from tenofovir disoproxil fumarate to tenofovir alafenamide: a prospective observational study. AIDS Res Ther. 2021;18(1):30. [DOI] [PMC free article] [PubMed] [Google Scholar]
- 32. Kanda N, Okamoto K, Okumura H, Mieno M, Sakashita K, Sasahara T, et al. Outcomes associated with treatment change from tenofovir disoproxil fumarate to tenofovir alafenamide in HIV‐1‐infected patients: a real‐world study in Japan. HIV Med. 2021;22(6):457–466. [DOI] [PMC free article] [PubMed] [Google Scholar]
- 33. Kauppinen KJ, Aho I, Sutinen J. Switching from tenofovir alafenamide to tenofovir disoproxil fumarate improves lipid profile and protects from weight gain. AIDS. 2022;36(10):1337–1344. [DOI] [PubMed] [Google Scholar]
- 34. Kauppinen KJ, Kivelä P, Sutinen J. Switching from tenofovir disoproxil fumarate to tenofovir alafenamide significantly worsens the lipid profile in a real‐world setting. AIDS Patient Care STDs. 2019;33(12):500–506. [DOI] [PubMed] [Google Scholar]
- 35. Kim J, Nam HJ, Jung YJ, Lee HJ, Kim SE, Kang SJ, et al. Weight gain and lipid profile changes in Koreans with human immunodeficiency virus undergoing integrase strand transfer inhibitor‐based regimens. Infect Chemother. 2022;54(3):419–432. [DOI] [PMC free article] [PubMed] [Google Scholar]
- 36. Kityo C, Hagins D, Koenig E, Avihingsanon A, Chetchotisakd P, Supparatpinyo K, et al. Switching to fixed‐dose bictegravir, emtricitabine, and tenofovir alafenamide (B/F/TAF) in virologically suppressed HIV‐1 infected women: a randomized, open‐label, multicenter, active‐controlled, phase 3, noninferiority trial. J Acquir Immune Defic Syndr. 2019;82(3):321–328. [DOI] [PubMed] [Google Scholar]
- 37. Kovari H, Surial B, Tarr PE, Cavassini M, Calmy A, Schmid P, et al. Changes in alanine aminotransferase levels after switching from tenofovir disoproxil fumarate (TDF) to tenofovir alafenamide (TAF) in HIV‐positive people without viral hepatitis in the Swiss HIV Cohort Study. HIV Med. 2021;22(7):623–628. [DOI] [PubMed] [Google Scholar]
- 38. Kuo PH, Sun HY, Chuang YC, Wu PY, Liu WC, Hung CC. Weight gain and dyslipidemia among virally suppressed HIV‐positive patients switching to co‐formulated elvitegravir/cobicistat/emtricitabine/tenofovir alafenamide. Int J Infect Dis. 2020;92:71–77. [DOI] [PubMed] [Google Scholar]
- 39. Lacey A, Savinelli S, Barco EA, Macken A, Cotter AG, Sheehan G, et al. Investigating the effect of antiretroviral switch to tenofovir alafenamide on lipid profiles in people living with HIV. AIDS. 2020;34(8):1161–1170. [DOI] [PubMed] [Google Scholar]
- 40. Lagoutte‐Renosi J, Flammang M, Chirouze C, Beck‐Wirth G, Bozon F, Brunel AS, et al. Real‐life impact on lipid profile of a switch from tenofovir disoproxil fumarate to tenofovir alafenamide in HIV‐infected patients. Curr HIV Res. 2021;19(1):84–89. [DOI] [PubMed] [Google Scholar]
- 41. Lazzaro A, Cacciola EG, Borrazzo C, Innocenti GP, Cavallari EN, Mezzaroma I, et al. Switching to a bictegravir single tablet regimen in elderly people living with HIV‐1: data analysis from the BICTEL Cohort. Diagnostics (Basel). 2021;12(1):76. [DOI] [PMC free article] [PubMed] [Google Scholar]
- 42. Maggiolo F, Rizzardini G, Molina JM, Pulido F, De Wit S, Vandekerckhove L, et al. Bictegravir/emtricitabine/tenofovir alafenamide in virologically suppressed people with HIV aged ≥ 65 years: week 48 results of a phase 3b, open‐label trial. Infect Dis Ther. 2021;10(2):775–788. [DOI] [PMC free article] [PubMed] [Google Scholar]
- 43. Maggiolo F, Rizzardini G, Raffi F, Pulido F, Mateo‐Garcia MG, Molina JM, et al. Bone mineral density in virologically suppressed people aged 60 years or older with HIV‐1 switching from a regimen containing tenofovir disoproxil fumarate to an elvitegravir, cobicistat, emtricitabine, and tenofovir alafenamide single‐tablet regimen: a multicentre, open‐label, phase 3b, randomised trial. Lancet HIV. 2019;6(10):e655–e666. [DOI] [PubMed] [Google Scholar]
- 44. Martínez‐Sanz J, Serrano‐Villar S, Muriel A, García Fraile LJ, Orviz E, Mena de Cea Á, et al. Metabolic‐related outcomes after switching from tenofovir disoproxil fumarate to tenofovir alafenamide in adults with human immunodeficiency virus (HIV): a multicenter prospective cohort study. Clin Infect Dis. 2023;76(3):e652–e660. [DOI] [PubMed] [Google Scholar]
- 45. Mazzitelli M, Trunfio M, Putaggio C, Sasset L, Leoni D, Lo Menzo S, et al. Viro‐immunological, clinical outcomes and costs of switching to BIC/TAF/FTC in a cohort of people living with HIV: a 48‐week prospective analysis. Biomedicines. 2022;10(8):1823. [DOI] [PMC free article] [PubMed] [Google Scholar]
- 46. Milinkovic A, Berger F, Arenas‐Pinto A, Mauss S. Reversible effect on lipids by switching from tenofovir disoproxil fumarate to tenofovir alafenamide and back. AIDS. 2019;33(15):2387–2391. [DOI] [PubMed] [Google Scholar]
- 47. Molina JM, Ward D, Brar I, Mills A, Stellbrink HJ, López‐Cortés L, et al. Switching to fixed‐dose bictegravir, emtricitabine, and tenofovir alafenamide from dolutegravir plus abacavir and lamivudine in virologically suppressed adults with HIV‐1: 48 week results of a randomised, double‐blind, multicentre, active‐controlled, phase 3, non‐inferiority trial. Lancet HIV. 2018;5(7):e357–e365. [DOI] [PubMed] [Google Scholar]
- 48. Moschopoulos CD, Protopapas K, Thomas K, Kavatha D, Papadopoulos A, Antoniadou A. Switching from tenofovir disoproxil to tenofovir alafenamide fumarate: impact on cardiovascular risk and lipid profile in people living with HIV, an observational study. AIDS Res Hum Retroviruses. 2023;39(2):68–75. [DOI] [PubMed] [Google Scholar]
- 49. Orkin C, DeJesus E, Sax PE, Arribas JR, Gupta SK, Martorell C, et al. Fixed‐dose combination bictegravir, emtricitabine, and tenofovir alafenamide versus dolutegravir‐containing regimens for initial treatment of HIV‐1 infection: week 144 results from two randomised, double‐blind, multicentre, phase 3, non‐inferiority trials. Lancet HIV. 2020;7(6):e389–e400. [DOI] [PubMed] [Google Scholar]
- 50. Orkin C, Eron JJ, Rockstroh J, Podzamczer D, Esser S, Vandekerckhove L, et al. Week 96 results of a phase 3 trial of darunavir/cobicistat/emtricitabine/tenofovir alafenamide in treatment‐naive HIV‐1 patients. AIDS. 2020;34(5):707–718. [DOI] [PubMed] [Google Scholar]
- 51. Orkin C, Molina JM, Negredo E, Arribas JR, Gathe J, Eron JJ, et al. Efficacy and safety of switching from boosted protease inhibitors plus emtricitabine and tenofovir disoproxil fumarate regimens to single‐tablet darunavir, cobicistat, emtricitabine, and tenofovir alafenamide at 48 weeks in adults with virologically suppressed HIV‐1 (EMERALD): a phase 3, randomised, non‐inferiority trial. Lancet HIV. 2018;5(1):e23–e34. [DOI] [PubMed] [Google Scholar]
- 52. Petrakis V, Panagopoulos P, Papachristou S, Papanas N, Terzi I, Trypsianis G, et al. Tenofovir alafenamide fumarate therapy for HIV treatment: cardiometabolic and renal safety. AIDS Res Hum Retroviruses. 2020;36(9):697–702. [DOI] [PubMed] [Google Scholar]
- 53. Plum PE, Maes N, Sauvage AS, Frippiat F, Meuris C, Uurlings F, et al. Impact of switch from tenofovir disoproxil fumarate‐based regimens to tenofovir alafenamide‐based regimens on lipid profile, weight gain and cardiovascular risk score in people living with HIV. BMC Infect Dis. 2021;21(1):910. [DOI] [PMC free article] [PubMed] [Google Scholar]
- 54. Podzamczer D, Mican R, Tiraboschi J, Portilla J, Domingo P, Llibre JM, et al. Darunavir/cobicistat/emtricitabine/tenofovir alafenamide versus dolutegravir/abacavir/lamivudine in antiretroviral‐naive adults (SYMTRI): a multicenter randomized open‐label study (PReEC/RIS‐57). Open Forum Infect Dis. 2022;9(3). [DOI] [PMC free article] [PubMed] [Google Scholar]
- 55. Rizzardini G, Gori A, Miralles C, Olalla J, Molina JM, Raffi F, et al. Randomized study evaluating the efficacy and safety of switching from an abacavir/lamivudine‐based regimen to an elvitegravir/cobicistat/emtricitabine/tenofovir alafenamide single‐tablet regimen. AIDS. 2019;33(10):1583–1593. [DOI] [PubMed] [Google Scholar]
- 56. Rolle CP, Nguyen V, Hinestrosa F, DeJesus E. Clinical outcomes of HIV‐1 infected patients switched from complex multi‐tablet regimens to tenofovir alafenamide based single‐tablet regimens plus a boosted protease inhibitor in a real‐world setting. J Virus Erad. 2020;6(4):100021. [DOI] [PMC free article] [PubMed] [Google Scholar]
- 57. Rolle CP, Nguyen V, Patel K, Cruz D, DeJesus E, Hinestrosa F. Real‐world efficacy and safety of switching to bictegravir/emtricitabine/tenofovir alafenamide in older people living with HIV. Medicine (United States). 2021;100(38):e27330. [DOI] [PMC free article] [PubMed] [Google Scholar]
- 58. Sax PE, Zolopa A, Brar I, Elion R, Ortiz R, Post F, et al. Tenofovir alafenamide vs. tenofovir disoproxil fumarate in single tablet regimens for initial HIV‐1 therapy: a randomized phase 2 study. J Acquir Immune Defic Syndr. 2014;67(1):52–58. [DOI] [PubMed] [Google Scholar]
- 59. Schafer JJ, Sassa KN, O'Connor JR, Shimada A, Keith SW, DeSimone JA. Changes in body mass index and atherosclerotic disease risk score after switching from tenofovir disoproxil fumarate to tenofovir alafenamide. Open Forum Infect Dis. 2019;6(10):ofz414. [DOI] [PMC free article] [PubMed] [Google Scholar]
- 60. Schafer JJ, Zimmerman M, Walshe C, Cerankowski J, Shimada A, Keith SW. Weight changes in patients with sustained viral suppression switching tenofovir disoproxil fumarate to tenofovir alafenamide. Obesity (Silver Spring). 2022;30(6):1197–1204. [DOI] [PubMed] [Google Scholar]
- 61. Schwarze‐Zander C, Piduhn H, Boesecke C, Schlabe S, Stoffel‐Wagner B, Wasmuth JC, et al. Switching tenofovir disoproxil fumarate to tenofovir alafenamide in a real life setting: what are the implications? HIV Med. 2020;21(6):378–385. [DOI] [PubMed] [Google Scholar]
- 62. Sekiya R, Muramatsu T, Ichiki A, Chikasawa Y, Bingo M, Yotsumoto M, et al. Young age is a key determinant of body weight gain after switching from tenofovir disoproxil fumarate to tenofovir alafenamide in Japanese people living with HIV. J Infect Chemother. 2023;29(2):171–178. [DOI] [PubMed] [Google Scholar]
- 63. Shokoohi M, Gupta M, Crouzat F, Smith G, Kovacs C, Brunetta J, et al. Changes in renal and metabolic indices after switching from tenofovir disoproxil fumarate‐ to tenofovir alafenamide‐containing ART among individuals with HIV in Canada: a retrospective study. Int J STD AIDS. 2021;32(9):861–871. [DOI] [PubMed] [Google Scholar]
- 64. Squillace N, Ricci E, Menzaghi B, De Socio GV, Passerini S, Martinelli C, et al. The effect of switching from tenofovir disoproxil fumarate (TDF) to tenofovir alafenamide (TAF) on liver enzymes, glucose, and lipid profile. Drug Des Devel Ther. 2020;14:5515–5520. [DOI] [PMC free article] [PubMed] [Google Scholar]
- 65. Sun L, He Y, Xu L, Zhao F, Zhou Y, Zhang L, et al. Higher risk of dyslipidemia with coformulated elvitegravir, cobicistat, emtricitabine, and tenofovir alafenamide than efavirenz, lamivudine, and tenofovir disoproxil fumarate among antiretroviral‐naive people living with HIV in China. J Acquir Immune Defic Syndr. 2022;91(S1):S8–S15. [DOI] [PubMed] [Google Scholar]
- 66. Surial B, Mugglin C, Calmy A, Cavassini M, Günthard HF, Stöckle M, et al. Weight and metabolic changes after switching from tenofovir disoproxil fumarate to tenofovir alafenamide in people living with HIV: a cohort study. Ann Intern Med. 2021;174(6):758–767. [DOI] [PubMed] [Google Scholar]
- 67. Tabak F, Zerdali E, Altuntaş O, Gunduz A, Bolukcu S, Mete B, et al. Efficacy and safety of co‐formulated elvitegravir/cobicistat/emtricitabine/tenofovir alafenamide in HIV‐positive patients: real‐world data. Int J STD AIDS. 2021;32(6):562–569. [DOI] [PubMed] [Google Scholar]
- 68. Taramasso L, Di Biagio A, Riccardi N, Briano F, Di Filippo E, Comi L, et al. Lipid profile changings after switching from rilpivirine/tenofovir disoproxil fumarate/emtricitabine to rilpivirine/tenofovir alafenamide/emtricitabine: different effects in patients with or without baseline hypercholesterolemia. PLoS One. 2019;14(10):e0223181. [DOI] [PMC free article] [PubMed] [Google Scholar]
- 69. Van Wyk J, Ajana F, Bisshop F, De Wit S, Osiyemi O, Portilla Sogorb J, et al. Efficacy and safety of switching to dolutegravir/lamivudine fixed‐dose 2‐drug regimen vs continuing a tenofovir alafenamide‐based 3‐or 4‐drug regimen for maintenance of virologic suppression in adults living with human immunodeficiency virus type 1: phase 3, randomized, noninferiority TANGO Study. Clin Infect Dis. 2020;71(8):1920–1929. [DOI] [PMC free article] [PubMed] [Google Scholar]
- 70. Verburgh ML, Wit FWNM, Boyd A, Verboeket SO, Reiss P, Van Der Valk M. One in 10 virally suppressed persons with HIV in The Netherlands experiences ≥10% weight gain after switching to tenofovir alafenamide and/or integrase strand transfer inhibitor. Open Forum Infect Dis. 2022;9(7):ofac291. [DOI] [PMC free article] [PubMed] [Google Scholar]
- 71. Walti LN, Steinrücken J, Rauch A, Wandeler G. Tenofovir alafenamide in multimorbid HIV‐infected patients with prior tenofovir‐associated renal toxicity. Open Forum Infect Dis. 2018;5(11):ofy275. [DOI] [PMC free article] [PubMed] [Google Scholar]
- 72. Winston A, Post FA, DeJesus E, Podzamczer D, Di Perri G, Estrada V, et al. Tenofovir alafenamide plus emtricitabine versus abacavir plus lamivudine for treatment of virologically suppressed HIV‐1‐infected adults: a randomised, double‐blind, active‐controlled, non‐inferiority phase 3 trial. Lancet HIV. 2018;5(4):e162–e171. [DOI] [PubMed] [Google Scholar]
- 73. Wohl D, Oka S, Clumeck N, Clarke A, Brinson C, Stephens J, et al. A randomized, double‐blind comparison of tenofovir alafenamide versus tenofovir disoproxil fumarate, each coformulated with elvitegravir, cobicistat, and emtricitabine for initial HIV‐1 treatment: week 96 results. J Acquir Immune Defic Syndr. 2016;72(1):58–64. [DOI] [PubMed] [Google Scholar]
- 74. Xia H, Huang XJ, Hu Y, Gao LY, Wu Y, Wu H, et al. Switching from efavirenz to elvitegravir/cobicistat/emtricitabine/tenofovir alafenamide reduces central nervous system symptoms in people living with HIV. Chin Med J (Engl). 2021;134(23):2850–2856. [DOI] [PMC free article] [PubMed] [Google Scholar]
- 75. Huang DQ, El‐Serag HB, Loomba R. Global epidemiology of NAFLD‐related HCC: trends, predictions, risk factors and prevention. Nat Rev Gastroenterol Hepatol. 2021;18(4):223–238. [DOI] [PMC free article] [PubMed] [Google Scholar]
- 76. Fontas E, van Leth F, Sabin CA, Friis‐Moller N, Rickenbach M, d'Arminio Monforte A, et al. Lipid profiles in HIV‐infected patients receiving combination antiretroviral therapy: are different antiretroviral drugs associated with different lipid profiles? J Infect Dis. 2004;189(6):1056–1074. [DOI] [PubMed] [Google Scholar]
- 77. The effect tenofovir disoproxil fumarate (TDF) and tenofovir alafenamide (TAF) on small intestine gut wall. https://classic.clinicaltrials.gov/show/NCT05326971 Jul‐17‐2024.
- 78. Lin HY, Tseng TC. Dyslipidemia in chronic hepatitis B patients on tenofovir alafenamide: facts and puzzles. Clin Mol Hepatol. 2022;28(2):181–182. [DOI] [PMC free article] [PubMed] [Google Scholar]
- 79. Jeong J, Shin JW, Jung SW, Park EJ, Park NH. Tenofovir alafenamide treatment may not worsen the lipid profile of chronic hepatitis B patients: a propensity score‐matched analysis. Clin Mol Hepatol. 2022;28(2):254–264. [DOI] [PMC free article] [PubMed] [Google Scholar]
- 80. Shaheen AA, AlMattooq M, Yazdanfar S, Burak KW, Swain MG, Congly SE, et al. Tenofovir disoproxil fumarate significantly decreases serum lipoprotein levels compared with entecavir nucleos(t)ide analogue therapy in chronic hepatitis B carriers. Aliment Pharmacol Ther. 2017;46(6):599–604. [DOI] [PubMed] [Google Scholar]
- 81. Lampertico P, Buti M, Fung S, Ahn SH, Chuang WL, Tak WY, et al. Switching from tenofovir disoproxil fumarate to tenofovir alafenamide in virologically suppressed patients with chronic hepatitis B: a randomised, double‐blind, phase 3, multicentre non‐inferiority study. Lancet Gastroenterol Hepatol. 2020;5(5):441–453. [DOI] [PubMed] [Google Scholar]
- 82. Mills A, Arribas JR, Andrade‐Villanueva J, DiPerri G, Van Lunzen J, Koenig E, et al. Switching from tenofovir disoproxil fumarate to tenofovir alafenamide in antiretroviral regimens for virologically suppressed adults with HIV‐1 infection: a randomised, active‐controlled, multicentre, open‐label, phase 3, non‐inferiority study. Lancet Infect Dis. 2016;16(1):43–52. [DOI] [PubMed] [Google Scholar]
- 83. Suzuki K, Suda G, Yamamoto Y, Furuya K, Baba M, Nakamura A, et al. Tenofovir‐disoproxil‐fumarate modulates lipid metabolism via hepatic CD36/PPAR‐alpha activation in hepatitis B virus infection. J Gastroenterol. 2021;56(2):168–180. [DOI] [PubMed] [Google Scholar]
- 84. Silverstein RL, Febbraio M. CD36, a scavenger receptor involved in immunity, metabolism, angiogenesis, and behavior. Sci Signal. 2009;2(72):re3. [DOI] [PMC free article] [PubMed] [Google Scholar]
- 85. Koonen DP, Jacobs RL, Febbraio M, Young ME, Soltys CL, Ong H, et al. Increased hepatic CD36 expression contributes to dyslipidemia associated with diet‐induced obesity. Diabetes. 2007;56(12):2863–2871. [DOI] [PubMed] [Google Scholar]
- 86. Luangrath V, Brodeur MR, Rhainds D, Brissette L. Mouse CD36 has opposite effects on LDL and oxidized LDL metabolism in vivo. Arterioscler Thromb Vasc Biol. 2008;28(7):1290–1295. [DOI] [PubMed] [Google Scholar]
- 87. Brundert M, Heeren J, Merkel M, Carambia A, Herkel J, Groitl P, et al. Scavenger receptor CD36 mediates uptake of high density lipoproteins in mice and by cultured cells. J Lipid Res. 2011;52(4):745–758. [DOI] [PMC free article] [PubMed] [Google Scholar]
- 88. Łomiak M, Gajek Z, Stępnicki J, Lembas A, Mikuła T, Wiercińska‐Drapało A. Lipid profile after switching from a TDF (tenofovir disoproxil)‐containing to TAF (tenofovir alafenamide)‐containing regimen in virologically suppressed people living with HIV. J Med Sci. 2023;92(4):e808. [Google Scholar]
Associated Data
This section collects any data citations, data availability statements, or supplementary materials included in this article.
Supplementary Materials
Figure S1. Forest plots and funnel plots of Table 2
Figure S2. Forest plots and funnel plots of Table 5
Figure S3. Forest plots and funnel plots of Table 6
Figure S4. Forest plots and funnel plots of Table 7
Data Availability Statement
The datasets generated during and/or analysed during the current study are available from the corresponding author upon reasonable request.