

SUMMARY
Sculpting a flat patch of membrane into an endocytic vesicle requires curvature generation on the cell surface, which is the primary function of endocytic machinery. Using super-resolved live cell fluorescence imaging, we demonstrate that curvature generation by individual clathrin-coated pits can be detected in real time within cultured cells and tissues of developing organisms. Our analyses demonstrate that the footprint of clathrin coats increases monotonically during formation of pits at different levels of plasma membrane tension. These findings are only compatible with models that predict curvature generation at the early stages of endocytic clathrin pit formation. We also found that CALM adaptors associated with clathrin plaques form clusters, whereas AP2 distribution is more homogenous. Considering the curvature sensing and driving roles of CALM, we propose that CALM clusters may increase the strain on clathrin lattices locally, eventually giving rise to rupture and subsequent pit completion at the edges of plaques.
INTRODUCTION
Clathrin-mediated endocytosis is the most extensively studied internalization mechanism of membrane lipids and proteins from the cell surface (Conner and Schmid, 2003; McMahon and Boucrot, 2011). Assembly of clathrin coats on the plasma membrane generates the curvature required for formation of endocytic vesicles. Over the past decades, a multitude of biophysical and biochemical methodologies have been employed to elucidate the structural and dynamic properties of endocytic clathrin coats (Robinson, 2015). However, fundamental aspects of clathrin-mediated endocytosis remain controversial due to a lack of experimental approaches that allow correlation of ultra-structural and dynamic properties of assembling clathrin coats.
Clathrin triskelions can assemble into polyhedral cages and hexagonal lattices in seemingly infinite numbers of geometries upon their recruitment to the plasma membrane by a range of adaptor proteins including adaptor protein 2 (AP2) and clathrin assembly lymphoid myeloid leukemia protein (CALM) (Heuser, 1980, 1989; Miller et al., 2015; Sochacki et al., 2017; Willy et al., 2021). Based on their structural and dynamic properties, endocytic clathrin coats can be categorized into pits, abortives, and plaques (Ehrlich et al., 2004; Loerke et al., 2009; Maupin and Pollard, 1983; Saffarian et al., 2009). Clathrin-coated pits are highly curved structures with hexagonal and pentagonal faces. They are internalized in the form of coated vesicles within a few minutes of their nucleation at the plasma membrane (Aguet et al., 2013; Cocucci et al., 2012; Ehrlich et al., 2004) (Fig. 1A). Due to their small size (100–200 nm in diameter), clathrin pits appear as diffraction-limited spots under conventional fluorescence imaging (Kural and Kirchhausen, 2012; Kural et al., 2012). The abortive population constitutes the majority of the clathrin-coated structures detected in live-cell fluorescence microscopy assays conducted at the adherent surface of cultured cells (Bhave et al., 2020). Abortives are short-lived structures (<20 seconds) that disassemble prematurely (i.e. prior to growing into clathrin-coated pits) and, therefore, carry out no endocytic functions (Ehrlich et al., 2004; Loerke et al., 2009). The third subset, plaques, appear larger and brighter than clathrin-coated pits in fluorescence live cell acquisitions (Saffarian et al., 2009) and are believed to correspond to extended, flat hexagonal lattices that are observed under electron microscopy (Grove et al., 2014; Heuser, 1989). The abundance of plaques in cultured cells is dependent on several factors, including cell-substrate adhesion strength (Akisaka and Yoshida, 2021; Batchelder and Yarar, 2010; Heuser, 1989), substrate rigidity (Baschieri et al., 2018), hypotonic swelling (Heuser, 1989), expression levels of adaptor protein 2 (AP2) (Dambournet et al., 2018) and alternative splicing of clathrin heavy chain (Moulay et al., 2020). Recent applications of live-cell super-resolved fluorescence imaging revealed that in certain cell types, instead of extended flat lattices, plaques appear as dynamic aggregates from which individual clathrin pits occasionally detach (Li et al., 2015).
Figure 1. Flat-to-curved transition necessitates a substantial change in the projected area of clathrin coats.

A. Schematics depicting the cross-sections of clathrin coats as suggested by the prevalent curvature generation models. According to the flat-to-curved transition models (upper), the clathrin coat initially grows into a flat hexagonal lattice constituting 70–100% of the final surface area of the coated vesicle (; is the radius of the pit/vesicle). A disc-shaped, flat clathrin lattice is anticipated to reach a diameter of prior to the transition into a clathrin dome (Avinoam et al., 2015; Bucher et al., 2018; Heuser, 1980). Upon this transition, the projected coat area reduces to . On the other hand, the constant curvature model (lower) predicts a gradual increase in the projected coat area until the diameter reaches , which is also the diameter of the clathrin dome/pit/vesicle. B. 140 triskelions are assembled into a T=7 polyhedron through a flat-to-curved transition (marked by green arrow) taking place at 70% of growth (upper panel) and as predicted by the constant curvature model (lower panel; Video S2). Pentagonal faces are highlighted in pink. C. Snapshots of high-NA TIRF-SIM simulations correspond to the distinct completion levels of T=7 clathrin coats in (B). Detected boundaries are shown by the black demarcations for both flat-to-curved transition and constant curvature models. D. 180 triskelions are assembled into a T=9 polyhedron through a flat-to-curved transition (marked by green arrow) taking place at 70% of growth (upper panel) and as predicted by the constant curvature model (lower panel; Video S3). Pentagonal faces are highlighted in pink. E. Snapshots of high-NA TIRF-SIM simulations correspond to the distinct completion levels of T=9 clathrin coats in (D). Detected boundaries are shown by the black demarcations for both flat-to-curved transition and constant curvature models. F. Detected area of the structures obtained from high-NA TIRF-SIM simulations (C & E) are plotted with respect to number of incorporated triskelions for both models. Green arrows mark the reduction in the detected area upon the proposed flat-to-curved transition at 70% of coat growth. Black arrowheads mark incorporation of pentagonal faces predicted in the constant curvature model. The difference between the two models is evident independent of the distance between the coverslip and the coat (Fig. S2). Scale bars, 100 nm.
The formation of endocytic vesicles requires curvature generation during the lifespan of clathrin coats. However, how and at what point of its growth a clathrin coat develops curvature has been a matter of debate for almost four decades (Kirchhausen, 1993, 2009; Lampe et al., 2016). Currently, there are two competing and extreme models as to how clathrin and its accessory proteins generate curvature that leads to the formation of de novo clathrin-coated pits, i.e. the population of pits that are independent and spatially isolated from other clathrin coats throughout their initiation, maturation and internalization (Video S1) (Chen and Schmid, 2020). It was originally proposed that clathrin initially grows into a flat hexagonal array on the plasma membrane, prior to transitioning into a curved coat (Heuser, 1980; Larkin et al., 1986) (Fig. 1A, top). This flat growth is postulated to reach 70–100% of the structure’s final surface area before remodeling into a clathrin-coated pit through transformation of the hexagonal clathrin lattice into a curved polyhedron with pentagonal and hexagonal faces (Avinoam et al., 2015; Bucher et al., 2018; Heuser, 1980). Eventually, 12 pentagonal faces must be introduced to generate a closed clathrin cage (Musacchio et al., 1999; Shraiman, 1997) (Fig. 1B & D). This model was rejected by others because insertion of even a single pentagonal face into a hexagonal lattice requires a substantial structural rearrangement (Heuser, 1980), which is energetically unfavorable (Kirchhausen, 1993, 2009; Kirchhausen et al., 2014). As an alternative, it was suggested that clathrin-coated pits form gradually without complex topological changes. According to this model, as clathrin triskelions are recruited into an assembling coat, they organize into pentagonal as well as hexagonal faces to generate a constant amount of curvature (Fig. 1A, bottom). The debate regarding curvature formation by clathrin coats has been recently rekindled by studies employing correlative fluorescence and electron microscopy of clathrin-coated structures (Avinoam et al., 2015; Bucher et al., 2018; Lampe et al., 2016; Sochacki and Taraska, 2019).
Utilizing an experimental approach that offers high resolution in both spatial and temporal domains is essential for determining the structural changes that clathrin coats undergo during the formation of endocytic pits. Electron microscopy provides high-resolution snapshots of clathrin-coated structures with different curvature levels (Avinoam et al., 2015; Bucher et al., 2018; Heuser, 1980; Sochacki et al., 2017). However, due to the lack of a temporal dimension, electron micrographs fail to provide direct evidence for the mechanism of clathrin-driven curvature generation in live cells. Another major shortcoming of this approach is the inability to distinguish distinct populations of clathrin-coated structures, i.e. abortives, plaques and de novo clathrin pits at different growth/completion levels. Conventional live cell fluorescence imaging allowed researchers to elucidate the formation and dissolution dynamics of endocytic clathrin coats in living cells (Aguet et al., 2013; Ferguson et al., 2016; Kural and Kirchhausen, 2012; Kural et al., 2012). In these studies, the structural properties of clathrin coats are obscured by diffraction, which limits spatial resolution. Nevertheless, the diffraction limit in fluorescence imaging can be circumvented by recently developed superresolution microscopy techniques, such as Stochastic Optical Reconstruction Microscopy (STORM) and Structured Illumination Microscopy (SIM). In these assays, curved clathrin coats (i.e. dome structures and pits) appear as rings, which correspond to the two-dimensional projection of the spheroid coat (Bates et al., 2007; Fiolka et al., 2012; Huang et al., 2008; Li et al., 2015). Since these techniques are applicable for live cell imaging, they allow distinguishing de novo clathrin-coated pits from other populations (i.e. abortives and pits associated with plaques) and monitoring their structural changes during curvature generation (Video S1).
Here we used structured illumination microscopy in the total internal reflection fluorescence mode (TIRF-SIM) to image endocytic clathrin-coat dynamics in live cells and tissues. The enhanced resolution in both spatial and temporal domains allowed us to monitor curvature generation by de novo clathrin-coated pits in real time. Detailed analyses of the footprint and the fluorescence intensity of assembling clathrin pits have revealed that these structures do not undergo the major structural rearrangements required by the flat-to-curved transition models even under increased membrane tension. Overall, our results show that curvature is generated at the very early stages of clathrin coat formation, in good agreement with the constant curvature model.
Endocytic clathrin pit formation can also be observed at the edges of flat lattices (Heuser et al., 1987; Hoffmann et al., 2010). A separate model was proposed for this population of pits, where coat fragments can break loose from plaques and gain curvature to transition into clathrin-coated pits (Lampe et al., 2016; den Otter and Briels, 2011). Super-resolved imaging allowed us to delineate the spatial distributions of major clathrin adaptors beneath plaques. We found that CALM adaptors within plaques form clusters that are similar in size to de novo clathrin pits, whereas the AP2 distribution is more homogenous. Considering the curvature sensing and driving roles of CALM (Miller et al., 2015; Willy et al., 2021), our results support a model where CALM clusters increase the strain on clathrin lattices, eventually giving rise to rupture and subsequent pit formation at the edges of clathrin plaques.
RESULTS
Flat-to-curved transition necessitates a significant decrease in the footprint of clathrin coats prior to formation of pits.
One of the major observables that distinguish the flat-to-curved transition and constant curvature models is the change in the projected area (i.e., footprint) of the clathrin coat during invagination (Bucher et al., 2018; Ferguson et al., 2016). While the constant curvature model predicts a steady rise in the projected area of the coat on the imaging plane, the flat-to-curved transition requires an abrupt three- to four-fold reduction in the same measure prior to formation of pits, corresponding to transition at 70% (Bucher et al., 2018) or 100% of coat growth (Avinoam et al., 2015; Heuser, 1980) as proposed in previous studies. To demonstrate this, we adapted a previously described self-assembly model to simulate growth of clathrin polyhedra with triangulation (T) numbers of 7 and 9 (Figure 1B-F; Videos S2 & S3) (Li et al., 2018). We chose to work with these specific geometries as their dimensions are in good agreement with clathrin pits reported in previous electron microscopy studies (Avinoam et al., 2015; Bucher et al., 2018; Heuser, 1980; Miller et al., 2015; Sochacki et al., 2017). In Figure 1B, 140 triskelions are assembled into a T=7 polyhedron (60 hexagons and 12 pentagons; ~137 nm diameter and ~14,700 nm2 final projected coat area) via a flat-to-curved transition taking place at 70% of completion (as suggested by Bucher et al. (Bucher et al., 2018); upper panel), and as predicted by the constant curvature model (lower panel). The size of the simulated T=7 polyhedron is an accurate representation of clathrin-coated pits detected in BSC-1 cells (Bucher et al., 2018), human embryonic stem cells (hESCs) and derived neuronal progenitor cells (NPCs) (Dambournet et al., 2018). Figure 1D shows the assembly of a larger polyhedron (T=9) comprising 180 triskelions (80 hexagons and 12 pentagons; ~156 nm diameter and ~19,100 nm2 final projected coat area) using both models. The large footprint of the T=9 polyhedon is a good representation of clathrin-coated pits detected in fibroblasts differentiated from hESCs (Dambournet et al., 2018). In both scenarios, the flat-to-curved transition results in significant decrease in the footprint of the clathrin coat upon formation of clathrin domes/pits (Figure 1B & D; marked by green arrows). Note that the change in the footprint would be even more pronounced if the transition took place after the full assembly (100% completion) of the coat, as proposed earlier (i.e., constant area model) (Avinoam et al., 2015).
Using the triskelion coordinates in our self-assembly models, we simulated high-NA TIRF-SIM images of T=7 and T=9 polyhedra at different completion levels. As expected, ring patterns developed in the TIRF-SIM simulations upon formation of clathrin domes and pits. We used an edge detection algorithm to find the boundaries of the simulated TIRF-SIM images (Figs. 1C & E). Since our simulations incorporate fluorescence diffraction, the area enclosed within the detected boundaries of the simulated TIRF-SIM images appear larger than the footprint of the corresponding polyhedron. Due to the substantial change in the coat geometry, the projected area of the TIRF-SIM images decreased significantly upon the simulated flat-to-curved transitions taking place at 70% of coat completion (Bucher et al., 2018) and only after that the ring pattern could be observed (Fig. 1F). On the other hand, in the constant curvature model simulations, the detected area plateaued at around 50% completion of the coat surface area and the ring pattern can be clearly observed when the maximum area is reached, corresponding to appearance of the dome structure (Fig. 1F; Videos S2 & S3). In summary, in TIRF-SIM acquisitions, a flat-to-curved transition necessitates a substantial drop in the detected coat area prior to emergence of the ring pattern. Whereas the constant curvature model predicts that the ring pattern arises as the projected area approaches its maximum.
The projected area of de novo clathrin coats increases monotonically during the formation of pits as predicted by the constant curvature model.
We employed TIRF-SIM to image the formation of clathrin-coated pits in cultured cells (in vitro) and the tissues of developing Drosophila melanogaster embryos (in vivo) with high spatial and temporal resolution and monitor curvature generation by endocytic clathrin coats in real time (Li et al., 2015) (Video S1). For the group of clathrin pits that form de novo, the detected area of the fluorescently tagged coat components (clathrin, AP2 or CALM) increased monotonically until the ring pattern arises, which marks formation of clathrin domes and pits. This is followed by a relatively fast disappearance of fluorescence due to uncoating (Fig. 2). To perform a bulk analysis, we developed custom tracking software for the manual selection of individual clathrin-coated pit traces that are independent of other structures from their formation to dissolution. We created the time average of clathrin-coated pit traces extracted from BSC-1 and COS-7 cells imaged with high-NA TIRF-SIM and determined the evolution of the detected area (Videos S4 & S5; Fig. 3A) and the size of the ring pattern (i.e., peak-to-peak separation of the radial average; Fig. 3B) at different completion levels. Contrary to the predictions of the flat-to-curved transition models, we detected no decrease in the footprint of the coat prior to the appearance of the ring pattern, which would mark a generation of curvature. Instead, we found that the ring pattern is observable as the area makes a plateau and reaches the maximum (Fig. 3A, B), as predicted by the constant curvature model (Figs. 1F).
Figure 2. TIRF-SIM imaging allows analysis of curvature generation by clathrin pits with high spatiotemporal resolution in cultured cells and in tissues of Drosophila embryos.
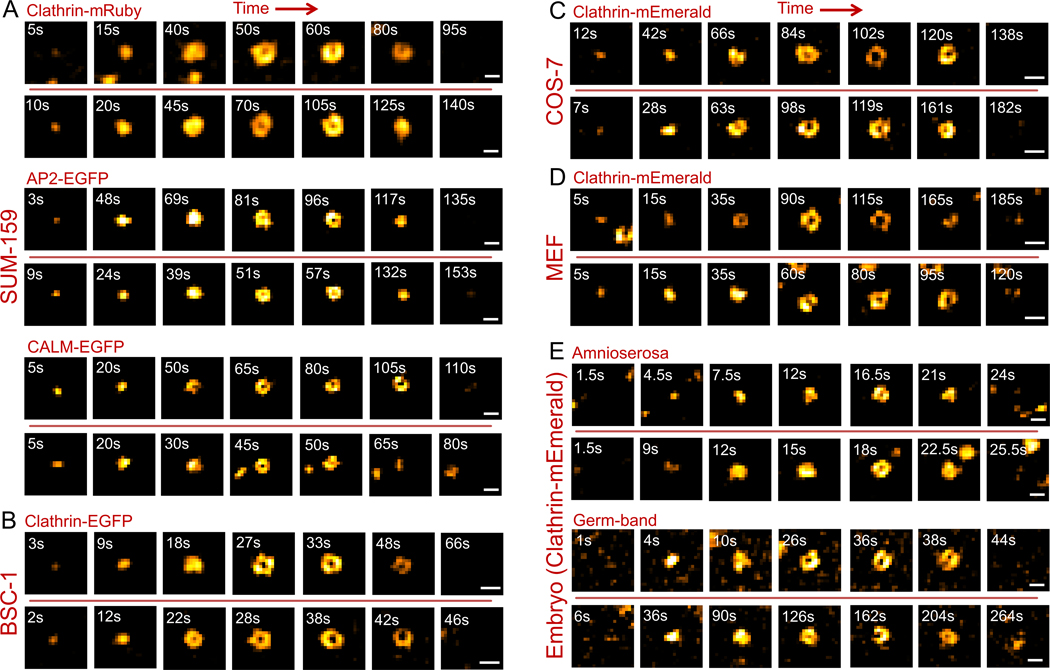
Each row shows snapshots from individual clathrin-coated pit traces. Formation of pits (marked by a ring pattern) can be observed under various in vitro and in vivo conditions including SUM-159 cells expressing fluorescently tagged endocytic markers (clathrin-mRuby, AP2-EGFP and CALM-EGFP respectively) (A), BSC-1 cells expressing clathrin-EGFP (B), COS-7 cells expressing clathrin-mEmerald (C), MEF cells expressing clathrin-mEmerald (D), and amnioserosa and germ-band tissues of Drosophila embryos expressing clathrin-mEmerald (E). Two traces are shown for each condition. Scale bars, 200 nm.
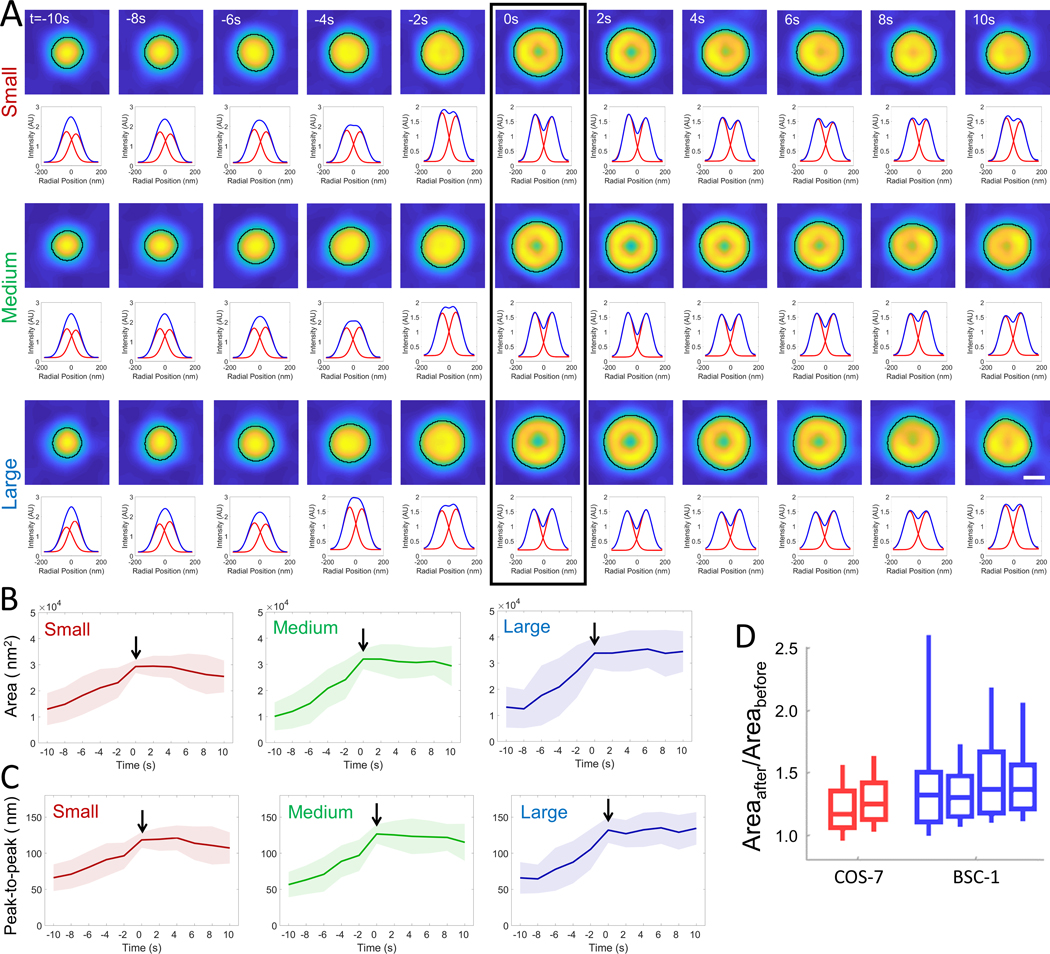
Figure 3. Clathrin coats reach maximum projected area by formation of domes and pits.

A. Average clathrin-coated pit formation images using 34 and 81 individual traces are obtained from COS-7 cells expressing clathrin-mEmerald and BSC-1 cells expressing clathrin-EGFP, respectively (Videos S4 & S5). In both cases, the area of the average image increases monotonically until a plateau is reached, which is followed by a relatively sharp decrease. B. For both cell types, average images of clathrin coats are shown for four equally spaced % completion points, last of which is the maximum area point (denoted as , , and max area in A). Note that the ring pattern becomes apparent as the area converges to the maximum. Below each image is the radial average (red circles), which is obtained along a cross-section rotated 180° around the center. We used two Gaussian fits to the radial average (green and blue) to calculate the peak-to-peak separation as an estimate of the ring size. Scale bars, 90 nm. C. Detected area of the T=7 and T=9 structures obtained from high-NA TIRF-SIM simulations are plotted with respect to % completion. D. Lifetime distributions of manually selected clathrin-coated pit traces detected from BSC-1 cells expressing clathrin-EGFP (upper) and COS-7 cells expressing clathrin-mEmerald (lower).
We also found that the maximum average area detected from BSC-1 and COS-7 clathrin pit images correlates with the TIRF-SIM simulations developed for T=7 and T=9 polyhedra, respectively (Figs. 1F & 3C). These results signify the accuracy of our measurements given that the size of the T=7 polyhedron is in very good agreement with the average clathrin pit dimensions reported in previous electron microscopy assays performed on BSC-1 cells (Bucher et al., 2018).
As an alternative to manual selection, we developed an algorithm for automated detection of individual clathrin-coated pit traces that appear independent of other clathrin structures in TIRF-SIM acquisitions. To ensure detection of bona fide clathrin-coated pits (Bhave et al., 2020), we filtered out abortive structures by automatically selecting traces that appear for at least five frames and have the ring pattern appear in at least two consecutive frames. Around 66% of the traces selected this way (1091 out of 1640) were considered as de novo clathrin-coated pits as they were more than 150 nm separated from the closest clathrin structure throughout their lifetime. The first appearance of the ring pattern in the trace, i.e. the “ring frame”, marks the formation of the clathrin dome, and is used for synchronization of the traces and sorting them into three groups of equal population based on the size of the ring pattern (i.e., small, medium and large). Figure 4A shows the average of synchronized traces (extending to 5 frames before and after the ring frame) detected in BSC-1 cells imaged at 0.5 frames/second. In good agreement with the constant curvature model, we found that the footprint of the structures increases and reaches a plateau with the appearance of the ring pattern in all three size groups (Figs. 4B, C). The same outcome is observed in COS-7 cells and BSC-1 cells imaged at different frame rates (Fig. S1).
Figure 4. Automated analysis of the projected area during formation of clathrin pits.
A. 187 de novo clathrin-coated pit traces detected from two BSC-1 cells (imaged at 0.5 frames/second) are grouped and synchronized using the first detected ring pattern (black rectangle). Average images (top) and corresponding radial averages (bottom) are shown for each three groups of equal population based on the size of the ring pattern (i.e., small, medium and large). Detected boundaries are shown by the black demarcations. The temporal evolution of the average area (B) and peak-to-peak separation of the Gaussian fits to the radial averages (C) are plotted for the three groups, where the formation of the clathrin dome (i.e. ring frame) is marked by the arrow. Shaded areas represent the standard deviation. D. Boxplots show the ratio of the maximum projected areas detected after and before the ring frame () in clathrin traces automatically detected from two COS-7 and four BSC-1 cells imaged with high-NA TIRF-SIM (; ). Overwhelming majority of the clathrin structures reach the maximum area upon formation of domes and pits, in good agreement with the manual analysis (Figure 3). Boxes extend to the quartiles, with a line at the median. Whiskers extend from the 10th to 90th percentiles. Scale bar, 100 nm.
According to the flat-to-curved transition models, clathrin domes and pits can only appear after a major decrease in the footprint of the coat. The constant curvature model, on the other hand, predicts that the ring pattern appears while the projected area is still increasing (Fig. 1B-F). To test this, for each trace, we compared the maximum area detected before and after the ring frame (Areabefore and Areaafter, respectively). Contrary to the predictions of the flat-to-curved transition models, we found that curvature generation is not associated with a reduction of the projected area, i.e. the footprint of the coats increases throughout formation of clathrin domes in accord with the constant curvature model (Fig. 4D).
Clathrin coat assembly and invagination are synchronous as predicted by the constant curvature model.
Transition of a flat clathrin lattice into a curved pit necessitates a significant inward movement that will displace the center of mass of the coat away from the membrane/glass interface (Fig. 5A, top). Therefore, due to the evanescent profile of the high-NA TIRF-SIM illumination (i.e., 50 nm penetration depth (i.e., 1/e decay length) corresponding to excitation NA of 1.55 (Li et al., 2015)), our simulations predicted a significant (~3-fold) reduction in the integrated fluorescence intensity of the clathrin coat upon flat-to-curved transition (Fig. 5B). A similar outcome was observed in recent simulations of Scott et al., where they adopted a deeper penetration of the evanescent field (100 nm) appropriate to the lower excitation NA used in their TIRF imaging (see Supplementary Figure 1c of (Scott et al., 2018)). In contrast, the constant curvature model proposes that the assembly of the clathrin coat is synchronous with its invagination and, therefore, the apex of the coat departs from the glass surface continuously (Fig. 5A, bottom). Correspondingly, clathrin fluorescence is predicted to converge into a plateau as the coat matures into a pit (Saffarian and Kirchhausen, 2008; Saffarian et al., 2009) (Fig. 5B). Note that the striking difference between the two models is obvious regardless of the distance between the clathrin coat and the substrate (Fig. S2). We synchronized automatically selected clathrin coat traces to the first appearance of the ring pattern to analyze the temporal evolution of the fluorescence signal. In BSC-1 and COS-7 cells imaged at different frame rates, we detected no reduction in the fluorescence signal upon the appearance of the ring pattern. Instead, the signal increased and converged into a plateau in good agreement with the constant curvature model (Fig. 5C). Similar plateau patterns were reported in earlier studies that employed TIR illumination to characterize fluorescence intensity profiles of clathrin-coated pits (Aguet et al., 2013; Saffarian and Kirchhausen, 2008; Saffarian et al., 2009).
Figure 5. Automated analysis of the fluorescence signal during formation of clathrin pits.
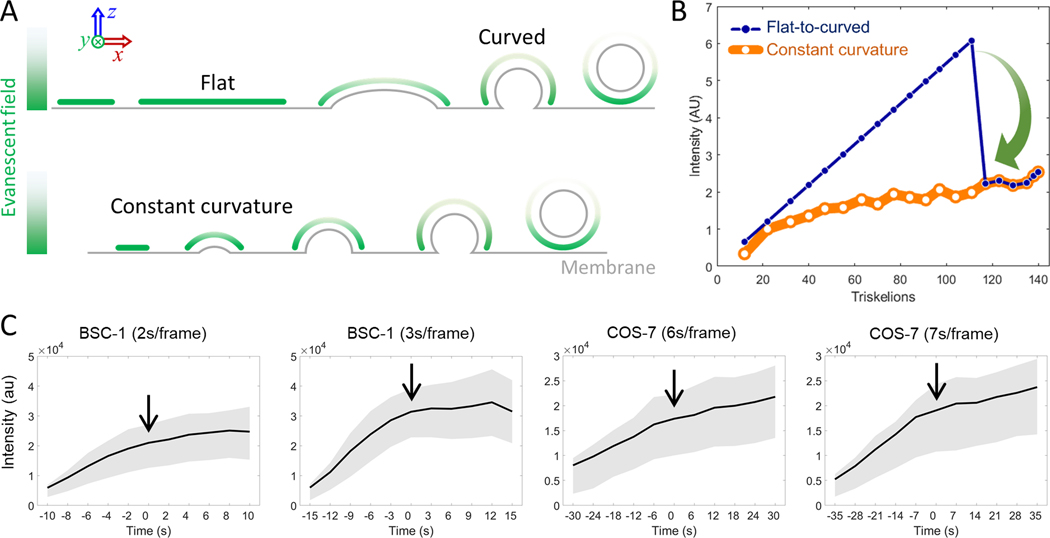
A. Schematics depicting illumination of clathrin coats under evanescent field created by the total internal reflection (TIR) of the excitation laser. Flat coats are illuminated with higher intensity (green) since they are closer to the glass/sample interface (upper). Invagination moves the apex of the coat away from the interface, which is synchronous to coat growth according to the constant curvature model (lower). B. Simulations show integrated TIRF intensity as a function of coat completion for T=7 polyhedra assembled based on the two models. Constant curvature model predicts a plateau in the clathrin signal (orange). Whereas a late-stage flat-to-curved transition (at 70% of completion) results in a significant decrease in intensity (blue) and only after this intensity decrease ring pattern would be observable. Penetration depth for high-NA TIRF illumination is 50 nm (Li et al., 2015). C. TIRF intensity traces (average and standard deviation) are plotted for automatically selected and synchronized traces from four BSC-1 cells and two COS-7 cells imaged at different frame rates (; ). Formation of the clathrin pit (i.e. ring frame) is marked by the arrow.
Membrane tension does not alter the mechanism of curvature generation.
Plasma membrane tension is one of the most important determinants of endocytic clathrin coat structure and dynamics as it increases the energetic cost of membrane deformation (Boulant et al., 2011; Bucher et al., 2018; Djakbarova et al., 2021; Ferguson et al., 2017; Saleem et al., 2015; Willy et al., 2017). Our automated analysis on genome edited SUM-159 cells expressing AP2-EGFP (Aguet et al., 2016) revealed that the average size of clathrin-coated pits increases when the plasma membrane tension is elevated by hypo-osmotic shock (Fig. 6A-C), confirming previous reports (Ferguson et al., 2017). Regardless of the tension level, both detected area and fluorescence signal increased monotonically throughout the maturation of clathrin pits (marked by the ring pattern) and reached a plateau (Fig. 6B-D). These results show that increased plasma membrane tension does not induce a late-stage flat-to-curved transition that leads to formation of clathrin-coated pits.
Figure 6. Curvature generation by clathrin coats under high plasma membrane tension.
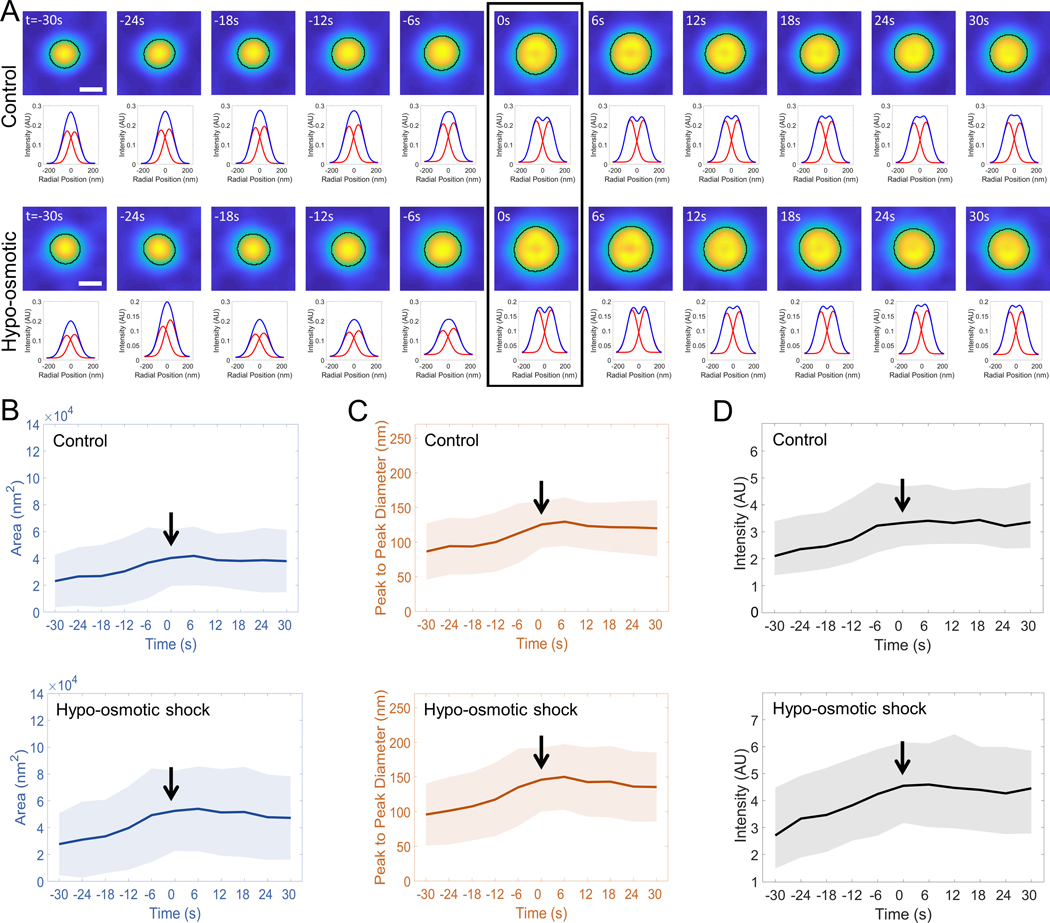
Membrane tension is increased in cells by hypo-osmotic shock. AP2 traces are automatically selected in SUM-159 cells genome edited to express AP2-EGFP under isotonic (; ) and hypotonic (; ) conditions. A. The average of the synchronized traces and corresponding radial averages are shown for both conditions. The arrowhead denotes the ring frame. The temporal evolution of the average area (B) and peak-to-peak separation of the Gaussian fits to the radial averages (C) are plotted for the two groups, where the formation of the clathrin dome/pit (i.e., ring frame) is marked by the arrow. Shaded areas represent the standard deviation. D. TIRF intensity traces (average and standard deviation) are plotted for automatically selected and synchronized traces from SUM-159 cells imaged at isotonic and hypotonic conditions. Scale bars, 100 nm.
It was previously proposed that clathrin coats are stalled in a flat state within the first 15 minutes of hypo-osmotic treatment (Bucher et al., 2018). We found that formation of de novo clathrin pits can still be observed during this time window despite increased membrane tension (Fig. S3A-C). Some traces indeed appeared static under conventional fluorescence imaging. However, enhanced spatial resolution of TIRF-SIM allowed us to ascertain that these traces correspond to dynamic hotspots of clathrin domes that are irregularly shaped and significantly larger than canonical clathrin pits (Fig. S3D). Appearance of the large clathrin domes followed an increase in the footprint of the coat structure, suggesting a curvature generation mechanism analogous to formation de novo pits.
CALM is localized to discrete clusters within clathrin plaques.
Flat-to-curved transition and constant curvature models are proposed to explain assembly of individual clathrin pits that form independent of existing clathrin coats. Aside from this mechanism, the edges of large clathrin patches are also associated with the formation of endocytic pits (Lampe et al., 2016; Leyton-Puig et al., 2017) (Video S6). This population may belong to clathrin pits that form de novo but adjacent to plaques (Kirchhausen, 2009). Alternatively, the ‘rupture and growth’ model predicts that, due to increased strain on the lattice, small fragments can break apart from the edges of clathrin plaques and grow into endocytic vesicles by building pentagonal faces without complex topological changes (Lampe et al., 2016; den Otter and Briels, 2011). A number of adaptor and accessory proteins are associated with membrane curvature generation and stabilization of clathrin coats during formation of endocytic pits (Busch et al., 2015; Dambournet et al., 2018; Henne et al., 2010; Joseph et al., 2020; Miller et al., 2015). Mass spectrometry analyses have revealed that AP2 and CALM have the highest stoichiometry within the adaptor mosaic found in clathrin-coated vesicles (Borner et al., 2012). Recent studies have revealed that these two most abundant adaptor proteins have seemingly opposite effects on the curvature of clathrin coats: while CALM promotes the formation of highly curved clathrin-coated pits, increasing AP2 levels give rise to large and static clathrin assemblies (Dambournet et al., 2018; Miller et al., 2015). Depletion of AP2 adaptors inhibit initiation and formation of productive pits, whereas CALM depletion results in accumulation of large and static clathrin coats that fail to constrict the neck region of endocytic vesicles (Meyerholz et al., 2005; Miller et al., 2015). Contribution by CALM adaptors becomes indispensable for endocytosis under mechanically stringent conditions, such as increased membrane tension (Willy et al., 2021).
We used dual-color TIRF-SIM imaging to investigate the spatial distribution of AP2 and CALM adaptors within clathrin-coated pits and plaques that form in SUM-159 cells that are genome edited to express either AP2-EGFP (Aguet et al., 2016) or CALM-EGFP (Willy et al., 2021) and transiently transfected with mRuby-Clathrin (these cells will be referred as SUM-AP2 and SUM-CALM cells for convenience). As expected, for clathrin pits that form de novo, curvature generation was observed simultaneously in the adaptor (AP2 or CALM) and clathrin channels, where the ring pattern formed upon an increase in the footprint of the structure (Fig. S4). We have detected no change in the relative fluorescence intensities obtained from the AP2 and clathrin channels coinciding with the detection of curvature generation (Bucher et al., 2018). We were unable to perform a quantitative analysis for determining the ratio of the copy number of these proteins because the evanescent field used for TIRF excitation does not illuminate the entire coat surface uniformly and the penetration depth is expected to be different for the laser lines (i.e., 488 and 560 nm) used for two-color excitation.
Our visual investigation suggested that the AP2 signal beneath plaques has a broad distribution that followed the clathrin signal closely (Fig. 7A). Whereas CALM is clustered within discrete zones that are comparable in size to the CALM signal observed in clathrin pits (Figs. 7B). To unbiasedly define their spatial distribution, we validated our observations by autocorrelation analysis, which is an established approach to estimate density, average size, and intensity of features contained in microscopy images (Robertson, 2012). We extracted images of forming clathrin pits and plaques from TIRF-SIM acquisitions of live SUM-CALM or SUM-AP2 cells and used the full width at half maximum (FWHM) of the radial average of autocorrelation signal to express its size (Fig. S5). When analyzing clathrin pits from SUM-AP2 cells, the FWHM of the autocorrelation of AP2-EGFP and corresponding mRuby-clathrin signals resulted respectively 144 ± 17 nm and 174 ± 9 nm (mean ± SD; Nstructures= 104). Similar results were obtained when clathrin-coated pit images from SUM-CALM cells were analyzed: the FWHM resulted 125 ± 25 nm for CALM-EGFP and 171 ± 19 nm for mRuby-clathrin (Nstructures= 79).
Figure 7. CALM, but not AP2, is recruited in discrete areas of clathrin plaques.
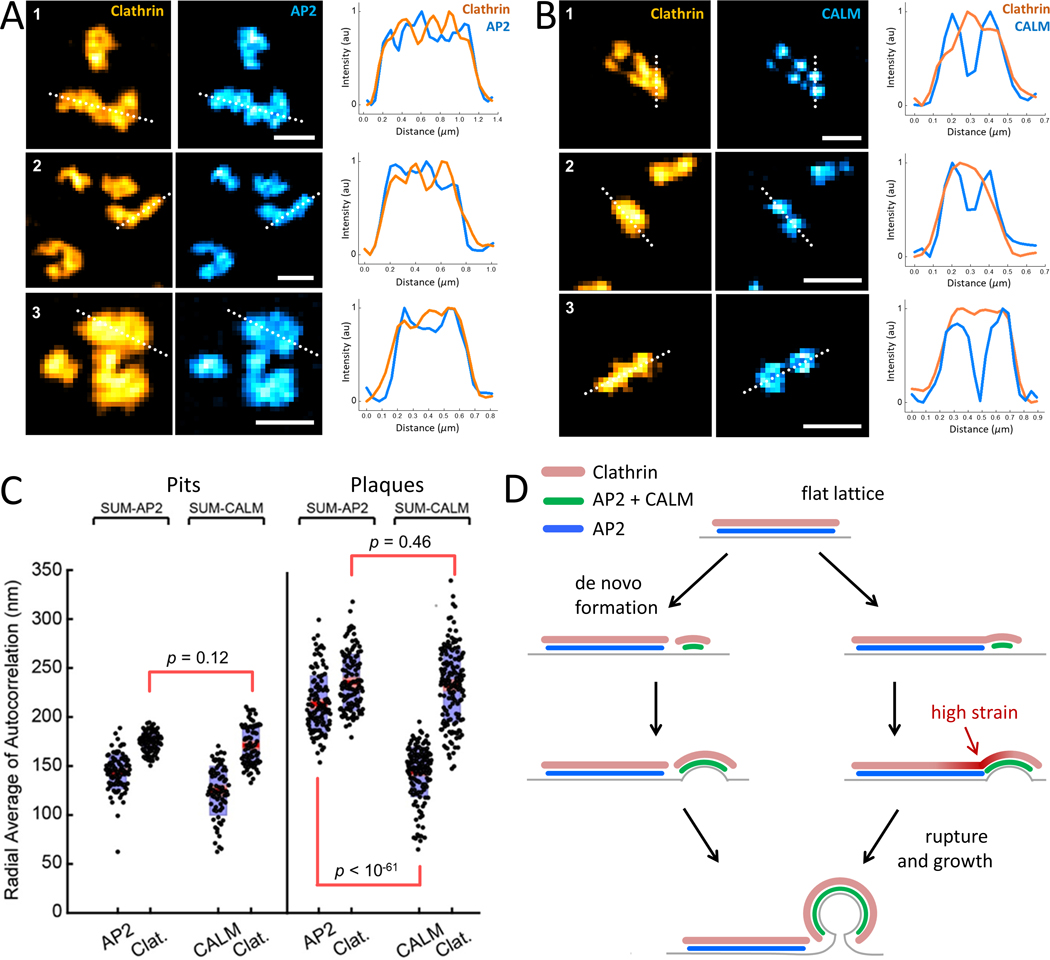
A & B. Examples show TIRF-SIM images of the clathrin plaques, and corresponding AP2 or CALM signal obtained from SUM-AP2 and SUM-CALM cells. Intensity profiles along the dotted lines are plotted for each example structure. Scale bars, 500 nm. C. Distribution of the computed radial averages for clathrin pits or plaques detected in six SUM-AP2 and six SUM-CALM cells (, ; , ). No statistical difference was detectable among clathrin signals detected in the clathrin pit samples (p = 0.12) or the plaque samples (p = 0.46), suggesting that the structures with similar shapes are identified in the two cell types. Instead, the distributions of CALM and AP2 in the clathrin patches were significantly different (p = 7.8*10−62). P-values are from a t-test analysis. D. Models explaining the origins of plaque-associated clathrin pits, where CALM clusters (green) correspond to the regions of high curvature, whereas AP2 only regions (blue) correspond to flat sections. De novo clathrin pits may form adjacent to but independent of flat lattices (left). Alternatively, recruitment of CALM within confined regions increases local curvature within plaques. Increased strain at the boundary between curved and flat lattices initiates rupture and, subsequently, growth into clathrin pits and vesicles at the edge regions (right).
When the image features are not diffraction-limited, the autocorrelation signal is wider than that of diffraction-limited images (Petersen et al., 1993). As expected, this is what we observed for the AP2 and clathrin signals obtained from the plaques of SUM-AP2 cells (Fig. S5), where the corresponding FWHM of the autocorrelation signals were 213 ± 28 nm and 235 ± 28 nm, respectively (Nstructures= 123) (Fig. 7C). However, the autocorrelation of the CALM signal obtained from the plaques of SUM-CALM cells yielded a significantly tighter FWHM compared to that of the clathrin signal (144 ± 37 nm versus 232 ± 37 nm; Nstructures= 161) (Fig. 7C). Based on these findings we concluded that AP2 adaptors are distributed over a region that is ~2-fold larger than that of CALM within clathrin plaques. We propose that, as a sensor and driver of membrane curvature, CALM is localized to discrete clusters that correspond to highly curved regions within the clathrin plaques. We expect that the internal stress at the boundary of these clusters may yield to the rupture of the lattice and completion of clathrin pits at the edges of plaques (Fig. 7D).
DISCUSSION
Here, we used super-resolved live cell imaging to investigate clathrin-coated pit formation with high spatial and temporal resolution in a wide range of cell types as well as tissues of developing organisms. TIRF-SIM imaging enabled us to differentiate de novo clathrin pits from other populations of clathrin-coated structures and monitor curvature generation in real time. Flat-to-curved transition models suggest extensive alterations in coat structure which necessitate substantial changes in the footprint and fluorescence intensity prior to the formation of clathrin domes and pits. While we do not rule out that such transitions are possible under certain conditions (Panahandeh et al., 2020), our findings clearly demonstrate that curvature generation by de novo clathrin pits takes place through a mechanism that is independent of such an abrupt transition at late stages of coat formation.
Even though our findings are compatible with the constant curvature model, we do not claim that curvature has to be uniform throughout the coat; heterogeneous insertion of the pentagonal faces can result in formation of clathrin coats that do not exhibit icosahedral symmetry (Cheng et al., 2007). Therefore, curvature of the coat can change throughout the assembly without a substantial rearrangement of the lattice, which necessitates transformation of early formed hexagonal faces into pentagons (den Otter and Briels, 2011). It was recently shown that Hsc70-driven dynamic instability at the edges of assembling clathrin pits serves as a proofreading mechanism for cargo enrichment (Chen et al., 2019). The physical properties of the plasma membrane and cargo (e.g., membrane tension, cargo size, density and shape) might dictate the size and geometry of assembling pits through this mechanism (Ferguson et al., 2017; Saleem et al., 2015).
A flat-to-curved transition of the clathrin coat requires a major structural reorganization that disrupts the hexagonal arrangement of the flat clathrin lattice to introduce pentagonal faces (Heuser, 1980; Kirchhausen, 1993, 2009). It was proposed that dynamic instability throughout the entire coat surface allows such transitions through rapid exchange of clathrin triskelions (Avinoam et al., 2015). This assumption was supported by fast fluorescence recovery rates detected after photobleaching of fluorescent clathrin spots in FRAP assays. It is important to note that a significant fraction of the fluorescent spots that appear as individual clathrin coats under diffraction-limited imaging contain multiple independent structures that are positioned in close proximity (Video S7). Therefore, due to inadequate spatial resolution, fluorescence recovery detected in these assays may correspond to initiation and growth of adjacent clathrin coats that cannot be resolved as separate structures. It is also important to consider that dynamic instability confined to the edges of growing clathrin coats gives rise to the recovery curves observed in FRAP assays (Chen et al., 2019).
In a recent study, Scott et al. utilized polarized TIRF microscopy to characterize curvature generation by endocytic clathrin coats (Scott et al., 2018). Using the ratio of fluorescence signals obtained by parallel (S) and perpendicular (P) excitation of DiI molecules incorporated into the plasma membrane (i.e. P/S), they concluded that a small fraction of clathrin coats undergo a late-stage flat-to-curved transition. However, in this population of traces, the fluorescence of the clathrin signal plateaus prior to the detection of a rise in P/S, which is incompatible with the flat-to-curved transition model. Instead, as demonstrated by their own flat-to-curved transition simulations (supplementary figure 1c in (Scott et al., 2018)) and ours (Figs. 5B & S2B), the invagination of the coat (marked by the appearance of the P/S signal) must coincide with almost two-fold reduction in the clathrin intensity, which was not observed in these traces. Since this population of traces has longer lifetimes than the others, we believe that they belong to larger clathrin-coated pits that gain curvature at early stages. Due to larger coat size (hence smaller curvature), in these traces clathrin intensity exceeds the detection threshold earlier than the P/S ratio and converges into a plateau at earlier stages of the coat completion as the apex of the coat moves further away from the interface, where the illumination is weaker. As the entire adherent surface of the plasma membrane is essentially parallel to the substrate, the background noise in the S channel increases the detection threshold of the P/S signal (supplementary figure 2e in (Scott et al., 2018)). To demonstrate this, we simulated the growth of the P/S ratio for clathrin-coated pits of different sizes assembling based on the constant curvature model (Figure S6). As expected, we found that, although clathrin coats are curved from the beginning, background noise delays detection of the P/S ratio (Figure S6A) and this delay is even longer for larger endocytic vesicles (Figure S6C).
We want to underscore that the flat-to-curved transition and constant curvature models are proposed to explain curvature generation by individual clathrin pits that form de novo, which nucleate and grow independent of other clathrin-coated structures. A seemingly separate population of clathrin pits appear to disassociate from larger clathrin assemblies (Video S6). These may also belong to de novo clathrin pits that happen to grow in the vicinity of plaques (Kirchhausen, 2009) (Fig. 7D). An alternative scenario was suggested based on coarse-grained simulations in which small coat fragments with hexagonal faces can break away from large clathrin lattices and grow into endocytic pits by acquiring new pentagonal faces (den Otter and Briels, 2011). In these simulations, the internal stress of the flat lattice is increased by modifying the pucker angle of a subset of clathrin triskelions, which leads to the deformation and rupture of the lattice. We found that CALM adaptors form clusters within plaques, whereas AP2 adaptors are uniformly distributed (Fig. 7). CALM is required for completion of clathrin pits under mechanically stringent conditions (Willy et al., 2021). Therefore, we propose that curvature locally driven or supported by CALM adaptors might increase the mechanical stress at the boundary of clusters leading to breaks in the clathrin lattice and, subsequently, formation of coated pits (Fig. 7D). In such a scenario, the pentagonal faces are expected to be overrepresented in the remainder (i.e., the latter half) of the internalized coated vesicle, resulting in significant spherical asymmetry (den Otter and Briels, 2011). Future studies may reveal major differences between distinct populations of clathrin-coated pits (i.e., de novo and plaque-associated) in terms of their structural properties and molecular architecture.
Limitations of the Study
The overall aim of this study is to determine which of the two extreme models (i.e., flat to curved transition and constant curvature) is a better representation of the mechanism of curvature generation by endocytic clathrin coats in living cells and tissues. The experimental approach we used in this study, total internal reflection fluorescence structure illumination microscopy (TIRF-SIM), allowed us to monitor the changes in the projected area and fluorescence signal intensity of forming clathrin-coated pits. Using these analyses, we were able to rule out the flat-to-curved transition models, which propose that curvature is generated at late stages of clathrin coat completion. However, due to limited spatial resolution of TIRF-SIM imaging (~90 nm), we were unable to assess changes in the radius of curvature, if any, that could have taken place at early stages of clathrin coat assembly. Therefore, even though our results are in good agreement with the constant curvature model, we cannot verify whether the radius of curvature remains constant especially at early stages of the clathrin coat formation.
STAR * METHODS
RESOURCE AVAILABILITY
Lead contact
Further information and requests for resources and reagents should be directed to and will be fulfilled by the Lead Contact, Comert Kural (kural.1@osu.edu).
Materials availability
Fly stocks generated for this study are listed in the key resources table and available from the lead contact.
KEY RESOURCES TABLE
| REAGENT or RESOURCE | SOURCE | IDENTIFIER |
|---|---|---|
| Chemicals, peptides, and recombinant proteins | ||
| Leibovitz’s L-15 medium, no phenol red | ThermoFisher | 21083027 |
| Ham’s F-12 Nutrient Mix | ThermoFisher | 11765054 |
| Fetal Bovine Serum (FBS) | ThermoFisher | 16140071 |
| Hydrocortisone | Sigma-Aldrich | H4001–1G |
| Penicillin-Streptomycin | Sigma-Aldrich | P4333–100ML |
| Halocarbon oil 27 | Sigma-Aldrich | H8773–100ML |
| Experimental models: Cell lines | ||
| SUM-159 cell genome edited to express AP2-EGFP | Aguet et al., (Aguet et al., 2016) | N/A |
| SUM-159 cell genome edited to express CALM-EGFP | Willy et al., (Willy et al., 2021) | N/A |
| BSC-1 cells stably expressing EGFP-CLTA | Li et al., (Li et al., 2015) | N/A |
| COS-7 cells transiently expressing mEmerald-CLTB | Li et al., (Li et al., 2015) | N/A |
| MEF cells transiently expressing mEmerald-CLTB | Li et al., (Li et al., 2015) | N/A |
| Experimental models: Organisms/strains | ||
| UAS-mEmerald-Clc | This paper | N/A |
| w[*]; P{w[+mW.hs]=GAL4-arm.S}11 | Bloomington Drosophila Stock Center | 1560 |
| Recombinant DNA | ||
| mRuby-CLTB | Addgene | #55852 |
| mEmerald-N1 | Addgene | #53976 |
| Software and algorithms | ||
| cmeAnalysis | https://www.utsouthwestern.edu/labs/danuser/software/ | N/A |
| TraCKer | https://www.asc.ohio-state.edu/kural.1/software.htm | N/A |
Data and code availability
Microscopy data reported in this paper will be shared by the lead contact upon request.
Custom MATLAB codes developed for manual and automated analysis of clathrin coat traces will be available from the lead contact upon request.
Any additional information required to reanalyze the data reported in this paper is available from the lead contact upon request.
EXPERIMENTAL MODEL AND SUBJECT DETAILS
Cell lines
BSC-1 cells stably expressing EGFP-CLTA, and COS-7 and MEF cells transiently expressing mEmerald-CLTB were cultured and prepared for microscopy as described in (Li et al., 2015). SUM-159 cells genome edited to express σ2-EGFP (Aguet et al., 2016) or CALM-EGFP (Willy et al., 2021) and transiently expressing mRuby-CLTB (Addgene; Plasmid #55852) were cultured in F-12 medium with hydrocortisone, penicillin-streptomycin and 5% fetal bovine serum (FBS). Gene Pulser Xcell electroporation system (Bio-Rad Laboratories, CA, USA) was used for transient transfection of SUM-159 cells following manufacturer’s instructions. SUM-159 cells were cultured on 35mm glass bottom dishes (MatTek) and imaged 24–48 hours after transfection in phenol-red-free L15 (Thermo Fisher Sci.) supplemented with 5% FBS at 37°C ambient temperature.
Fly maintenance, husbandry, and transgene expression
To construct pUAST-mEmerald-Clc, the in-frame GFP fusion from pUAST-GFP-Clc (Chang et al., 2002) was excised with an EcoRI/BglII digest and replaced with mEmerald (Addgene; Plasmid #53976), PCR amplified with primers GGAATTCCACCATGGTGAGCAAGGGCGAGG and CGAGATCTGAGTCCGGACTTGTACAGCTCGTCCATG (the EcoRI and BglII sites in the primers are underlined). After verifying the resulting plasmid by sequencing (Purdue Genomics Core Facility), UAS-mEmerald-Clc transgenic flies were generated by P element-mediated transformation (Spradling and Rubin, 1982).
Clathrin dynamics were imaged in developing Drosophila embryos using the UAS/GAL4 system (Ferguson et al., 2016). UAS-mEmerald-Clc flies were mated with arm-GAL4 (Bloomington Drosophila Stock Center) line to produce embryos expressing clathrin-mEmerald in the amnioserosa and surrounding germ-band tissue. The embryos were collected and aged for 10–12 hours at 25°C. After dechorionation, embryos were mounted on coverslips and immersed in halocarbon oil for imaging at 22°C.
METHOD DETAILS
Total internal reflection fluorescence structured illumination microscopy (TIRF-SIM)
High-NA TIRF-SIM images of COS-7 and BSC-1 cells were acquired as described in (Li et al., 2015). Briefly, a sinusoidal excitation pattern that decays exponentially within the sample is generated through intersection of two laser beams reaching the coverslip-sample interface exceeding the critical angle for total internal reflection. Fluorescence emission is collected by a 1.7-NA 100x objective lens (Olympus APON 100XHOTIRF) and imaged onto a sCMOS camera (Hamamatsu, Orca Flash 4.0 v2 sCMOS).
SUM-159 cells and Drosophila embryos were imaged using the TIRF-SIM system at the Advanced Imaging Center (AIC) of the Janelia Research Campus. This system comprises a 1.49-NA 100x objective lens (Olympus Life Science, CA, USA) fitted on an inverted microscope (Axio Observer; ZEISS) equipped with a sCMOS camera (Hamamatsu, Orca Flash 4.0). Structured illumination was provided by a spatial light modulator as described in (Li et al., 2015) and movies were acquired using 20 ms exposure time and with frame rates ranging from 0.15 to 0.5 Hz. Imaging experiments during hypo-osmotic shock are performed within 7–30 minutes after addition of 80% water. We verified that hypotonic swelling persists in SUM-159 cells within this time window (Fig. S3A, B).
To image clathrin activity in tissues of Drosophila embryos, the apical surface of amnioserosa and germ-band cells were positioned within the evanescent illumination by gently pressing the dechorionated embryos against the coverslip.
Spinning disk confocal fluorescence microscopy
The imaging system used to test the persistency of hypo-osmotic shock in SUM159 cells was an Eclipse TI-E microscope (Nikon) equipped with a temperature-controlled chamber, a CSU-W1 spinning disk confocal unit (Yokogawa Electric Corporation), a 100× objective lens (Nikon CFI Plan-Apochromat Lambda, NA 1.45) and a sCMOS camera (Prime 95B; Teledyne Photometrics). 3D time series were obtained using NIS Elements image acquisition software.
QUANTIFICATION AND STATISTICAL ANALYSIS
Image Analysis
a. Manual analysis:
Clathrin-coated structures in the TIRF (diffraction-limited) channel were tracked using two-dimensional cmeAnalysis software (Aguet et al., 2013). The traces extracted this way were filtered based on their intensity profiles as described in (Ferguson et al., 2016). Briefly, to distinguish complete clathrin coat formation events, only the traces that contain both positive and negative intensity slopes (corresponding to coat growth and dissolution, respectively) were selected.
To analyze the images in the TIRF-SIM (super-resolved) channel, a program was written in MATLAB 2017b (Mathworks) for the user to manually locate acceptable traces based on the following rejection criteria: 1) The structure must not come into contact with any other structure at any point during its lifetime (to exclude pair spots). 2) The structure must perform a single phase of intensity increase followed by a single phase of intensity decrease. Once a structure was selected, the user defined the first and last frames of the structure’s existence. The x-y position of the structure was taken as the intensity-weighted center of the image. The area was calculated using the MATLAB built-in function, edge, set to calculate the Canny edge of a small window containing only the structure of interest. When the edge finder failed to close the edge, the algorithm allowed the user to close the edge manually (Fig. S7A). The area within the closed boundary is calculated as the sum of the pixels enclosed.
Time averages of clathrin-coated pit traces are determined using TIRF-SIM images centered on the intensity-weighted center of the structure at each time point. These image sequences are of varying lengths, so each is extended to a length of 100 frames by linearly interpolating respective pixels at each time point (Fig. S7B). Images corresponding to each time/completion point are averaged pixel-by-pixel to obtain the time averages shown in Videos S4 & S5. In each frame, the area is calculated using the Canny edge-detection algorithm as described above.
To get the radial averages shown in Figure 3B, the images were upscaled by a factor of 10 with bicubic interpolation. For each upscaled image, 36 radial kymographs (separated by 5° increments and concentric with the intensity-weighted center of the structure; Fig. S7Cleft) are averaged and fit to the sum of two Gaussian functions (Fig. S7 right):
where is the background, and are the amplitudes, and are the center points, and is the standard deviation. values for the largest area deciles are 40.6 nm for COS-7 Clathrin-mEmerald, 37.3 nm for BSC-1 Clathrin-EGFP, 68.7 nm for SUM-159 Clathrin-mRuby, 45.4 nm for SUM-159 AP2-EGFP and 51 nm for embryo Clathrin-mEmerald. As expected, the standard deviations are the smallest for the data sets obtained by high-NA TIRF-SIM (i.e. COS-7 and BSC-1) and the largest for the SUM-159 Clathrin-mRuby dataset due to longer fluorescence wavelength.
b. Automated analysis:
Particle tracking.
We used TraCKer (Ferguson et al., 2016; Kural et al., 2012) for automated tracking of clathrin-coated structures in TIRF-SIM (super-resolved) channel. Since TraCKer is originally developed to trace diffraction-limited spots in fluorescence movies, curved clathrin structures that appeared as rings were frequently not detected. To circumvent this, as an initial step, holes (in rings) were closed using an averaging convolution followed by an erosion. After obtaining the traces of clathrin coats (x-y coordinated in multiple frames) all further analysis utilized the unmodified TIRF-SIM images.
Detection of ring patterns in TIRF-SIM Images.
After tracking, each clathrin trace is evaluated for appearance of a ring pattern using an 11×11 pixel window (~361nm x 361nm) centered on the structure in each frame (Fig. S8A, C). A coordinate pair (ri, Inti) is defined for each pixel in the cropped image, where ri is the distance from the center of the ith pixel to the center of the structure and Inti is the intensity of that pixel. Plotting these coordinates gives a radial profile of the structure to which a Gaussian distribution is fit using least squares (Fig. S8B, D). If the peak of the Gaussian is determined to be at least 2 pixels (60 nm) from the center of the structure, the structure is considered to have the ring pattern (Fig. S8B). Only the traces that have the ring pattern in two consecutive frames and no ring pattern in the first frame are used in further analysis.
Boundary detection.
The average image cross-section is determined by averaging 36, equidistant, radial cross sections (Fig. S8E, J). This 1D profile image was fit to the sum of two Gaussians (Fig. S8H, M), and the boundary of the structure was determined by the points where the magnitude of the Gaussians’ slopes were found to be a maximum (Fig. S8I, N).
Autocorrelation analysis
A MATLAB function was developed to facilitate manual selection of forming clathrin pits or plaques. To this end, a graphical user interface was made so that a user could click on structures, be presented with tracking data, and then select suitable structures for future analysis. This was used to manually select “pits” (diffraction-limited structures that internalize in a single step), and “plaques” (non-diffraction-limited structures) from the clathrin channel of our movies for 2-channel autocorrelation analysis. A cross-correlation minimum between cropped clathrin and adaptor images of 0.5 was imposed to ensure that only the same, single structure was present in the cropped image of both channels, and that it was in-focus in both channels. The images of the two channels were visibly offset from each other, so they were aligned using the offset that maximized the cross-correlation between the two channels. Autocorrelation images were generated using MATLAB built-in “xcorr2”. Radial averages of the autocorrelation images were done by binning all pixels in the autocorrelation image based on distance to the central maximum and calculating the average intensity of all bins (1 pixel wide).
TIRF-SIM simulations
High-NA TIRF-SIM simulations in Figures 1 & S5 and Videos S2 & S3 were created by modeling the fluorescence of each labeled triskelion as a 3D Gaussian. The amplitude of each Gaussian is proportional to the intensity of the incident light at its position within evanescent TIR field, in which the intensity profile used is an exponential decay along the z-axis. The image is generated by calculating the sum of all emitted intensities at the central position of each image pixel at the focal plane. All numeric parameters were implemented as reported in (Li et al., 2015): TIRF decay length = 50 nm; XY Gaussian SD = 84 nm; Z Gaussian SD = 500 nm; image pixel size = 30 nm.
Polarized-TIRF simulations
The clathrin coat structure is modeled as icosahedral Goldberg polyhedrons composed of 80, 140 and 180 clathrin triskelion units, respectively. On the vesicle membrane, the coordinates of the membrane intercalating dye molecules are calculated based on the Fibonacci spiral sphere formulation, which ensures equidistant distribution of dye molecules over the spherical vesicle. The distance of the membrane surface to the clathrin cage is assumed to be 10 nm and the neck of the vesicle is ignored.
The growth and invagination of the clathrin-coated pits are simulated assuming a constant radius for the membrane curvature throughout the growth. The growth of the vesicle is simulated by adding a triskelion and moving the vesicle towards inside of the cell at each frame. The mean diameter of full-sized membrane-vesicle/ccoat structures are calculated to be around 85/111, 116/141 and 131/161 nm. For each structure type, 100 clathrin pits are distributed on coordinates of a grid and reached full size sphere in 80, 140 and 180 frames, respectively. In order to even out the pixelation effects, the clathrin pits are displaced on the x-y plane at subpixel distances and spanning an area of 1px-by-1px.
For simulating cytoplasmic background intensity, Brownian and directed motion traces are generated with a diffusion constant of 0.5 µm/s2 and at a speed of 0–50 µm/s with persistence time of 1ms. The acquisition time of the system is set as 50ms and the background traces are generated in 0.5ms time steps. The molecules are homogenously distributed on the x-y plane, whereas in the z-axis they are distributed between the membrane and the depth of 200 nm inside the cell with decreasing numbers towards the membrane. Density of the background molecules are on average 5,000 molecules/μm2 for clathrin and 1,870, 3,740 and 7,480 molecules/μm2 for the three different noise levels of membrane dye. In the clathrin channel every molecule in the background is a single molecule, whereas in P and S channels half of the molecules in the background are stacked in the groups of 3 molecules.
The absorption intensity of each clathrin molecule is assumed to be the same. For S- and P-polarized illuminations, the dipole moments of the dye molecules are assumed parallel to the membrane and their absorption intensity is calculated as vector multiplications. The absorption intensities are converted to 3D images by binning in 13.3×13.3×16nm voxels.
The total internal reflection illumination is modeled as flat illumination which decays with an exponential constant of 100 nm in z-axis. 3D point-spread function (PSF) of the imaging system is modeled by a, Airy pattern equivalent to that of a microscope objective with a numerical aperture (NA) of 1.49 and for peak emission wavelength of EGFP at 509 nm. The 3D absorption images are convolved with the point-spread-function on x-y planes and multiplied with exponential gradient in z-axis. The resulting 3D images are binned by 10px-by-10px in x-y axes and summed in z-axis to obtain the 2D image which represents the acquisition by a camera with an imaging pixel size of 133nm.
The P/S images are obtained by division of P images with S images. The intensity of the clathrin traces is obtained for both clathrin and P/S channels by tracking the maximum intensity in a 3px-by-3px window at each frame. Particle detection and tracking is performed using the TraCKer software (Ferguson et al., 2016; Kural et al., 2012). The kymographs are generated by taking the cross section of the spots at around the pixel with the maximum intensity in the clathrin channel.
Self-assembly model
Figure S6D shows the schematic representation of clathrin triskelions used in simulations, where (~18.5 nm) is the nearest neighbor hub-hub distance (i.e., “strut” length) and (; ) is the next to nearest hub-hub distance (Heuser, 1980; Jin and Nossal, 2000). From basic topology, any closed shell will contain 12 pentagons. If we further assume that those pentagons arrange so that there is icosahedral symmetry, then all possible configurations are classified by the number according to
with and non-zero positive integers. Then, the clathrin coat consists of triskelions, “struts” of length and polygonal faces; of them hexagons and 12 pentagons.
The radius of the clathrin coats will therefore be defined by the distance between the hub and the center of the circumscribed sphere, which is given by
where is the distance between two nearest neighbor pentagons. This distance may be evaluated as and therefore, we have a relation between the sphere radius and according to
We adapt a previous model that successfully described the self-assembly of capsid subunits as assisted by scaffolding proteins (Li et al., 2018). Here, the role played by the latter are the AP2 adapters and the former are clathrin triskelions. The model is defined by
with a preferred angle, related to the spontaneous curvature . The stretching energy sums over all bonds with the equilibrium bond length and the bending energy is between all neighboring triskelions indexed with . We further assume that there is an attractive force between the triskelions and the preformed scaffolding layer (AP2 subunits), which involves a simple LJ-potential with the depth of the potential and the position of minimum energy corresponding to optimal distance between the center of the core and the subunits. The mechanical properties of the subunits (the ratio of stretching to bending moduli) are described by the Foppl von-Karman (FvK) number that is defined by
In our simulations (Figs. 1B&D, Videos S2 & S3), FvK number is selected based on the previous work (Li et al., 2018). It is important to remark that the pentagons are dynamically generated as the simulation proceeds and therefore, their location is an unambiguous prediction by the geometry and theory (Fig. 1F). It should be emphasized that, in contrast with the situations for viruses (Wagner and Zandi, 2015), clathrin shells may not exhibit icosahedral order. Still, the mechanism of defect growth is universal (independent of FvK number) and the absence of icosahedral order does not qualitatively modify any of the conclusions.
Movies displaying the geometry of clathrin coat assembly (Videos S2 & S3) were rendered in MATLAB using an orthographic projection. In the case of curved structures, the relative positions of clathrin triskelia are given by the results of the self-assembly model. After the addition of each new triskelion the entire structure is rotated so that the position vector of the center of mass moves towards vertical. For flat structures, triskelia are added in any position in the hexagonal lattice such that the distance from the new triskelion to the center of mass is minimized. When new triskelia are added, the structure translates in order to move the center of mass towards the origin. The strut length is consistent in all structures.
Supplementary Material
Green arrowheads mark clathrin-coated pits forming de novo (4 in total). Whereas, read arrowheads mark dynamic aggregates of clathrin pits.
The coat growth is shown in the x-z and x-y planes in A and B, respectively. In A, the color bar represents normalized evanescent TIR field intensity. Fully assembled pentagons are highlighted in pink. C. Simulated high-NA TIRF-SIM images corresponding to the clathrin coats shown in A and B. The red line shows the detected boundary. D. Projected area (i.e., area within the detected boundary) is plotted with respect to the number of triskelions integrated into the coat. Scale bars, 20 nm.
The coat growth is shown in the x-z and x-y planes in A and B, respectively. In A, the color bar represents normalized evanescent TIR field intensity. Fully assembled pentagons are highlighted with pink. C. Simulated high-NA TIRF-SIM images corresponding to the clathrin coats shown in A and B. The red line shows the detected boundary. D. Projected area (i.e., area within the detected boundary) is plotted with respect to the number of triskelions integrated into the coat. Scale bars, 20 nm.
The maximum projected area (area within the boundary) is reached at 75% of completion. For each image the radial average (red circles) is plotted on the right panel. Gaussian fits (green and blue) and corresponding peak-to-peak distances are shown between 40–96% completion.
The maximum projected area (area within the boundary) is reached at 69% of completion. For each image the radial average (red circles) is plotted on the right panel. Gaussian fits (green and blue) and corresponding peak-to-peak distances are shown between 40–96% completion.
Green arrowhead marks a clathrin-coated pit forming de novo. Whereas, read arrowheads mark clathrin pits budding off of large clathrin patches.
ACKNOWLEDGEMENTS
We thank the Advanced Imaging Center (AIC) at Janelia Research Campus for access to their TIRF-SIM system. We are particularly indebted to Aaron Taylor and Satya Khuon from the AIC team. The AIC is jointly supported by the Howard Hughes Medical Institute and the Gordon and Betty Moore Foundation.
Funding:
C. K. was supported by NSF Faculty Early Career Development Program (Award number: 1751113) and NIH R01GM127526. E. C. was partially supported by Pelotonia Young Investigator Award, IRP46050-502339. U. D. is supported by the Pelotonia Fellowship Program. Any opinions, findings, and conclusions expressed in this material are those of the author(s) and do not necessarily reflect those of the Pelotonia Fellowship Program or The Ohio State University. J.P.F. was supported by the Ohio State University Presidential Fellowship. S. L. and R. Z. were supported by NSF Grant DMR-1719550.
Footnotes
DECLERATION OF INTERESTS
Authors declare no competing interests.
REFERENCES
- Aguet F, Antonescu CN, Mettlen M, Schmid SL, and Danuser G. (2013). Advances in Analysis of Low Signal-to-Noise Images Link Dynamin and AP2 to the Functions of an Endocytic Checkpoint. Dev. Cell 26, 279–291. [DOI] [PMC free article] [PubMed] [Google Scholar]
- Aguet F, Upadhyayula S, Gaudin R, Chou Y, Cocucci E, He K, Chen B-C, Mosaliganti K, Pasham M, Skillern W, et al. (2016). Membrane dynamics of dividing cells imaged by lattice light-sheet microscopy. Mol. Biol. Cell 27, 3418–3435. [DOI] [PMC free article] [PubMed] [Google Scholar]
- Akisaka T, and Yoshida A. (2021). Surface distribution of heterogenous clathrin assemblies in resorbing osteoclasts. Exp. Cell Res 399, 112433. [DOI] [PubMed] [Google Scholar]
- Avinoam O, Schorb M, Beese CJ, Briggs JAG, and Kaksonen M. (2015). Endocytic sites mature by continuous bending and remodeling of the clathrin coat. Science 348, 1369–1372. [DOI] [PubMed] [Google Scholar]
- Baschieri F, Dayot S, Elkhatib N, Ly N, Capmany A, Schauer K, Betz T, Vignjevic DM, Poincloux R, and Montagnac G. (2018). Frustrated endocytosis controls contractility-independent mechanotransduction at clathrin-coated structures. Nat. Commun 9, 3825. [DOI] [PMC free article] [PubMed] [Google Scholar]
- Batchelder EM, and Yarar D. (2010). Differential Requirements for Clathrin-dependent Endocytosis at Sites of Cell-Substrate Adhesion. Mol. Biol. Cell 21, 3070–3079. [DOI] [PMC free article] [PubMed] [Google Scholar]
- Bates M, Huang B, Dempsey GT, and Zhuang X. (2007). Multicolor super-resolution imaging with photo-switchable fluorescent probes. Science (80-. ). 317, 1749–1753. [DOI] [PMC free article] [PubMed] [Google Scholar]
- Bhave M, Mino RE, Wang X, Lee J, Grossman HM, Lakoduk AM, Danuser G, Schmid SL, and Mettlen M. (2020). Functional characterization of 67 endocytic accessory proteins using multiparametric quantitative analysis of CCP dynamics. Proc. Natl. Acad. Sci 202020346. [DOI] [PMC free article] [PubMed]
- Borner GHH, Antrobus R, Hirst J, Bhumbra GS, Kozik P, Jackson LP, Sahlender DA, and Robinson MS (2012). Multivariate proteomic profiling identifies novel accessory proteins of coated vesicles. J. Cell Biol 197, 141–160. [DOI] [PMC free article] [PubMed] [Google Scholar]
- Boulant S, Kural C, Zeeh J-C, Ubelmann F, and Kirchhausen T. (2011). Actin dynamics counteract membrane tension during clathrin-mediated endocytosis. Nat. Cell Biol 13, 1124–1131. [DOI] [PMC free article] [PubMed] [Google Scholar]
- Bucher D, Frey F, Sochacki KA, Kummer S, Bergeest JP, Godinez WJ, Kräusslich HG, Rohr K, Taraska JW, Schwarz US, et al. (2018). Clathrin-Adaptor ratio and membrane tension regulate the flat-To-curved transition of the clathrin coat during endocytosis. Nat. Commun 9, 1109. [DOI] [PMC free article] [PubMed] [Google Scholar]
- Busch DJ, Houser JR, Hayden CC, Sherman MB, Lafer EM, and Stachowiak JC (2015). Intrinsically disordered proteins drive membrane curvature. Nat. Commun 6. [DOI] [PMC free article] [PubMed] [Google Scholar]
- Chang HC, Newmyer SL, Hull MJ, Ebersold M, Schmid SL, and Mellman I. (2002). Hsc70 is required for endocytosis and clathrin function in Drosophila. J. Cell Biol 159, 477–487. [DOI] [PMC free article] [PubMed] [Google Scholar]
- Chen Z, and Schmid SL (2020). Evolving models for assembling and shaping clathrin-coated pits. J. Cell Biol 219, 1–12. [DOI] [PMC free article] [PubMed] [Google Scholar]
- Chen Y, Yong J, Martínez-Sánchez A, Yang Y, Wu Y, De Camilli P, Fernández-Busnadiego R, and Wu M. (2019). Dynamic instability of clathrin assembly provides proofreading control for endocytosis. J. Cell Biol 218, 3200–3211. [DOI] [PMC free article] [PubMed] [Google Scholar]
- Cheng Y, Boll W, Kirchhausen T, Harrison SC, and Walz T. (2007). Cryo-electron Tomography of Clathrin-coated Vesicles: Structural Implications for Coat Assembly. J. Mol. Biol 365, 892–899. [DOI] [PMC free article] [PubMed] [Google Scholar]
- Cocucci E, Aguet F, Boulant S, and Kirchhausen T. (2012). The First Five Seconds in the Life of a Clathrin-Coated Pit. Cell 150, 495–507. [DOI] [PMC free article] [PubMed] [Google Scholar]
- Conner SD, and Schmid SL (2003). Regulated portals of entry into the cell. Nature 422, 37–44. [DOI] [PubMed] [Google Scholar]
- Dambournet D, Sochacki KA, Cheng AT, Akamatsu M, Taraska JW, Hockemeyer D, and Drubin DG (2018). Genome-edited human stem cells expressing fluorescently labeled endocytic markers allow quantitative analysis of clathrin-mediated endocytosis during differentiation. J. Cell Biol 217, 3301–3311. [DOI] [PMC free article] [PubMed] [Google Scholar]
- Djakbarova U, Madraki Y, Chan ET, and Kural C. (2021). Dynamic interplay between cell membrane tension and clathrin-mediated endocytosis. Biol. Cell 0, 1–30. [DOI] [PMC free article] [PubMed]
- Ehrlich M, Boll W, Van Oijen A, Hariharan R, Chandran K, Nibert ML, and Kirchhausen T. (2004). Endocytosis by random initiation and stabilization of clathrin-coated pits. Cell 118, 591–605. [DOI] [PubMed] [Google Scholar]
- Ferguson JP, Willy NM, Heidotting SP, Huber SD, Webber MJ, and Kural C. (2016). Deciphering dynamics of clathrin-mediated endocytosis in a living organism. J. Cell Biol 214, 347–358. [DOI] [PMC free article] [PubMed] [Google Scholar]
- Ferguson JP, Huber SD, Willy NM, Aygün E, Goker S, Atabey T, and Kural C. (2017). Mechanoregulation of clathrin-mediated endocytosis. J. Cell Sci 130, 3631–3636. [DOI] [PMC free article] [PubMed] [Google Scholar]
- Fiolka R, Shao L, Rego EH, Davidson MW, and Gustafsson MGL (2012). Time-lapse two-color 3D imaging of live cells with doubled resolution using structured illumination. Proc. Natl. Acad. Sci 109, 5311–5315. [DOI] [PMC free article] [PubMed] [Google Scholar]
- Grove J, Metcalf DJ, Knight AE, Wavre-Shapton ST, Sun T, Protonotarios ED, Griffin LD, Lippincott-Schwartz J, and Marsh M. (2014). Flat clathrin lattices: Stable features of the plasma membrane. Mol. Biol. Cell 25, 3581–3594. [DOI] [PMC free article] [PubMed] [Google Scholar]
- Henne WM, Boucrot E, Meinecke M, Evergren E, Vallis Y, Mittal R, and McMahon HT (2010). FCHo Proteins Are Nucleators of Clathrin-Mediated Endocytosis. Science 328, 1281–1284. [DOI] [PMC free article] [PubMed] [Google Scholar]
- Heuser J. (1980). Three-dimensional visualization of coated vesicle formation in fibroblasts. J. Cell Biol 84, 560–583. [DOI] [PMC free article] [PubMed] [Google Scholar]
- Heuser J. (1989). Effects of cytoplasmic acidification on clathrin lattice morphology. J. Cell Biol 108, 401–411. [DOI] [PMC free article] [PubMed] [Google Scholar]
- Heuser JE, Keen JH, Amende LM, Lippoldt RE, and Prasad K. (1987). Deep-etch visualization of 27S clathrin: A tetrahedral tetramer. J. Cell Biol 105, 1999–2009. [DOI] [PMC free article] [PubMed] [Google Scholar]
- Hoffmann A, Dannhauser PN, Groos S, Hinrichsen L, Curth U, Ungewickell EJ, and Ungewickell EJ (2010). A Comparison of GFP-Tagged Clathrin Light Chains with Fluorochromated Light Chains In Vivo and In Vitro. Traffic 1129–1140. [DOI] [PubMed]
- Huang B, Wang W, Bates M, and Zhuang X. (2008). Three-Dimensional Super-Resolution Reconstruction Microscopy. Science (80-. ). 319, 810–813. [DOI] [PMC free article] [PubMed] [Google Scholar]
- Jin AJ, and Nossal R. (2000). Rigidity of triskelion arms and clathrin nets. Biophys. J 78, 1183–1194. [DOI] [PMC free article] [PubMed] [Google Scholar]
- Joseph JG, Osorio C, Yee V, Agrawal A, and Liu AP (2020). Complimentary action of structured and unstructured domains of epsin supports clathrin-mediated endocytosis at high tension. Commun. Biol 3, 1–16. [DOI] [PMC free article] [PubMed] [Google Scholar]
- Kirchhausen T. (1993). Coated pits and coated vesicles - sorting it all out. Curr. Opin. Struct. Biol 3, 182–188. [Google Scholar]
- Kirchhausen T. (2009). Imaging endocytic clathrin structures in living cells. Trends Cell Biol. 19, 596–605. [DOI] [PMC free article] [PubMed] [Google Scholar]
- Kirchhausen T, Owen D, and Harrison SC (2014). Molecular structure, function, and dynamics of clathrin-mediated membrane traffic. Cold Spring Harb Perspect Biol 6, a016725. [DOI] [PMC free article] [PubMed] [Google Scholar]
- Kural C, and Kirchhausen T. (2012). Live-cell imaging of clathrin coats. Methods Enzymol. 505, 59–80. [DOI] [PMC free article] [PubMed] [Google Scholar]
- Kural C, Tacheva-Grigorova SK, Boulant S, Cocucci E, Baust T, Duarte D, and Kirchhausen T. (2012). Dynamics of Intracellular Clathrin / AP1- and Clathrin / AP3-Containing Carriers. CellReports 2, 1111–1119. [DOI] [PMC free article] [PubMed] [Google Scholar]
- Lampe M, Vassilopoulos S, and Merrifield C. (2016). Clathrin coated pits, plaques and adhesion. J. Struct. Biol 196, 48–56. [DOI] [PubMed] [Google Scholar]
- Larkin JM, Donzell WC, and Anderson RGW (1986). Potassium-dependent assembly of coated pits: New coated pits form as planar clathrin lattices. J. Cell Biol 103, 2619–2627. [DOI] [PMC free article] [PubMed] [Google Scholar]
- Leyton-Puig D, Isogai T, Argenzio E, Van Den Broek B, Klarenbeek J, Janssen H, Jalink K, and Innocenti M. (2017). Flat clathrin lattices are dynamic actin-controlled hubs for clathrin-mediated endocytosis and signalling of specific receptors. Nat. Commun 8, 16068. [DOI] [PMC free article] [PubMed] [Google Scholar]
- Li D, Shao L, Chen B-CC, Zhang X, Zhang M, Moses B, Milkie DE, Beach JR, Hammer JA, Pasham M, et al. (2015). Extended-resolution structured illumination imaging of endocytic and cytoskeletal dynamics. Science (80-. ). 349, aab3500. [DOI] [PMC free article] [PubMed] [Google Scholar]
- Li S, Roy P, Travesset A, and Zandi R. (2018). Why large icosahedral viruses need scaffolding proteins. Proc. Natl. Acad. Sci 115, 10971–10976. [DOI] [PMC free article] [PubMed] [Google Scholar]
- Loerke D, Mettlen M, Yarar D, Jaqaman K, Jaqaman H, Danuser G, and Schmid SL (2009). Cargo and dynamin regulate clathrin-coated pit maturation. PLoS Biol. 7, e57. [DOI] [PMC free article] [PubMed] [Google Scholar]
- Maupin P, and Pollard TD (1983). Improved preservation and staining of HeLa cell actin filaments, clathrin-coated membranes, and other cytoplasmic structures by tannic acid glutaraldehyde saponin fixation. J. Cell Biol 96, 51–62. [DOI] [PMC free article] [PubMed] [Google Scholar]
- McMahon HT, and Boucrot E. (2011). Molecular mechanism and physiological functions of clathrin-mediated endocytosis. Nat. Rev. Mol. Cell Biol 12, 517–533. [DOI] [PubMed] [Google Scholar]
- Meyerholz A, Hinrichsen L, Groos S, Esk P-C, Brandes G, and Ungewickell EJ (2005). Effect of clathrin assembly lymphoid myeloid leukemia protein depletion on clathrin coat formation. Traffic 6, 1225–1234. [DOI] [PubMed] [Google Scholar]
- Miller SE, Mathiasen S, Bright NA, Pierre F, Kelly BT, Kladt N, Schauss A, Merrifield CJ, Stamou D, Höning S, et al. (2015). CALM Regulates Clathrin-Coated Vesicle Size and Maturation by Directly Sensing and Driving Membrane Curvature. Dev. Cell 33, 163–175. [DOI] [PMC free article] [PubMed] [Google Scholar]
- Moulay G, Lainé J, Lemaitre M, Nakamori M, Nishino I, Caillol G, Mamchaoui K, Julien L, Dingli F, Loew D, et al. (2020). Alternative splicing of clathrin heavy chain contributes to the switch from coated pits to plaques. J. Cell Biol 219. [DOI] [PMC free article] [PubMed] [Google Scholar]
- Musacchio A, Smith CJ, Roseman AM, Kirchhausen T, Pearse BMF, Harrison SC, Kirchhausen T, and Pearse BMF (1999). Functional organization of clathrin in coats: Combining electron cryomicroscopy and x-ray crystallography. Mol. Cell 3, 761–770. [DOI] [PubMed] [Google Scholar]
- den Otter WK, and Briels WJ (2011). The generation of curved clathrin coats from flat plaques. Traffic 12, 1407–1416. [DOI] [PubMed] [Google Scholar]
- Panahandeh S, Li S, Marichal L, Leite Rubim R, Tresset G, and Zandi R. (2020). How a Virus Circumvents Energy Barriers to Form Symmetric Shells. ACS Nano 14, 3170–3180. [DOI] [PubMed] [Google Scholar]
- Petersen NO, Höddelius PL, Wiseman PW, Seger O, and Magnusson KE (1993). Quantitation of membrane receptor distributions by image correlation spectroscopy: concept and application. Biophys. J 65, 1135–1146. [DOI] [PMC free article] [PubMed] [Google Scholar]
- Robertson C. (2012). Theory and practical recommendations for autocorrelation-based image correlation spectroscopy. J. Biomed. Opt 17, 080801. [DOI] [PMC free article] [PubMed] [Google Scholar]
- Robinson MS (2015). Forty Years of Clathrin-coated Vesicles. Traffic 16, 1210–1238. [DOI] [PubMed] [Google Scholar]
- Saffarian S, and Kirchhausen T. (2008). Differential evanescence nanometry: live-cell fluorescence measurements with 10-nm axial resolution on the plasma membrane. Biophys. J 94, 2333–2342. [DOI] [PMC free article] [PubMed] [Google Scholar]
- Saffarian S, Cocucci E, and Kirchhausen T. (2009). Distinct dynamics of endocytic clathrin-coated pits and coated plaques. PLoS Biol. 7, e1000191. [DOI] [PMC free article] [PubMed] [Google Scholar]
- Saleem M, Morlot S, Hohendahl A, Manzi J, Lenz M, and Roux A. (2015). A balance between membrane elasticity and polymerization energy sets the shape of spherical clathrin coats. Nat. Commun 6, 6249. [DOI] [PMC free article] [PubMed] [Google Scholar]
- Scott BL, Sochacki KA, Low-Nam ST, Bailey EM, Luu QA, Hor A, Dickey AM, Smith S, Kerkvliet JG, Taraska JW, et al. (2018). Membrane bending occurs at all stages of clathrincoat assembly and defines endocytic dynamics. Nat. Commun 9. [DOI] [PMC free article] [PubMed] [Google Scholar]
- Shraiman BI (1997). On the role of assembly kinetics in determining the structure of clathrin cages. Biophys. J 72, 953–957. [DOI] [PMC free article] [PubMed] [Google Scholar]
- Sochacki KA, and Taraska JW (2019). From Flat to Curved Clathrin: Controlling a Plastic Ratchet. Trends Cell Biol. 29, 241–256. [DOI] [PubMed] [Google Scholar]
- Sochacki KA, Dickey AM, Strub MP, and Taraska JW (2017). Endocytic proteins are partitioned at the edge of the clathrin lattice in mammalian cells. Nat. Cell Biol 19, 352–361. [DOI] [PMC free article] [PubMed] [Google Scholar]
- Spradling AC, and Rubin GM (1982). Transposition of cloned P elements into Drosophila germ line chromosomes. Science 218, 341–347. [DOI] [PubMed] [Google Scholar]
- Wagner J, and Zandi R. (2015). The Robust Assembly of Small Symmetric Nanoshells. Biophys. J 109, 956–965. [DOI] [PMC free article] [PubMed] [Google Scholar]
- Willy NM, Ferguson JP, Huber SD, Heidotting SP, Aygün E, Wurm SA, Johnston-Halperin E, Poirier MG, and Kural C. (2017). Membrane mechanics govern spatiotemporal heterogeneity of endocytic clathrin coat dynamics. Mol. Biol. Cell 28, 3480–3488. [DOI] [PMC free article] [PubMed] [Google Scholar]
- Willy NM, Colombo F, Huber S, Smith AC, Norton EG, Kural C, and Cocucci E. (2021). CALM supports clathrin-coated vesicle completion upon membrane tension increase. Proc. Natl. Acad. Sci 118, e2010438118. [DOI] [PMC free article] [PubMed] [Google Scholar]
Associated Data
This section collects any data citations, data availability statements, or supplementary materials included in this article.
Supplementary Materials
Green arrowheads mark clathrin-coated pits forming de novo (4 in total). Whereas, read arrowheads mark dynamic aggregates of clathrin pits.
The coat growth is shown in the x-z and x-y planes in A and B, respectively. In A, the color bar represents normalized evanescent TIR field intensity. Fully assembled pentagons are highlighted in pink. C. Simulated high-NA TIRF-SIM images corresponding to the clathrin coats shown in A and B. The red line shows the detected boundary. D. Projected area (i.e., area within the detected boundary) is plotted with respect to the number of triskelions integrated into the coat. Scale bars, 20 nm.
The coat growth is shown in the x-z and x-y planes in A and B, respectively. In A, the color bar represents normalized evanescent TIR field intensity. Fully assembled pentagons are highlighted with pink. C. Simulated high-NA TIRF-SIM images corresponding to the clathrin coats shown in A and B. The red line shows the detected boundary. D. Projected area (i.e., area within the detected boundary) is plotted with respect to the number of triskelions integrated into the coat. Scale bars, 20 nm.
The maximum projected area (area within the boundary) is reached at 75% of completion. For each image the radial average (red circles) is plotted on the right panel. Gaussian fits (green and blue) and corresponding peak-to-peak distances are shown between 40–96% completion.
The maximum projected area (area within the boundary) is reached at 69% of completion. For each image the radial average (red circles) is plotted on the right panel. Gaussian fits (green and blue) and corresponding peak-to-peak distances are shown between 40–96% completion.
Green arrowhead marks a clathrin-coated pit forming de novo. Whereas, read arrowheads mark clathrin pits budding off of large clathrin patches.
Data Availability Statement
Microscopy data reported in this paper will be shared by the lead contact upon request.
Custom MATLAB codes developed for manual and automated analysis of clathrin coat traces will be available from the lead contact upon request.
Any additional information required to reanalyze the data reported in this paper is available from the lead contact upon request.