

Abstract
Breast cancer brain metastasis (BCBM) is a lethal disease with no effective treatments. Prior work has shown that brain cancers and metastases are densely infiltrated with anti-inflammatory, protumourigenic tumour-associated macrophages, but the role of brain-resident microglia remains controversial because they are challenging to discriminate from other tumour-associated macrophages. Using single-cell RNA sequencing, genetic and humanized mouse models, we specifically identify microglia and find that they play a distinct pro-inflammatory and tumour-suppressive role in BCBM. Animals lacking microglia show increased metastasis, decreased survival and reduced natural killer and T cell responses, showing that microglia are critical to promote anti-tumour immunity to suppress BCBM. We find that the pro-inflammatory response is conserved in human microglia, and markers of their response are associated with better prognosis in patients with BCBM. These findings establish an important role for microglia in anti-tumour immunity and highlight them as a potential immunotherapy target for brain metastasis.
Breast cancer brain metastasis (BCBM) is rapidly emerging as a critical problem in breast cancer. In total, 15–30% of patients with metastatic breast cancer develop brain metastasis, and studies project a >30% increase in patients as treatments for peripheral disease improve and patients live longer1–2. This is alarming since there are no effective treatments and median survival is only a few months3–6. There is growing interest in immunotherapeutic strategies to treat central nervous system (CNS) cancers, given that immune cells enter the brain while most conventional therapies are excluded by the blood brain barrier7,8. Greater understanding of the immune response to BCBM will be needed to develop immunotherapy strategies effective in the unique immune microenvironment of the CNS.
The brain immune microenvironment is principally composed of specialized tissue-resident macrophages called microglia that tile the brain and play diverse functions in CNS homeostasis and disease9–11. Microglia represent an attractive immunotherapeutic target because they are the first line of defence to disease in the CNS. BCBMs are heavily infiltrated with tumour-associated macrophages (TAMs), which may be composed of microglia, macrophages and bone marrow-derived myeloid cells12–16. Functional studies suggest a tumour-promoting role for TAMs. Depletion of TAMs with CSF1R inhibitors results in tumour reduction and decreased metastasis in glioblastoma and melanoma models17–21. TAM depletion using a CX3CR1-targeted genetic ablation model similarly results in decreased BCBM22. However, it is unclear whether microglia or other TAMs produce these tumour-promoting effects. CSF1R inhibitors deplete microglia but also attenuate other myeloid cells, and microglia ultimately repopulate the brain when treatment ceases. Likewise, CX3CR1 is expressed by diverse myeloid cell populations and upregulated by myeloid cells upon entry into the brain23. Therefore, the specific impact of microglia on tumour initiation and their potential as an immunotherapy target remain unclear.
In this Article, we combined single-cell RNA sequencing (scRNA-seq) with genetic and humanized mouse models to find that microglia suppress BCBM by promoting anti-tumour natural killer (NK) and T cell responses. scRNA-seq of >90,000 cells from three different BCBM models revealed that microglia mount a robust pro-inflammatory response to BCBM. Using a genetic knockout model, we find that animals lacking microglia show increased metastasis, decreased survival and impaired NK and T cell responses to BCBM24. We show that ablation of T cells reduces microglia activation and attenuates their tumour-suppressive effect, indicating that reciprocal microglia-T cell activation is critical to suppress BCBM. Utilizing a humanized mouse model, we find that the pro-inflammatory response is conserved in human microglia, and analysis of patient BCBM data indicates that increased pro-inflammatory marker expression is associated with better prognosis. These findings contrast with the pro-tumourigenic function reported for TAMs and highlight the potential of harnessing the anti-tumour function of microglia to treat brain metastasis.
Results
Single-cell analysis of TAMs in BCBM
We used scRNA-seq to interrogate the microglia response to BCBM using the MDA-MB-231-BR (231BR) model. In this model, green fluorescent protein (GFP)-labelled 231BR cells are delivered into the arterial circulation via intracardiac injection and form parenchymal brain metastases by day 28 (Fig. 1a,b and Extended Data Fig. 1a)25–28. Like in human BCBM, metastases are heavily infiltrated with ionized calcium-binding adaptor molecule 1 (IBA1+) TAMs (Fig. 1b,c and Extended Data Fig. 1b)29. For scRNA-seq, cells were dissociated from control and metastatic brains and myeloid cells were isolated by flow cytometry (Fig. 1d and Extended Data Fig. 1c). Cancer cells and astrocytes were sorted for control (Fig. 1d and Extended Data Fig. 1c). Analysis of the 42,891 cells that passed quality control filtering (Extended Data Fig. 1d,e) revealed seven distinct cell types identified by canonical markers (Fig. 1e,f and Supplementary Table 1). This included the targeted cell types, astrocytes (Aldoc and Atp1a2), microglia (Tmem119 and P2ry12) and non-microglia myeloid cells (Lyz2 and Plac8) (Fig. 1e,f and Supplementary Table 1). We also recovered small numbers of ependymal cells (Ccdc153 and Rarres2), oligodendrocytes (Mbp and Ptgds), vascular cells (Cldn5 and Vtn) and lymphocytes (Cd3g and Gzma) (Fig. 1e,f and Supplementary Table 1). Lymphocytes and the non-microglia myeloid populations were preferentially from the metastatic condition, suggesting these cells are recruited from the periphery (Extended Data Fig. 1f). We found limited differences in clustering of astrocytes from control and metastatic brains (Extended Data Fig. 1g,h and Supplementary Table 2).
Fig. 1 |. Single-cell analysis of TAMs in BCBM.

a, Schematic showing disease progression in mouse 231BR-Foxn1nu/nu BCBM experimental metastasis model. A total of 500,000-GFP-Luc-labelled 231BR cells were injected into the left cardiac ventricle of Foxn1nu/nu mice and collected 28 days later. Whole-mount brightfield and fluorescence microscopy images show a representative brain with GFP+ metastatic foci (green). b, IF staining showing IBA1+ cells (red) in control and metastatic brains at 7,14 and 28 days post 231BR cell injection. Metastatic cells are GFP+ (green). 231BR cells arrest in blood vessels and cross into the brain 2–7 days post-injection, then grow along blood vessels forming micrometastases by day 14, parenchymal metastases by day 28. Scale bar, 50 μm. c, Quantification of IBA1+ cells in control (n = 4) and metastatic (n = 4) brains 28 days post 231BR cell injection. IBA1+ cells were quantified in control (n = 61 fields) and metastatic tumour regions (n = 41 fields). Bargraph shows 1.95-fold increase of IBA1+ cells in tumour compared with control tissue. Pvalue was generated using a two-sided, unpaired t-test, and error bars show mean ± standard deviation. d, Schematic showing experimental design for generation of scRNA-seq dataset. Foxn1nu/nu mice were injected with 500,000 GFP-Luc-labelled 231BR cells, and brains were collected 28 days later. Three metastatic (Met1-3) and three control (Con1-3) brains were digested and myeloid cells (CD45+, CD11b+), astrocytes (CD45−, ASCA2+) and 231BR (CD45−, GFP+) cells were isolated by flow cytometry for droplet-based scRNA-seq. e, tSNE plot showing mouse cells that passed quality filtering (n = 42,891), coloured and labelled by cell type. f, Dot plot showing top marker genes for each cell type ranked by the average natural log fold change (FC) and determined by the Wilcoxon rank-sum test. Dot size represents the percentage of cells that express each gene, and dot greyscale represents the average expression level. For full marker gene list, see Supplementary Table 1.
Microglia display robust pro-inflammatory responses to BCBM
In contrast to astrocytes, analysis of the myeloid cells revealed strong separation of control and metastatic conditions (Fig. 2a). Microglia were distinguished from other myeloid populations by scoring each cell for the core microglia signature developed by Bowman et al. (2016) (Fig. 2b and Supplementary Table 3)30. This identified two large microglia populations (Tmem119, P2ry12, Sparc and Gpr34), where one contained microglia from both control and metastatic and the other was almost entirely from metastatic brains (Fig. 2a,b and Extended Data Fig. 2a–d). We also found two small populations of microglia that display an increased stress response (Extended Data Fig. 2d), which is common post tissue manipulation31. Neutrophils (Camp and S100a9), monocytes/macrophages (Ly6c2 and Lyz2), mature dendritic cells (Ccr7 and Flt3) and B cells (Igkc and Cd79a) were also identified (Fig. 2b, Extended Data Fig. 2a–d and Supplementary Table 4).
Fig. 2 |. Microglia display robust pro-inflammatory responses to BCBM.

a, tSNE plot showing clustering of myeloid cells (n = 24,348), coloured by mouse. b, tSNE plot showing each myeloid cell coloured by MG score, the core microglia gene signature from Bowman et al. (2016) that compared microglia with bone marrow-derived cells using bulk RNA-seq from lineage-labelled mice. For full MG score gene list, see Supplementary Table 3. Scores were calculated using the AddModuleScore function in Seurat. Top marker genes (grey) for each myeloid cell type were identified using the Wilcoxon rank-sum test. For myeloid cell type markers, see Supplementary Table 4. mDC, mature dendritic cell; Mono/Macro, monocytes and macrophages, c. Bar plot showing selected top GO terms associated with the BCBM response microglia signature. This signature was generated by differential gene expression analysis of microglia from metastatic versus control brains (n = 632 upregulated genes, adjusted P < 0.05). Differentially expressed (DE) genes were determined using the Wilcoxon rank-sum test. GO terms were identified using MouseMine, and select upregulated terms with Holm-Bonferroni-adjusted Pvalues < 0.05 were retained. For DE genes, see Supplementary Table 4. d, Schematic overview of topic model fitting method to assess microglia heterogeneity. The CountClust R package was used to fit a topic model using LDA. A matrix for ‘gene weights’ was generated that contains a list of the genes comprising each topic and the gene weight (Supplementary Table 5). A second matrix for ‘topic weights’ lists the weight of each topic across the cells. e, Heatmap showing three core topics upregulated in microglia in BCBM. Scaled gene weights for top genes comprising each topic are shown. f, tSNE plots showing distribution of three core topics in each microglia. Left panels show topic weight in each cell indicated by contrast greyscale. Right panel overlay shows top topic assignment for each cell, where only cells with a topic weight >0.1 are coloured. g, tSNE plots showing expression of selected genes from each topic in myeloid cells.
Further analysis of the microglia revealed robust changes in BCBM. We identified 3,715 genes differentially expressed between microglia from control and metastatic brains (Supplementary Table 4). Gene Ontology (GO) analysis showed that top upregulated pathways were associated with pro-inflammatory responses, such as ‘cytokine production’, ‘antigen processing and presentation’ and ‘response to IFN-β’ (Fig. 2c)32. Further analysis revealed that these programmes are not uniformly upregulated by all microglia. We used a probabilistic clustering method called latent dirichlet allocation (LDA), also known as topic modelling, to assess microglia heterogeneity (Fig. 2d). Unlike standard cell clustering methods, topic modelling assigns each cell to multiple gene modules or topics, which allows for better appreciation of how distinct but overlapping gene modules are expressed in a population of cells33.This analysis identified four core topics (Extended Data Fig. 2e–f and Supplementary Table 5). Topic 12 was the most broadly upregulated and represented an interferon (IFN) response programme (Bst2, Ifitm3, Ifit3b and Isg15), which has been previously reported by microglia in other disease contexts34–36 (Fig. 2e–g). This probably represents the initial sensing of microglia to metastatic infiltration and tissue damage37. Topic 15 showed a more restricted expression pattern and was enriched for genes associated with antigen presentation (AP) (Cd74, H2-Aa and H2-D1) (Fig. 2e–g), which has also been observed in glioma and Alzheimer’s disease34,36. AP genes enable AP to T cells, raising the question of whether microglia present antigen to T cells in the CNS. Topic 14 was expressed by a small subset of microglia and was associated with a secretory phenotype (Fig. 2e–g). This topic was enriched for genes associated with exosomes (Cd63), lipid metabolism (Apoe and Lpl) and cytokines (Spp1, Csf1, Il1b and Tnf) (Fig. 2e,g). This topic strongly overlaps with the signature of disease-associated microglia or ‘DAMs’, a population of phagocytic microglia identified in neurodegeneration38. The IFN response and AP topics both included genes encoding numerous chemokines for immune cell trafficking (Fig. 2e,g and Supplementary Table 5). A final topic (topic 3) was enriched for ribosomal genes (Extended Data Fig. 2f and Supplementary Table 5), which could indicate cells with increased transcriptional capacity or stress response. These data show that microglia upregulate multiple pro-inflammatory programmes, suggesting they play diverse roles in the immune response to BCBM.
The microglia response is conserved in diverse BCBM models
We validated the microglia pro-inflammatory response at the protein level by flow cytometry, in situ immunofluorescence (IF) and cytokine array. We evaluated three key markers by flow cytometry: bone marrow stromal antigen 2 (BST2), major histocompatibility complex II (MHC-II) and CD74 (refs. 39–42). We found increased expression of each marker was conserved in five different BCBM models (Fig. 3a and Extended Data Fig. 3a,b), showing conservation of the microglia response to metastasis.
Fig. 3 |. The microglia pro-inflammatory response is conserved in diverse BCBM models.
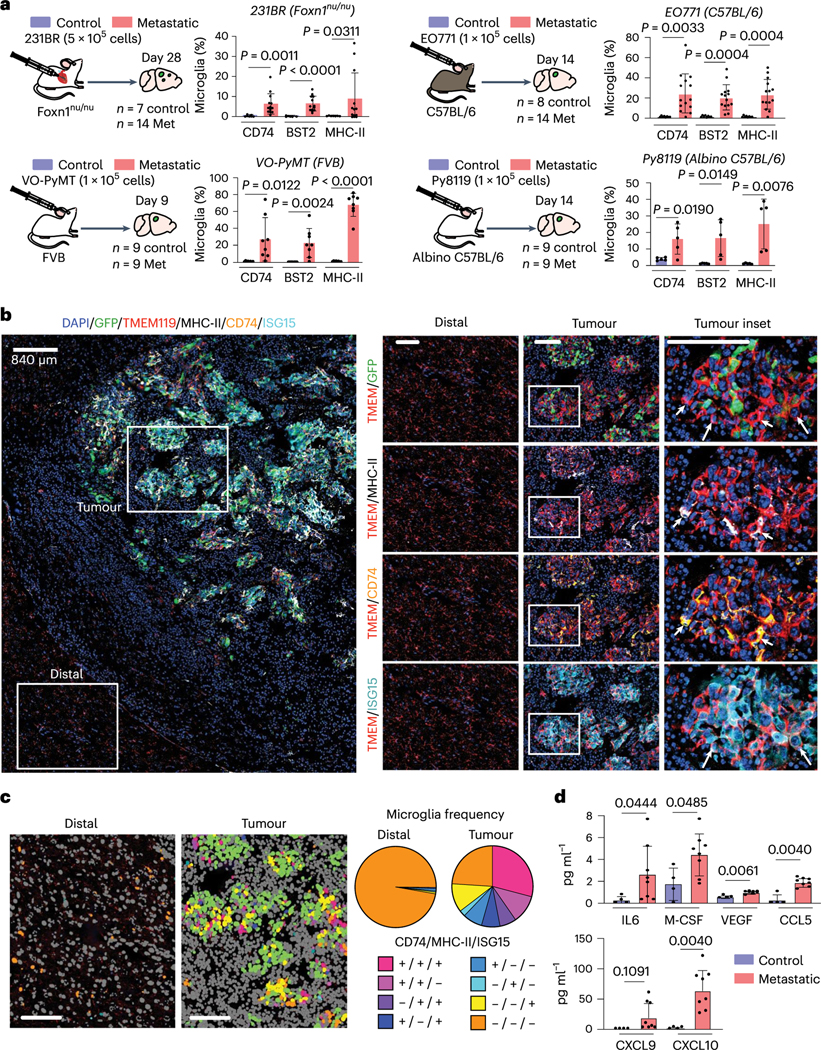
a, Flow cytometry analysis of CD74, BST2 and MHC-II expression in microglia from four BCBM models. Microglia were identified by gating on CD45lo, CD11b+, Ly6− C cells58,59. Bar graphs show the percentage of microglia expressing each marker. Pvalues were generated by an unpaired two-sided Student’s t-test, error bars indicate mean ± standard deviation. b, In situ analysis of microglia pro-inflammatory marker expression by multiplex IF (CODEX). Brain tissue slices from mice bearing E0771-GFP tumours were stained for DAPI (blue), and antibodies against GFP (green), TMEM119 (red), MHC-II (white), CD74 (yellow) and ISG15 (cyan). Left: overview of all markers. Scale bar, 840 μm. Right: pairwise marker expression in higher-magnification insets of tumour and distal regions. Short arrows indicate representative microglia expressing AP markers (TMEM119+ MHC-II+CD74+), and long arrows indicate representative microglia expressing IFN response marker (TMEM119+1SG15+). Results are representative of two independent experiments. Scale bar, 100 μm. c, Quantification of pro-inflammatory markers in brain tissue slices. Microglia were identified on the basis of TMEM119 expression and then scored for marker expression. Left: images showing phenotype in representative tumour and distal regions. Tumour cells (ISG15+TMEM119−) and other non-microglia cells (TMEM119−CD74−MHC-II−SG15−) are shown in green and grey, respectively. Right: pie graphs showing the proportion of microglia displaying marker combinations. Frequencies are as follows: CD74+MHCII+ISG15+, distal <0.01, tumour 0.29; CD74+MHC-II+ISG15−, distal <0.01, tumour 0.11; CD74−MHC-II+-SG15+, distal <0.01, tumour 0.07; CD74+MHC-II+ISG15+, distal <0.01, tumour 0.07; CD74+MHC-II−ISG15− distal 0.01, tumour 0.08; CD74−MHC-II+ISG15−, distal <0.01, tumour 0.02; CD74−MHC-II+ISG15+, distal 0.01, tumour 0.11; CD74−MHC−II−ISG15+, distal 0.97, tumour 0.24. n = 4 mice per condition. Scale bar, 100 μm. d, Analysis of cytokine expression by microglia in BCBM. Microglia were isolated from control (n = 4) and metastatic (E0771-C57BL/6, n = 8) brains by flow cytometry, and cell lysates were analysed by cytokine array (Eve Technologies). Pvalues shown are the result of a two-sided unpaired Mann-Whitney t-test.
We used a multiplex IF system (co-detection by indexing, CODEX) for in situ validation. We co-stained for MHC-II, CD74 and IFN-stimulated gene 15 (ISG15), as well as TMEM119 and GFP to identify microglia and tumour cells, respectively. We found that pro-inflammatory microglia localize proximal to tumour cells, while distal microglia are negative (Fig. 3b,c and Extended Data Fig. 3c). The highest frequency of microglia co-expressed all three markers (MHC-II+CD74+ISG15+, 29%) (Fig. 3c). We also observed subpopulations of microglia that express only the AP markers (MHC-II+CD74+ISG15−, 11%) or the IFN response marker (MHC-H−CD74−ISG15+, 11%) (Fig. 3c). These data are consistent with our topic modelling, showing substantial marker overlap but notable exclusivity of the AP and IFN response programmes into different subsets of microglia.
We investigated the pro-inflammatory function of microglia using a cytokine array. Consistent with our scRNA-seq, we found that microglia from tumour-bearing brains upregulate several pro-inflammatory cytokines, including macrophage colony-stimulating factor (CSF1), chemokine ligand 5 (CCL5), chemokine ligand 9 (CXCL9) and chemokine ligand 10 (CXCL10) (Fig. 3d)43,44. Taken together, these data validate our scRNA-seq results at the protein level and demonstrate that microglia display a pro-inflammatory response to BCBM.
Animals lacking microglia show increased tumour progression
Prior work established a pro-tumourigenic role for TAMs in brain cancers and metastases17–22. These studies primarily utilized CSF1R inhibitors and CX3CRl-targeted genetic ablation strategies that target microglia and other types of TAM17–22,45. A genetic model was recently developed that specifically lacks microglia due to deletion of a key super-enhancer in the Csf1r locus called the fms-intronic regulatory element (FIRE) (Fig. 4a)24. The Csf1rΔFIRE/ΔFIRE (FIRE-knockout (KO)) model lacks microglia while retaining most brain-resident macrophages and bone marrow-derived myeloid cells, which we confirmed by flow cytometry (Fig. 4b)24,46. We investigated the role of microglia in BCBM by comparing tumour progression in FIRE-wild-type (WT) and FIRE-KO animals. Mice were injected with GFP and luciferase-labelled E0771 cells and monitored by in vivo bioluminescence (IVIS) (Fig. 4c). Surprisingly, many FIRE-KO mice quickly developed overt clinical symptoms of advanced disease (Fig. 4d,e). Five of 14 FIRE-KO mice died before endpoint (36% mortality), while all 19 FIRE-WT survived (0% mortality) (Fig. 4d). Surviving FIRE-KO mice also displayed >20% decrease in body mass compared with FIRE-WT, indicating increased morbidity (Fig. 4e). IVIS imaging revealed differences in the kinetics of tumour growth over time (Extended Data Fig. 4a,b). We observed tumour rejection in 8 of 19 FIRE-WT mice, while signal continued to increase in all 14 FIRE-KO animals (Fig. 4f and Extended Data Fig. 4a,b). We further compared tumour engraftment in FIRE-KO and FIRE-WT mice using a serial dilution approach. This showed increased engraftment efficiency and larger tumour growth in FIRE-KO compared with FIRE-WT mice (Extended Data Fig. 4c,d). Together, these data show that animals lacking microglia demonstrate increased tumour growth and engraftment, and decreased capacity for tumour rejection.
Fig. 4 |. Animals lacking microglia demonstrate reduced capacity for tumour rejection.

a, Schematic depiction of Csf1rΔFIRE/ΔFIRE mouse model. Deletion of FIRE super-enhancer in FIRE-KO mice leads to loss of CSF1R protein expression in specific tissues. In the CNS, microglia do not develop, while monocyte and macrophage numbers are unaffected. b, Representative flow cytometry plots show the percentage of CD45loCD11b+ microglia and CD45hi immune cells gated from live (Sytox negative), single cells in FIRE-WT (n = 2) and FIRE-KO (n = 2) mouse brains. c, Schematic of experimental design to compare disease progression in FIRE-WT and FIRE-KO mice. FIRE-WT (n = 19) and FIRE-KO (n = 14) mice were injected intracranially with 100,000 GFP- and luciferase (GFP-Luc)- labelled E0771 cells. Control FIRE-WT mice (n = 8) were also injected with PBS. Animals were imaged for luminescence (IVIS) every 3 days before dissection at endpoint on day 14. d, Kaplan-Meier plot shows survival in FIRE-WT (19/19,100%) and FIRE-KO (9/14,64%) mice. Pvalue determined by log-rank (Mantel-Cox) test. e, Bar graph shows percentage body weight change for surviving PBS-injected (n = 8), FIRE-WT (n = 19) and FIRE-KO (n = 9) animal from d at day 14 relative to day 0. Pvalues determined by unpaired two-sided Student’s t-test, and error bars represent mean ± standard deviation. f, Bar graph summarizing the frequency of animals that displayed tumour growth and tumour rejection in FIRE-WT and FIRE-KO mice. Tumour rejection was defined by a lack of engraftment or engraftment followed by tumour rejection. Pvalue was determined by two-sided Fisher’s exact test.
Microglia promote NK and T cell responses to BCBM
Given the reduced tumour rejection we observed in FIRE-KO mice, we hypothesized that microglia promote tumour rejection through T cells. We tested this hypothesis by determining whether FIRE-KO mice show a reduced T cell response to BCBM. We injected E0771 cells into FIRE-WT and FIRE-KO animals and compared the number and frequency of NK, T and myeloid cell populations by flow cytometry in the brain on day 7 when we begin to observe tumour rejection (Fig. 5a and Extended Data Fig. 4b). Although ex vivo analysis showed no significant difference in tumour size at this timepoint (Extended Data Fig. 5a), FIRE-KO mice had reduced numbers and frequencies of all T cell subsets, including CD4+, CD8+ and T regulatory (Treg) cells (Fig. 5b,c and Extended Data Fig. 5b). NK and NKT cells were almost completely absent in FIRE-KO animals (Fig. 5b,c). Analysis of functional markers showed consistent reductions in the numbers of CD8+ and CD4+ effectors and central memory T cells in FIRE-KO (Extended Data Fig. 5c). We also found a significant decrease in the number of degranulating CD107a+ NK and CD8+ cells in FIRE-KO (Fig. 5d). Analysis of CD11b+Ly6c+ monocytes showed no significant difference in their numbers between FIRE-WT and FIRE-KO (Extended Data Fig. 5d). Further analysis revealed that the CD8+ T cell frequency negatively correlates with Tregs in FIRE-WT, but positively in FIRE-KO (Extended Data Fig. 5e). This means that, in FIRE-WT, mice with more CD8+ T cells have fewer Tregs, while in FIRE-KO, mice with more CD8+ T cells also have more Tregs. Thus, in the absence of microglia, the CD8+ T cells may be less effective at inducing tumour rejection because there are relatively more immunosuppressive Tregs. In sum, these data suggest that microglia promote an anti-tumour immune microenvironment through supporting NK, NKT and T cell responses to BCBM.
Fig. 5 |. Microglia promote NK and T cell responses to BCBM.

a, Schematic of experimental design to compare NK and T cell responses in FIRE-WT and FIRE-KO E0771 tumour-bearing mice. FIRE-WT (n = 8) and FIRE-KO (n = 8) mice were injected intracranially with 100,000 E0771 GFP-Luc cells. Animals were imaged for luminescence (IVIS) on days 1,4 and 6before dissection on day 7. b, Analysis of NK and T cell subsets in FIRE-WT (n = 7) and FIRE-KO (n = 8) mice by flow cytometry. Representative FACS plots show gating for each NK and T cell subset after gating for single, live (Sytox-negative) cells. c, Bar graphs showing cell counts for NK and T cell subsets. Counts shown are out of 100,000 single, live cells analysed. Pvalues are the result of a Student’s unpaired two-sided t-test. Error bars represent mean ± standard deviation. d, Analysis of CD107a expression in NK and CD8+ T cells by flow cytometry. FACS plots (left) show expression of CD107a from spleen and brains of representative animals from each cohort. Bar graph shows cell counts out of 100,000 single, live cells. Pvalues are the result of a Student’s unpaired two-sided t-test. Error bars represent mean ± standard deviation.
Microglia and T cells coordinate the anti-tumour response
We further investigated whether the tumour-suppressive effect of microglia is mediated through T cells by evaluating tumour growth in FIRE-WT animals lacking T cells. We used two approaches to target T cells, treatment with SIP inhibitors (FTY720) that block T cell trafficking to the CNS, and RAG1-KO mice that lack T cells (Fig. 6a). Animals were first injected with E0771 cells on day 0. FTY720 and vehicle were injected daily starting on day 0 until endpoint on day 12. Flow cytometry analysis confirmed T cell depletion in the brain using both approaches (Fig. 6b and Extended Data Fig. 6a). The frequencies of microglia and monocytes were not significantly different among the groups (Extended Data Fig. 6b,c). In both FTY720 and RAG1-KO groups, we found increased tumour engraftment and tumour burden relative to control animals (Fig. 6c,d and Extended Data Fig. 6d). This shows that microglia-replete animals are less able to suppress BCBM in the absence of T cells, suggesting that microglia suppress BCBM at least in part through supporting the T cell response.
Fig. 6 |. Microglia and T cells coordinate the anti-tumour response.

a, Schematic of experimental design to determine effects of T cell deficiency on BCBM. Tumour burden was compared in three cohorts of animals, FIRE-WT vehicle treated (Veh., n = 13), FIRE-WT FTY720 treated (FTY, n = 6) and RAG1-KO (RAG1, n = 12). Vehicle (PBS + 0.1% DMSO) or FTY720 (5 mg kg−1) were administered via intraperitoneal injection to FIRE-WT animals on day 0 and repeated daily. A total of 70,000 E0771 GFP-Luc cells were delivered to each animal in all three cohorts by intracranial injection on day 0 following drug delivery. Brain tissues were collected at endpoint on day 12 and analysed for tumour burden by IVIS and immune response by flow cytometry. b, Bar graph showing the percentage of TCRb+ T cells in brain tissues collected from each cohort (n = 6 Veh., n = 6 FTY, n = 4 RAG1) of animals at endpoint, gated out of single, live (Sytox negative) CD45hl cells as shown in Extended Data Fig. 6a,b. Pvalues shown are the result of an unpaired two-sided Student’s t-test. Error bars represent mean ± standard deviation. c, Quantification of E0771 tumour engraftment at endpoint on day 12 by IVIS. Bar graph shows frequency of animals in vehicle (Veh.), FTY720 (FTY) and RAG1-KO (RAG1) groups that grew tumours. P = 0.51 Veh. versus FTY. and P = 0.21 Veh versus RAG1 by two-sided Fisher’s exact test. d, Quantification of E0771 tumour burden at endpoint on day 12 by IVIS. Box-and-whisker plots show total flux per brain of vehicle (Veh.)- and FTY720 (FTY)-injected FIRE-WT and RAG1-KO (RAG1) cohorts. Bounds of box and whiskers are indicative of the first through fourth interquartile range. Pvalues shown are the result of an unpaired two-sided Student’s t-test. e, Analysis of pro-inflammatory marker expression in microglia from T cell-deficient mice (n = 6 Veh., n = 6 FTY, n = 4 RAG1). Left: FACS plots showing expression of MHC-II, CD74 and BST2 in representative animals, following gating on single, live (Sytox-negative) CD4SintCD11b+Ly6cneg microglia as shown in Extended Data Fig. 6b. Right: bar graphs showing the percentage of marker positive microglia in each cohort. Pvalues are the result of an unpaired two-sided Student’s t-test. Error bars represent mean ± standard deviation.
We also found interesting differences in microglia marker expression between WT and T cell-deficient animals. Microglia from FTY720-treated mice showed 3.1- and 1.6-fold lower percentages of the AP markers MHC-II+ and CD74+, respectively (Fig. 6e). The reduced expression of these proteins was even more pronounced in RAG1-KO mice (Fig. 6e), indicating that this is not simply an effect of FTY720 treatment. Furthermore, FTY720-treated and RAG1-KO mice had a 2-fold and 9.4-fold (higher percentage of microglia positive for the IFN response protein BST2, respectively (Fig. 6e). This suggests that T cells may be required to fully license microglia to upregulate the AP programme, and without T cells, microglia are limited to the IFN response programme.
Altered microglia activation in animals lacking T cells
We used scRNA-seq to determine whether microglia upregulation of the AP programme is dependent upon T cell infiltration. We transplanted E0771 cells into C57BL/6 and RAG1-KO mice and evaluated gene expression in sorted immune cells at two timepoints, days 4 and 10 (Fig. 7a). Clustering and marker gene analysis identified nine major immune cell types (Fig. 7b and Extended Data Fig. 7a). Subset analysis revealed a >2-fold increase in the frequency of T cells from day 4 to 10 (Extended Data Fig. 7a), indicating increasing T cell infiltration with tumour progression. No T cells were detected from RAG1-KO mice (Extended Data Fig. 7a). We also found a robust expansion of T cell diversity from day 4 to 10 (Extended Data Fig. 7b–d). Most notable was the decrease in naive T cells and increase in proliferating and CD8 effector T cells, showing that the relative frequency of activated T cells increases in the brain over time (Extended Data Fig. 7b–d).
Fig. 7 |. Altered microglia activation in animals lacking T cells.

a, Schematic of experimental design to evaluate changes in microglia and T cell activation over time. A total of 100,000 EO771 GFP-Luc cells were administered through intracranial injection to C57BL/6 (n = 6) and RAG1-KO (n = 6) mice at day 0. Brain tissues were collected 4 days (n = 3 per group) and 10 days (n = 3 per group) post injection and sorted for live, CD45hi-int cells by flow cytometry for scRNA-seq analysis. b, UMAPs showing all immune cells (n = 31,053 cells) (left), microglia coloured by subcluster (middle) and microglia coloured by condition (right). UMAPs for microglia were downsampled to display an equal number of microglia from each condition (n = 1,000 cells per condition). c, Bar graph showing the mean topic score for each programme (AP, secretory, and IFN response) in all microglia from each condition. d, Violin plots quantifying the expression of key markers of the secretory, IFN response and AP programmes in microglia from each condition. e, Feature plots illustrating the distribution of key markers of the secretory, IFN response and AP programmes in microglia. f, Heat map of log2 fold change (FC) of key markers of the secretory (Secr, top), IFN response (IFNR, middle) and AP (bottom) programmes separated by timepoint and mouse strain. g, UMAP plot of pseudotemporal cell ordering results performed using Monocle 3 showing microglia cell state ordering beginning with the homeostatic state (pseudotime 0). Violin plot shows the contribution of each microglia cluster at specific pseudotime values. Microglia cell states are ordered by the median pseudotime value displayed as a black bar.
We performed subset analysis of microglia to determine how their gene expression changes over time in parallel with T cell activation (Fig. 7b and Extended Data Fig. 7e). Subclustering of microglia showed similar populations as we previously identified (Fig. 7b). We scored each microglia in the dataset for expression of top genes associated with each topic (Fig. 7c and Supplementary Table 3), IFN response, secretory and AP. This showed that all three programmes increase over time from day 4 to 10 in C57BL/6 animals. At day 4, we observed the highest mean score for the secretory programme and lowest for the AP programme, suggesting that more microglia express the secretory than AP programme at the early timepoint (Fig. 7c). We found limited to no expression of the AP programme in microglia from RAG1-KO mice that lack T cells (Fig. 7c–f). In contrast, we found similar expression of the secretory and IFN response programmes in C57BL/6 and RAG1-KO mice, indicating that the AP but not secretory and IFN response programmes are dependent on lymphocytes. Top markers of each programme showed a similar pattern, where large numbers of microglia express CD63 (secretory) and BST2 (IFN response) at day 4 but limited microglia express CD74 (AP) (Fig. 7d–f). Pseudotemporal analysis (Monocle) suggested that microglia follow a progression from homeostatic, through the secretory and IFN response, ending in the AP and cycling clusters (Fig. 7g). These data support a model where microglia initially upregulate the secretory and IFN response programmes in response to cancer cell appearance in the brain, followed by upregulation of genes for AP after lymphocyte infiltration. This may serve to sustain T cell activation locally in the brain and explain why microglia loss results in a diminished T cell response. Of note, we also observe an expansion of immune-suppressive cells (Tregs and monocytes) at the later timepoint (Extended Data Fig. 7a,c), which may counteract anti-tumour immunity and explain why tumours continue to grow in some animals.
The pro-inflammatory response is conserved in human microglia
We investigated the pro-inflammatory response in human microglia and its relevance in patients with BCBM. We developed a humanized mouse model of BCBM based on prior work, where MITRG mice (human CSF1, IL3 and TPO knock-in to Rag2−/−ll2rγ−/− mice) are reconstituted with human microglia and macrophages following transplantation of human induced pluripotency-derived haematopoietic progenitor cells (iHPSCs) into the postnatal brain47–49. In contrast to patient BCBM samples, we were able to use these animals to investigate the initial response of human microglia to tumour initiation. We injected MITRG mouse pups with GFP-labelled iHPSCs, allowed engraftment for 10 weeks, and injected mCherry-labelled 231BR cells intracardially (Fig. 8a). Control and metastatic mice were collected 3 weeks later, and fluorescence microscopy confirmed the engraftment of GFP+ human microglia and mCherry+ 231BRmetastases (Extended Data Fig. 8a). Human cells were subsequently isolated and captured for sequencing (Fig. 8a).
Fig. 8 |. The pro-inflammatory response is conserved in human microglia and associated with better prognosis in patients with BCBM.

a, Schematic showing experimental design for scRNA-seq of human microglia from humanized MITRG mice transplanted with 231BR cells. MITRG mouse pups were injected with GFP-labelled iHPSCs, aged to 10 weeks and injected intracardiac with mCherry-labelled 231BR cells. Brains from control (n = 3) and metastatic (n = 3) mice were digested to single-cell suspensions 3 weeks later. Dissociated cells from each sample were indexed using MULTI-seq. Mouse cells were removed using anti-mouse MHC-I magnetic beads, and recovered cells were pooled into metastatic or control samples for scRNA-seq. b, tSNE plot shows human cells (n = 21,353) coloured by mouse and labelled by cell type. Top marker genes (grey) for each cell type were identified using the Wilcoxon rank-sum test. For full marker gene list, see Supplementary Table 6. pvMacro, perivascular macrophages. c, Bar plot showing selected top GO terms associated with the human BCBM microglia response signature. Differentially expressed (DE) genes (n = 4,904, adjusted P< 0.05) were determined using the Wilcoxon rank-sum test. GO terms were determined using Enrichr and select upregulated terms with Pvalues <0.05 were retained. For full gene list, see Supplementary Table 6. d, Kaplan-Meier plot showing overall survival probability in human patients with BCBM stratified by expression of canonical microglia genes. Bulk RNA-seq data from patient BCBM tumours (n = 20, Varešlija et al.)50 were scored for microglia gene signature and stratified into high and low groups. Scores were determined using the sum of scaled and centred values from log(CPM +1) transformed data, HR=hazard ratio. e, Model for role of microglia in promoting anti-tumour immunity. In microglia-replete conditions (+Microglia), microglia respond to BCBM by upregulating pro-inflammatory programmes (IFN response, AP and secretory) that promote anti-tumour CD4, CD8 and NK cell responses and tumour regression in the CNS. In microglia-depleted conditions (-Microglia), NK and T cell responses are deficient and the proportion of Tregs is increased, resulting in tumour progression. In animals lackingT cells (-T cells), microglia fail to upregulate AP genes and tumour regression is not observed, suggesting that T cells are required for complete microglia activation and that reciprocal microglia-T cell activation is critical for tumour suppression.
Clustering and marker gene analysis revealed a distinct population of 231BR cells (VIM) and several populations of myeloid cells (Fig. 8b, Extended Data Fig. 8b–f and Supplementary Table 6). These included human perivascular macrophages (CD163), microglia (TMEM119, P2RY12) and a population of proliferating myeloid cells (MK167) (Fig. 8b, Extended Data Fig. 8d–f and Supplementary Table 6). We identified 4,904 genes differentially expressed between microglia from control and metastatic brains (Supplementary Table 6). GO analysis revealed that similar pathways were upregulated in human microglia as observed in mouse (Fig. 8c). We used gene scoring to investigate human microglia heterogeneity and expression of the core topics upregulated in mouse BCBM (Fig. 2d–f and Supplementary Table 3). This showed distinct but overlapping expression of the IFN response, AP and secretory programmes in subsets of human microglia like observed in mouse (Extended Data Fig. 8g–i). Importantly, upregulation of the IFN response and AP topics in this model was not as robust as observed in mouse microglia (Extended Data Fig. 8i). This is consistent with the more severe immune defects in MITRG mice and our findings that T cells are important for microglia activation.
We compared the prognostic relevance of microglia signatures in patients with BCBM using a bulk RNA-seq dataset of human BCBM tumours50. We found that patients with a high expression of canonical microglia markers had significantly better overall survival, suggesting increased microglia infiltration is associated with better outcomes (Fig. 8d). We further found that higher expression of key genes characteristic of the AP (MHC-II) and secretory programmes (CSF1) are associated with increased overall survival, while higher expression of the IFN response gene BST2 is associated with decreased survival (Extended Data Fig. 8j). These data suggest that the microglia pro-inflammatory response can be clinically beneficial in patients and support the hypothesis that activation of microglia by T cells (that is, upregulation of the AP programme) is a key feature of anti-tumour microglia, and incomplete activation (that is, IFN response programme only) leads to worse outcomes. In sum, our study supports a model where microglia are critical to support the anti-tumour immune response in the CNS and suppress BCBM (Fig. 8e).
Discussion
We utilized scRNA-seq, genetic and humanized mouse models to investigate the role of microglia in BCBM. Our scRNA-seq analyses revealed that mouse microglia upregulate three core pro-inflammatory programmes in response to BCBM, IFN response, AP and secretory. It is important to acknowledge the effects that tissue dissociation may have on the transcriptome, so we further validated key pro-inflammatory markers at the protein level in situ on undigested tissues51,52. Using the FIRE-KO model, we found that animals lacking microglia demonstrate less capacity for tumour regression due to reduced anti-tumour T and NK cell responses. T cell depletion experiments revealed altered microglia activation and less tumour regression in the absence of T cells, suggesting that reciprocal microglia–T cell activation is critical for tumour suppression. Finally, we used a humanized mouse model to show that human microglia upregulate similar pro-inflammatory response programmes in response to BCBM and found that markers of AP by microglia are associated with better prognosis in patients with BCBM, raising the prospect of targeting microglia to treat BCBM.
The pro-inflammatory, tumour-suppressive role of microglia that we observe contrasts with the anti-inflammatory, pro-tumourigenic role previously ascribed to microglia and other TAMs. There are several possible explanations for these different results. Microglia depletion in the FIRE-KO model is more complete and restricted to microglia than other approaches24,53. Furthermore, microglia cannot rebound and repopulate the brain or become reprogrammed as has been observed in other depletion models54,55. The massive cell death produced in the Cx3cr1CreERT/+:ROSA26iDTR/+ depletion model has also been shown to induce cytokine storm and astrogliosis, which may have confounding effects on tumour growth and the immune response56,57. Another important distinction is that the FIRE-KO mice lack microglia from birth, while most prior studies targeted TAMs postnatally and after tumour initiation. It is therefore plausible that the timing of depletion impacts the outcome, as microglia and TAMs may become tumour-promoting as disease progresses.
It will be important in future work to investigate the mechanism by which microglia support anti-tumour T cell responses in the CNS. We found that pro-inflammatory microglia secrete several chemokines that could promote T cell trafficking to the CNS, such as CCL5, CXCL9 and CXCL10 (Fig. 3d). Pro-inflammatory microglia also upregulate AP machinery (Fig. 2), which could enable them to present tumour antigens to CD4 or CD8 T cells and sustain T cell activation locally in the brain. It will also be important to understand why microglia ultimately fail to control disease progression in the CNS to discover ways to reactivate CNS immunity in patients with BCBM.
Online content
Any methods, additional references, Nature Portfolio reporting summaries, source data, extended data, supplementary information, acknowledgements, peer review information; details of author contributions and competing interests; and statements of data and code availability are available at https://doi.org/10.1038/s41556-023-01273-y.
Methods
Research within this publication complies with relevant ethical regulations. Animal studies were performed in accordance with an Institutional Animal Care and Use Committee (IACUC)-approved protocol #AUP-19-051 at the University of California Irvine. Human formalin-fixed paraffin-embedded samples were exempted by institutional review board as human subjects research due to patient de-identification.
Normal human brain and human BCBM samples
Formalin-fixed paraffin-embedded sections from four de-identified normal female human brains and resected BCBMs were acquired from University of California Irvine Department of Pathology and Laboratory Medicine, experimental tissue shared resource facility and the University of California Davis Pathology Biorepository.
Cell lines
MDA-MB-231-Br2 (ref. 25) cells stably transduced with membrane-targeted AcGFP (rLV.EF1.AcGFP1Mem-9, ClonTech/Takara Bio cat. no. 0019VCT), mCherry (rLV.EF1.mCherry-9, ClonTech/Takara cat. no. 0037VCT), and luciferase lentivirus were a gift from Ian Smith (Parker, 2017, Bos, 2009). 4T1 cells were purchased from ATCC (ATCC cat. no. CRL-2539, RRID: CVCL_0125), stably infected with GFP lentivirus (Santa Cruz Biotechnology, copGFP Control Lentiviral Particles cat. no. sc-108084) at a multiplicity of infection of 10, and sorted for GFP expression. E0771 cells were purchased from CH3 Biosystems (cat. no. 94A001, RRID: CVCL_GR23) and stably infected with pCDH-EF1a-eFFly-eGFP lentivirus particles. pCDH-EF1a-eFFly-eGFP was a gift from Irmela Jeremias (Addgene plasmid #104834; http://n2t.net/addgene:104834; RRID: Addgene_104834).To produce lentiviral particles, HEK293T cells were transfected with pCDH-EF1a-eFFly-eGFP together with pMD2G and psPAX2 packaging plasmids using Lipofectamine 2000 (Invitrogen cat. no.11668027). Supernatants containing lentiviral particles were used to infect E0771 cells overnight in the presence of 8 μg ml−1 polybrene (Sigma-Aldrich cat. no. TR-1003-G). Transduced E0771 cells were sorted by GFP expression on a BD FACSAria Fusion cell sorter. MDA213-BRm and4T1 cell lines were cultured in Dulbecco’s modified Eagle medium, 5% foetal bovine serum, 10 U ml−1 penicillin, 0.1 mg ml−1 streptomycin (GE Healthcare cat. no. SV30010), at 37 °C, 5% CO2, 95% relative humidity. E0771 cells were cultured in RPMI1640, 5% foetal bovine serum, 10 U ml−1 penicillin, 0.1 mg ml−1 streptomycin and 10 mmoll−1 HEPES at 37 °C, 5% CO2, 95% relative humidity. All cell lines were authenticated by short tandem repeat profiling analysis by ATCC before injection.
Mouse strains
Female Foxn1nu/nu mice (IMSR cat. no. JAX:007850, RRID: IMSR_JAX:007850), FVB (IMSR cat.no.JAX:001800, RRID: IMSRJAX:001800), C57BL/6J (IMSR cat. no. JAX:000664, RRID: IMSRJAX:000664), B6(cg)-Tyrc-2J/J (IMSR cat. no.JAX:000058, RRID:IMSRJAX: 000058, albino B6), BALB/cJ (IMSR cat. no.JAX:000651, RRID: IMSRJAX:000651) and B6.129S7-Rag1tm1Mom/J (RAG1-KO) were purchased from The jackson Laboratories. Female MITRG mice (IMSR cat. no. JAX:017711, RRID: CVCL_JM19), which are C:129S2-Rag2tm1.1FlvCsfltm1(CSF1)Flv CSF2/IL3tm1.1(CSF2,IL3)Flv Thpotm1.1(TPO)Flv Il2rgtm1.1Flv/J were bred, housed and maintained by the laboratory of Mathew Blurton-Jones (IACUC protocol #AUP-17–162). Csf1rΔFIRE/ΔFIRE (FIRE-KO) and Csf1rFIRE/FIRE (FIRE-WT) mice were a gift from Claire Pridans and Mathew Blurton-Jones laboratories and were housed and maintained by the Lawson laboratory. All animals were aged between 5 and 15 weeks old. Only female animals were included in these studies because breast cancer predominantly afflicts women.
IF analysis of human BCBM samples
Four-micrometre sections were heated at 65 °C and deparaffinized in Histo-Clear (National Diagnostics, #HS-200). Tissues were rehydrated with graded solutions of ethanol (100% to 50%). Antigen retrieval was performed using a microwave pressure cooker with 10 mM citric acid buffer (0.05% Tween-20, Thermo Fisher Scientific cat. no. BP337500, pH 6.0). Tissues were blocked in blocking solution (0.1% Tween-20 and 10% goat serum in phosphate-buffered saline (PBS)), incubated with primary antibodies diluted in blocking solution at 4 °C overnight, washed in PBS, incubated with secondary antibodies diluted in blocking solution for 1 h at room temperature. Slides were mounted with VECTASHIELD Antifade Mounting Medium with 4′,6-diamidino-2-phenylindole (DAPI; Vector Laboratories, #H-1200) and micrographs were taken with the BZ-X700 Keyence fluorescence microscope.
Generation of BCBM in mice
Intracardiac injections were performed as described by Campbell et al.60 into the left cardiac ventricle of anaesthetized mice (300 mg kg−1 Avertin). For 231BR brain metastasis, 500,000 cells in 100 μl of Dulbecco’s PBS (DPBS) were injected into 9-week-old Foxn1nu/nu or 10-week-old MITRG mice. For 4T1 brain metastasis, 100,000 cells were injected into 9-week-old BALB/cJ mice in 100 μl of DPBS. For the intracranial injection of FVB, C57BL/6, FIRE-WT, FIRE-KO, RAG1-KO or albino B6, 100,000 VO-PyMT, E0771 or Py8119 cells were injected in 10 μl PBS to a depth of 3 mm into the right coronal suture of 5-week-old mice18,20. Tumours were not allowed to exceed 1.7 mm along any diameter or 10% of the animal’s body weight in accordance with IACUC protocol. Control mice were injected with 10 μl PBS. Injections were replicated in two to three cohorts of four to six mice and in different mouse strains to ensure reproducibility of results.
Dissection and visualization of mouse BCBM by whole mount fluorescence microscopy
Mice were euthanized and perfused with 50 ml of sterile ice-cold 1× PBS, 1 mg ml−1 ethylenediaminetetraacetic acid. The brain was dissected from the cranium and meninges, and whole brain metastasis was visualized on a dissection microscope (Leica Biosystems, DMC 2900) and imaged for GFP fluorescence and brightfield.
Mouse brain fixation and sectioning
Dissected brains were drop fixed into 4% paraformaldehyde, 1× PBS, pH 7.4 overnight at 4 °C and transferred into 30% sucrose 1× PBS for 24 h before cryosectioning on sliding microtome (Leica Biosystems, SM2010R). Serial 40-μm slices were collected into 1× PBS, 0.05% sodium azide and stored at 4 °C for floating section immunostaining.
IF staining of floating sections
Brain slices were blocked (1× PBS, 5% serum and 0.3% Triton X-100) and placed on an orbital shaker for 1 h. Blocking solution was replaced with 500 μl of primary antibody in blocking solution and incubated overnight at 4 °C. Brain slices were washed and incubated with secondary antibody for 1 h at room temperature. Brain slices were slide-mounted with VECTASHIELD Antifade Mounting Medium with DAPI (Vector Laboratories, #H-1200). Micrographs were taken with the BZ-X700 Keyence fluorescence microscope and acquisition software. Primary antibodies were rabbit polyclonal anti-IBA1 diluted 1:500 (RRID: AB_A39504 Wako cat. no. 019–19741). Secondary antibodies were diluted 1:400: goat anti-rat IgG conjugated with Alexa Fluor 568 and 488 (Thermo Fisher Scientific, RRID: AB_2535730 cat. no. A21069 and RRID: AB_2576217 cat. no. A11034); goat anti-rat IgG conjugated with Alexa Fluor 568 and 647 (RRID: AB_2534074 cat. no. A11006 and RRID: AB_141778 cat. no. A21247); goat anti-hamster conjugated with Alexa Flour 647 (RRID: AB_2535868 cat. no. A21451) (Thermo Fisher Scientific).
Quantification of IBA1IF in Foxn1nu/nu brains
Tissue sections from control (n = 4) and 28-day metastatic (n = 4) Foxn1nu/nu mouse brains were stained for IBA1. Micrographs were acquired on the BZ-X700 Keyence fluorescence microscope. Z-stack micrographs were compressed into maximum intensity projection and opened in FIJI (Fiji, RRID: SCR_002285). Images were quantified for the number of IBA1+ cells in 8–17 fields from 4 control and 4 metastatic mouse brains using the threshold, convert to binary, watershed and analyze particles functions. Data were tabulated and analysed in GraphPad Prism 9 (ref. 61, GraphPad Prism, RRID: SCR_002798).
CODEX imaging of mouse BCBM
C57BL/6 control or E0771-GFP tumour-bearing mouse brain tissue was prepared and immunostained following CODEX manual rev. C, and imaged using 20× PlanApo 0.75 numerical aperture lens on the CODEX automated imaging system with the Keyence 700 microscope and BZX software. A7 × 7 tile scan with 6×Z planes in 1.5 μm steps was taken and processed using the CODEX processor 1.8. The output images were segmented in QuPath using StarDist62. Segmented cells were phenotyped by a user-trained machine learning classifier in QuPath based on the marker expression for TMEM119, IBA1, MHC-II, CD74 and ISG15. The following antibodies, barcode/reporter and fluorescence combinations were used: TMEM119 (195H4, Synaptic Systems, 1:25) BX/RX035-ATT0550, MHC-II (M5/114.15.2, Akoya) BX/RX001-ATT0550, ISG15 (1H9L21, Thermofisher, 1:40) BX/RX045-CY5, CD74 (ln1/CD74, BioLegend 1:40) BX/RX036-CY5 and IBA1 (019–19741, Wako 1:80) BX/RX042-CY5. Custom conjugations of TMEM119, ISG15, CD74 and IBA1 were performed using the Akoya custom conjugation kit and barcodes, following the CODEX manual, and validated by sodium dodecyl sulfate-polyacrylamide gel electrophoresis and visual assessment of staining compared with standard IF with unconjugated antibody and fluorescent secondary antibody on FF mouse spleen or tumour sections.
Isolation of cells for scRNA-seq
Single-cell suspensions from mouse brains were prepared using the Adult Brain Dissociation Kit, Mouse and Rat (Miltenyi Biotec) with some modifications. Whole dissected brains were partitioned and placed into C tube (Miltenyi Biotec cat. no. 130-093-237) containing enzyme P and A (Foxn1nu/nu mice) or 1 mg ml−1 Collagenase D (Millipore Sigma cat. no. 11213857001), C57BL/6 and RAG1-KO mice. Brain tissue was digested using gentleMACS Octo Dissociator with heaters operating the 37 °C adult brain dissociation protocol. After removal of myelin by density centrifugation, the remaining red blood cells were lysed. Cells were blocked with anti-CD16/32 and stained with fluorescent antibodies. C57BL/6 and RAG1-KO cells from individual mice were labelled using a CellPlex multiplexed oligo labelling kit in accordance with the manufacturer’s protocol (10× Genomics cat. no. 1000261). The labelled cells were sorted on a BD FACSAria Fusion sorter. For sorting of microglia, astrocytes, cancer cells and total leukocytes, cells were gated for size on the basis of forward and side scatter, single cells and Sytox Blue viability (Thermofisher cat. no. S34857). All myeloid cells (CD45+ CD11b+) and astrocytes (CD45−, ACSA-2+) were sorted from control and metastatic mouse brains, GFP+ 231BR cells were sorted from metastatic brains, and total leukocytes (CD45+) were sorted from tumour-bearing control and RAG1-KO mouse brains into 500 μl of chilled FACS buffer.
scRNA-seq of murine brain leukocytes
FACS isolated mouse immune cells were resuspended in 0.04% BSA in PBS to achieve 1,000 cells μ−1. Final cell suspensions were counted on the Countess II automated cell counter. Cells were loaded onto the 10× Genomics Chromium Single Cell Gene Expression 3′ v2 Chemistry kits for gel beads-in-emulsion generation. Following the Chromium Single Cell 3′ Reagents Kits version 2 user guide (CG00052 Rev B), cells were loaded to achieve 10,000 cells for capture. Libraries were sequenced on the Illumina HiSeq 4000 (Foxn1nu/nu) or NovaSeq 6000 (C57BL/6, RAG1-KO) platform to achieve an average read depth of 50,000 mean reads per cell. Sequencing reads were aligned utilizing 10× Genomics Cell Ranger Count 3.0.2 to a dual indexed GRCh38 and mm10 reference genome.
Flow cytometry analysis of immune cells from control and BCBM mouse brain tissue
Tissue was prepared as for FACS sortingusing 1 mg ml−1 Collagenase D (Milipore Sigma cat. no. 11213857001) for digestion. Cells were stained with ZombieNIR viability dye (1:500, BioLegend cat. no. 423106), and blocked with anti-CD16/32 antibody. Next, cells were stained with fluorescent antibodies for extracellular markers and analysed using BD Fortessa X20 and FlowJov10 software. For intracellular staining of Foxp3 and CD3e, cells were fixed with the eBioscience Foxp3/Transcription Factor Staining Buffer set according to the manufacturer’s instructions (Thermofisher cat. no. 00-5523-00) for analysis on the BD Fortessa X20. The following antibodies were used for flow cytometry analysis: CD45-BV510 (BioLegend, 30-F11,1:100), CD45-FITC (BioLegend, 30-F11, 1:100), CD11b-BV605 (BioLegend, M1/70,1:200), CD11b-PE (BioLegend, M1/70,1:200), CD11b-BV650 (BioLegend, M1/70,1:200), ACSA-2-APC (Miltenyi, REA969,1:80), Ly6C-BV785 (BioLegend, HK1.41:200,1200), Ia/Ie (MHC-II)PacificBlue (BioLegend, M5/114.15.2,1:500), CD74-AF647 (BioLegend, In1/CD74,1:100), CD317-PE (BioLegend, 129C1,1:100), CD3-PerCPCy5.5 (BioLegend, 17A2,1:100), TCRb-PECy5 (BioLegend, H57-597, 1:100), NKl.l-PEDazzle594 (BioLegend, PK136,1:100), CD4BV605 (BioLegend, RM4-5,1:500), CD8a-PacificBlue (BioLegend, 53-6.7,1:500), Foxp3-PE (eBioscience, FJK-16s, 1:100), CD152 (CTLA-4)-APC (BD, UC10-4F10-11,1:100), CD44-PECy7 (BioLegend, IM7,1:100), CD62L-BV785 (BioLegend, MEL-14,1:100) and CD107a-FITC (BioLegend, 1D4B, 1:100).
In vitro differentiation and early postnatal transplantation of iHPCs
Differentiation of haematopoietic progenitor cells from iPSCs (iHPCs) was performed according to McQuade et al.47. Briefly, iPSCs were first passaged in mTeSR-E8 and transferred to Medium A from the STEMdiff Hematopoietic Kit (Stem Cell Technologies cat. no. 05310). On day 3, flattened endothelial cell colonies were transferred to Medium B for 7 days. On day 10, non-adherent CD43+ iHPCs were collected and frozen in Bambanker (Fisher Scientific cat. no. NC9582225) for later transplantation. Cells were thawed in iPS-microglia medium (Dulbecco’s modified Eagle medium/F12, 2× insulin-transferrin-selenite, 2× B27,0.5× N2, 1× GlutaMAX, 1× non-essential amino acids, 400 mM monothioglycerol and 5 mg ml−1 human insulin freshly supplemented with 100 ng ml−1 IL-34,50 ng ml−1 TGFb1 and 25 ng ml−1 M-CSF (Peprotech cat. no. 100–21) according to McQuade et al.47. Early postnatal intracerebroventricular transplantation of iHPCs was performed as described in Hasselmann et al.48.
Isolation of human xenotransplanted microglia
Ten-week-old, MITRG mice were injected intracardially with 500,000 mCherry-labelled 231BR cells as previously described. Twenty-five days post-injection, following perfusion with ice-cold PBS containing 5 μg ml−1 actinomycin D (act D, cat. no. A1410), whole metastatic brains were imaged on a dissection microscope (Leica Biosystems, DMC2900) for mCherry and GFP intensity. Half brains were dissected, fixing the left hemisphere in 4% paraformaldehyde for histology. The right hemisphere was prepped for dissociation as described in Hasselmann et al.48 with modifications. The cerebellum was removed, and the whole right hemisphere was stored briefly in RPMI1640 containing 5 μg ml−1 act D, 10 μM triptolide (Sigma-AIdrich cat. no. T3652), and 27.1 μg ml−1 anisomycin (Sigma-Aldrich cat. no. A9789). Tissue dissociation was performed using the Tumor Dissociation Kit, human (Miltenyi Biotec) as previously described with the kit’s enzymes, 5 μg ml−1 act D, 10 μM triptolide and 27.1 μg ml−1 anisomycin using the pre-programmed soft tumour protocol. Myelin and debris removal was performed in 8 ml 23% Percoll (GE Healthcare cat. no.45-001-748), overlaid with 2 ml of 1× DPBS.
MULTI-seq labelling and scRNA-seq of human microglia
Individual mice were barcoded following the ‘MULTI-seq lipid-tagged indices for sample multiplexing for scRNAseq’ protocol63. Lipid anchor and co-anchor reagents were a gift from Zev Gartner, and barcode index oligos were purchased from Integrated DNA Technologies. Mouse cell removal was performed using mouse cell removal beads (Miltenyi Biotec) separated using LS columns and the MidiMACs separator (Miltenyi Biotec). Control and metastatic samples were then pooled separately. Cells were resuspended to ~1,000 cells per microlitre in FACS buffer, according to counts performed on a haemocytometer.
scRNA-seq of MITRG human microglia
Final cell suspensions were counted on the Countess II automated cell counter to determine actual concentration for droplet generation. Cells were loaded onto the 10× Genomics Chromium Single Cell Gene Expression 3′ v3 Chemistry kits for GEM generation. Following the Chromium Single Cell 3′ Reagents Kits version 3 user guide (CG000183 Rev C), cells were loaded to achieve 10,000 cells for capture. MULTI-seq barcode libraries were prepared according to the MULTI-seq protocol63. Libraries were sequenced on the Illumina NovaSeq 6000 platform to achieve an average read depth of 50,000 mean reads per cell for 3′ gene expression libraries. MULTI-seq barcode libraries were sequenced to achieve at least 5,000 reads per cell.
Sequencing reads were aligned utilizing 10× Genomics Cell Ranger Count 3.1.0 to a dual indexed GRCh38 and mm10 reference genome. All libraries were aggregated using 10× Genomics Cell Ranger Aggr 3.1.0, to normalize the number of mean reads per cells. MULTI-seq reads were processed according to the MULTI-seq protocol64.
Analysis of BCBM in FIRE mice
Four 6-week-old Csf1rΔFIRE/ΔFIRE (FIRE-KO) and Csf1rFIRE/FIRE (FIRE-WT) mice were injected intracranially in the right coronal suture with 100,000 eGFP- and luciferase-labelled E0771 cells as previously described. Mice were imaged for luciferase luminescence 1 day after injection, and every 3 days thereafter until endpoint. Imaged mice were anaesthetized via isoflurane inhalant and administered 300 μg d-luciferin (Goldbio), intraperitoneally, in sterile DPBS. Following a 10-min incubation, mice were imaged for bioluminescence utilizing an IVIS Lumina III In Vivo Imaging System (Xenogen). Regions of interest were selected around each brain, and average photon flux (total photons s−1 cm−2) was recorded using Living Image analysis software (RRID: SCR_014247, ref. 65) with average background flux subtracted. At endpoint, mice were weighed, euthanized and dissected and whole brains were removed and placed in a 24-well tissue culture plate submerged in ice-cold PBS with D-luciferin (1.5 mg ml−1, Goldbio cat. no. LUCK-1G). After 10 min incubation, whole brains were placed on a black plastic card and imaged for luminescence for 1 s. A region of interest was drawn around each brain, and the total flux (ptotal photons s−1 cm−2) was recorded for analysis.
Fingolimod (FTY720) HCL dosing
FTY720 was purchased from Selleckchem (cat. no. S5002), and reconstituted to a final concentration of 1 mg ml−1 FTY720 (0.001% dimethyl sulfoxide, DMSO). Mice were injected intraperitoneally with 50–100 μl of vehicle or 5 mg kg−1 FTY720 immediately before intracranial injection with 70,000 E0771 eGFP eFFly cells, and daily for the duration of the experiment. The experimental groups were blinded when performing intracranial injections of E0771 cells.
Cytokine screen of microglia
Control and 14-day E0771 eGFP eFfly tumour-bearing brains were digested into single-cell suspension as previously described for flow cytometry. Cells were immunostained for BV510-CD45 (BioLegend clone 30-F11,1:100), BV605-CD11b (BioLegend clone M1/70,1:200), BV785-Ly6C (BioLegend clone HK1.4,1:200) and PE/Dazzle594-NK1.1 (BioLegend clone PK136,1:100). A total of 50,000 microglia per sample were FACS sorted on the basis of CD45lo, CD11b+Ly6C−NKl.l− expression into FACS buffer. Cells were resuspended in 100 μl of 150 mM sodium chloride, 1% NP-40 50 mM Tris pH 8.0 cell lysis buffer containing 1× Halt Protease Inhibitor (Thermo Fisher cat. no. 78430) and stored frozen at −80 °C. Frozen samples were shipped on dry ice to Eve Technologies Corp to perform a standardized mouse cytokine array / chemokine array 31-Plex (MD31, Millipore MILLIPLEX). The analytes tested for include eotaxin, G-CSF, GM-CSF, IFNγ, IL-1α, IL-1β, IL-2, IL-3, IL-4, IL-5, IL-6, IL-7, IL-9, IL-10, IL-12 (p40), IL-12 (p70), IL-13, IL-15, IL-17A, IP-10, KC, LIF, LIX, MCP-1, M-CSF, MIG, MIP-1α, MIP-1β, MIP-2, RANTES, TNFα and VEGF.
Human/mouse cell assignment
Cells were aligned to a merged GRCh38/mm10 genome using Cell Ranger v3. Cell species was determined on the basis of the frequency of reads aligning to the mouse genome with very-low-quality cells with <200 genes (nFeature_RNA) filtered before estimating. Cells were called as mouse for all cells above the top elbow in the mouse read mapping frequency plot (>0.875 for Foxn1nu/nu data; >0.95 for MITRG data), human for all cells below the bottom elbow (<0.05 for Foxn1nu/nu data; <0.1 for MITRG data), and any other cells were discarded as doublets or poor quality. Any counts for GRCh38 genes in the cells called as mouse were removed from the expression matrix and vice versa for mm10 genes in human cells.
Quality control metrics
Cells for the Foxn1nu/nu cell type identification analysis were filtered to have between 500 and 2000 genes (nFeature_RNA) and <10% mitochondrial genome reads (percent.mito) in any retained cell. Cutoffs were selected based on analysis of violin plots for visual outliers. Putative microglia/astrocyte doublet clusters with marker gene co-expression were removed from the Foxn1nu/nu microenvironment. This cell set was then used for subset myeloid and astrocyte analyses based on the cell type labels. Cells were filtered for the myeloid analysis to have <5% percent.mito and low ribosomal expression (<10% of their transcriptome representing Rps and Rpl genes). Cells for the MITRG analysis were filtered to have <20% percent.mito. Doublets and empty GEMs (Negative) were removed from the MITRG analysis based on MULTI-Seq barcoding label assignment from the R package deMULTIplex. Cell cycle signatures (S.Score and G2M.Score, determined by CellCycleScoring in Seurat) were regressed from the data for the 231BR analysis as well as the MITRG analysis before clustering and dimensionality reduction.
Clustering and differential expression
Main clustering and dimensionality reductions were performed in Seurat using the default Louvain and t-distributed stochastic neighbour embedding (tSNE) methods. Uniform Manifold Approximation and Projection (UMAP) was used for dimensionality reductions in microglia subclustering analyses to better visualize global relationships. Some datasets were integrated using the mutual kNN algorithm adaptation in Seurat before these steps. Specifically, integration was performed on the Foxn1nu/nu full microenvironment and astrocyte analyses by sequencing batch (Con1:Met1, Con2:Con3, Met2:Met3). Integrated analyses used the ‘vst’ selection method with nfeatures=2000 for Find-VariableFeatures and dims=l:30 for Find Integration Anchors and Integrate Data. Differential expression analyses were run on the RNA assay in Seurat with Find All Markers/Find Markers using the Wilcoxon rank-sum test, and adjusted P values represent the Bonferroni-corrected values for all single-cell analyses. Cell types and states were assigned to clusters manually based on gene expression profiles. All plotting functions through Seurat utilize ggplot2.
GO term analysis and gene scoring
GO term analyses were performed using the MouseMine32 web portal with list input for Mus musculus with the default background population for mouse analyses and using the Enrichr portal66,67 with a gene list input. Gene inputs included only genes considered differentially expressed with a Bonferroni-adjusted P value <0.05 from the Wilcoxon rank-sum test. GO terms were selected from the Gene Ontology Enrichment section for biological_process with Holm-Bonferroni-adjusted P value <0.05 in MouseMine or the GO Biological Process 2018 list in Enrichr with unadjusted P value <0.05. All gene scoring on single-cell data was performed in Seurat using the AddModuleScore function with default parameters. Microglia (MG) score gene list was taken directly as the Core MG list from Supplementary Table 3 in Bowman et al.30. Topic scores were determined for the MITRG mouse using the top 25 marker genes of each topic (ExtractTopFeatures with method=‘poisson’, options=‘min’, and shared=FALSE), translated to human using the biomaRt package.
LDA, topic model
To fit a topic model using LDA, we used the R package ‘CountClust’33, which was optimized for use on RNA-seq datasets. As input to our model, we provided a raw counts matrix containing all cells labelled as microglia and all detected genes from our Foxn1nu/nu dataset. The topic model was fit using the ‘FitGoM’ function, with a range of cluster numbers (K), and an error tol of 10. We chose the model with K= 15 since it achieved a relatively low value for the Bayesian information criterion and had enough resolution to provide topics with unique, biologically interpretable gene lists. Top gene markers for each topic were identified using the function ‘ExtractTopFeatures’ with method=‘poisson’, options=‘min’ and shared=TRUE for the marker heatmap (or shared=FALSE for gene scores).
Pseudotemporal ordering of cells
Monocle 3 (ref. 68) was used for trajectory inference and pseudotemporal ordering of cells. For input, the final annotated Seurat object was converted to a Monocle 3 cds object using the SeuratWrappers function as.cell_data_set. The counts data matrix was then processed with the standard Monocle 3 pipeline using default parameters in the preprocess_cds and reduce_dimension functions. Clustering was performed with cluster_cells using Resolution=3e-4 to maintain similar cluster assignments between Seurat and Monocle 3. The principal graph was constructed with the learn_graph function using one partition. To identify the root principal point for ordering cells, the helper function get_earliest_principal node was used as defined in the Monocle 3 vignette, using D4_BL6 cells in our timepoint_strain metadata column. Pseudotemporal ordering was then performed using order_cells with root_pr_nodes=get_earliest_principal_node(cds). To display the pseudotime data on the original Seurat UMAP embeddings, the Monocle cds object was converted to a Seurat object with the Seurat function as.Seurat and the pseudotime metadata column of the resulting object was transferred to the original Seurat object using AddMetaData. The pseudotime results were displayed as a feature plot using the plasma colour palette from the viridis library.
Survival analysis
Survival analysis was performed using the Brain-Met samples from Vareslija et al.50, based on the column header ‘M_’ from their Github uploaded counts matrix69). Counts per million (CPM) from this subset of the counts matrix was converted to log(CPM +1) using the ‘cpm’ function in edgeR. This matrix was then merged with the clinical information from Table 1 of Vareslija et al.50, resulting in 20 total samples (samples ‘7M_RCS’ and ‘19.2M_Pitt’ were dropped, the first due to a lack of matching clinical data and the second due to sample replication). Our genes and signatures of interest, CD74, BST2, MHC-II genes (‘HLA-DMA’, ‘HLA-DMB’,‘HLA-DOA’,‘HLA-DOB’,‘HLADPA1’,‘HLA-DPB1’,‘HLA-DQA1’, ‘HLA-DQA2’, ‘HLA-DQB1’, ‘HLA-DQB2’, ‘HLA-DRA’, HLA-DRB1’, ‘HLA-DRB3’, ‘HLA-DRB4’ and ‘HLA-DRB5’) and microglia (‘P2RY12’, ‘TMEM119’, ‘GPR34’, ‘CX3CR1’, ‘CD81’ and ‘SELPLG’) were converted to their Ensembl IDs using ‘maplds’ with multiVals=‘list’ from org.Hs.eg. db, and added to the dataset as log(CPM +1) for single genes, and the sum of the scaled data (z-scores) for multigene signatures. Survival analysis was performed using the R package survminer, where data stratification was performed using ‘surv_cutpoint’ and surv_categorize’ to identify an optimal split, and the Kaplan-Meier curves generated using ‘survfit’ in ‘ggsurvplot’.
Statistics and reproducibility
No statistical methods were used to pre-determine sample sizes, but sample sizes are similar to those reported in previous publications. Data distribution was assumed to be normal, but this was not formally tested. Mice with insufficient viable cell yield were excluded from analysis by flow cytometry. Where possible, experimental groups were randomized before initiation of experiments. Investigators were not blinded to allocation and experimental outcome except where otherwise indicated.
Reporting summary
Further information on research design is available in the Nature Portfolio Reporting Summary linked to this article.
Extended Data
Extended Data Fig. 1 |. Analysis of TAMs and astrocytes in BCBM.

a Whole mount brightfield and fluorescent microscopy images of metastatic brains (Met1-3) used to generate the scRNA-seq dataset described in Fig. 1d. Metastatic lesions are GFP+ (green). Results are representative of a single experiment. Scale bar = 50 mm. b IF staining shows IBA1+ cells (red) in normal human brain and three resected patient BCBM tumors. Insets show cell morphology, exhibiting evenly spaced, ramified microglia in normal human brain contrasting heavily infiltrated ameboid microglia in BCBM patients. Results are representative of a single experiment. Scale bar = 50 μm. c Representative FACS plots show gating for single, live (Sytox negative) myeloid cells (CD45+CD11b+), astrocytes (CD45−ASCA2+) and 231BR cells (CD45− GFP+) isolated for scRNA-seq. d Identification of mouse and human cells by the frequency of reads that align to the mm10 mouse genome. Cutoffs used to identify mouse cells (>0.875 aligned, n = 51,418 cells), human cells (<0.05 aligned, n = 7336 cells) and doublets (0.05–0.875 aligned, n = 913 cells) are shown. e Violin plots show cell distributions for key quality control metrics pre- and post-filtering and removal of poor quality cells. Cells were removed that displayed <500 or >2000 genes (nFeature_RNA), or >10% of genes mapped to the mitochondrial genome (percent mito genes). f Bar chart shows the frequency of cells contributed by each mouse that localize to each cell type in Fig. 1f. g tSNE plot shows astrocytes colored by control or metastatic condition. h Volcano plot shows genes differentially expressed (n = 6,542) between astrocytes from control and metastatic brains determined by Wilcoxon rank sum test, (p < 0.01). See Supplementary Table 2 for full list. Select genes with an absolute value average natural logFC >0.35 are colored and labeled. The y-axis represents the –log10 of Bonferroni corrected Pvalues, and the x-axis represents average natural logFC between conditions.
Extended Data Fig. 2 |. Identification of myeloid cell types and subclustering analysis of proinflammatory microglia.

a tSNE plot shows myeloid cells (n = 15,288) colored and labeled by cell type. mDC = mature dendritic cell. Mono.Macro = monocytes and macrophages. b Dot plot shows top marker genes for each cell type ranked by average natural logFC. Dot size represents the percentage of cells that express the gene, and dot greyscale represents the average expression level. See Supplementary Table 4. c Bar chart shows the frequency of cells contributed by each mouse that localize to each cell type in b. d Feature plots show myeloid cells colored by canonical cell type marker genes or features. Stressed cells were identified by increased expression of mitochondrial genome (percent.mito) genes, and decreased number of genes detected (nFeature_RNA). e Bayesian information criterion (BIC) for microglia topic models from Fig. 2d with the listed number of topics (K), each fit to an error tol = 10. f Bar plot shows the relative enrichment of each topic in control and metastatic animals from Fig. 2d. The relative enrichment was determined by subtracting the average topic assignment for the control mice from the average topic assignment across all cells in each mouse. Highlighted topics show four core topics where all three metastatic mice have a higher relative enrichment than all three control mice (that is min(Metastatic) > max(Control)).
Extended Data Fig. 3 |. Pro-inflammatory marker expression in microglia from BCBM models.

a Gating strategy for identification of microglia. Dot plots (top) show gating for single, live (zombie negative) CD45loCD11b+Ly6C− microglia. Histogram plots (bottom) show subsequent gating for CD74, BST2, and MHC-II in microglia. b Flow cytometry analysis of CD74, BST2 and MHC-II in microglia harvested 14 days post intracardiac injection of 4T1-GFP (100,000) cells into BALB/c animals. Bar graph shows the percent of microglia that express each marker in control (n = 7) and metastatic (n = 7) brains. Pvalues were generated by an unpaired two-sided student’s t-test, and error bars indicate mean +/− standard deviation. c Quantification of microglia in tumor and distal regions of mice bearing EO771-GFP tumors. Representative images (left panels) show microglia localization relative to other cell types using a machine learning classifier (see Methods). Pie graphs (right panels) show the proportion of microglia and other cell types in each region. Frequencies are as follows: other non-microglia cells (TMEM119−CD74−MHC-II−ISG15−), distal = 0.94, tumor = 0.22; microglia (TMEM119+), distal = 0.05, tumor = 0.22; tumor cells (ISG15+TMEM119−), distal < 0.01 tumor = 0.14; other immune cells (TMEM119−CD74+MHC-II+), distal < 0.01, tumor =0.41. Scale bar = 100um.
Extended Data Fig. 4 |. Quantification of tumor size in FIRE-WT and FIRE-KO animals.

a IVIS images show EO771 luciferase luminescence signal change over time in FIRE-WT and FIRE-KO animals. Representative animals that displayed continuous signal increase (tumor growth, solid line) vs. signal decrease (tumor rejection, dashed line) are shown. Pseudocoloring of luminescence shows quantification of radiance (p/sec/cm2/sr). b Line graphs show quantification of luminescence signal change over time in all FIRE-WT and FIRE-KO animals. Solid lines indicate animals that demonstrated tumor growth and dashed lines indicate those that showed tumor rejection. Growth was defined by signal increase over time, and rejection was defined as either baseline signal (<106) or >5-fold decrease in signal relative to maximum. c Serial dilution analysis of EO771 cell engraftment in FIRE-WT and FIRE-KO animals. 10–200 × 104 EO771 cells were transplanted intracranially into each mouse strain. Ex vivo whole brain luminescence images show signal from tumor cells in each tissue at day 14. Fractions denote the number of grafts that produced macroscopic tumors in each condition. d Dot plots quantify luminescent signal (total flux) from each tissue shown in Extended Data Fig. 4c at day 14. Pvalues were generated by an unpaired two-sided student’s t-test.
Extended Data Fig. 5 |. Analysis of NK, T, and monocyte responses to BCBM in FIRE-WT and FIRE-KO animals.

a Quantification of tumor burden in FIRE-WT and FIRE-KO animals (n = 8/group). Mice were injected with EO771 GFP-Luc cells as described in Fig. 5a and tumors were harvested and analyzed by IVIS on day 7. Images (left panels) show pseudocoloring of radiance (p/sec/cm2/sr), and bar graph shows quantification of total flux (p/s). Pvalue shown is the result of a student’s unpaired two sided t-test. Error bars represent mean +/− standard deviation. b Box plots show frequency of T cell subsets from Fig. 5c (n = 7 FIRE-WT, n = 8 FIRE-KO). Frequencies shown are out of all T cells. Bounds of box and whiskers are indicative of the first through fourth interquartile range. Pvalue shown is the result of a student’s un-paired two sided t-test. c Analysis of T cell activation in tumor bearing FIRE-WT and FIRE-KO brain tissues by flow cytometry. CD44 and CD62L expressions were measured in CD4 and CD8 T cells to delineate T effector (Teff), T central memory (TCM) and naive T cell subsets. Representative FACS plots (top panels) show gating for each subset after gating for single, live (Sytox negative) cells. Bar graphs (bottom panels) show quantification of T cell counts for each group. Error bars represent mean +/− standard deviation. Pairwise comparisons of counts between groups were not significant. d Quantification of monocytes in tumor bearing FIRE-WT and FIRE-KO brain tissues by flow cytometry. CD11b+Ly6C+ monocytes were identified following gating for CD3−NK1.1−, single, live (Sytox negative) cells. Top panels show representative FACS plots, and bottom panels show quantification of cell counts. Error bars represent mean +/− standard deviation. Pairwise comparisons of counts between groups were not significant. e Linear regression model of CD8+ T cell and Treg quantification from Extended Data Fig. 5b. R-squared and Pvalues determined by simple linear regression function.
Extended Data Fig. 6 |. Analysis of tumor burden and the immune response in T cell deficient mice.

a Gating scheme for analysis of T cells in brain tissue harvested from vehicle treated, FTY720 treated and RAG1-K0 mice. FACS plots show gating of TCRb+ T cells from single, live (sytox negative) CD45hiCD11b− cells from Extended Data Fig. 6b. b Gating scheme for analysis of microglia and monocytes in brain tissue from vehicle, FTY720 and RAG1-K0 animals. FACS plots (top panels) show gating for CD45hi-int and CD11b+cell populations, followed by gating for CD45hiLy6C+ monocytes and CD45intLy6C− microglia (bottom panels). c Bar graphs show the percentage of microglia and monocytes out of total live, single cells in brains harvested from vehicle (veh, n = 6), FTY720 (FTY, n = 6) and RAG1-KO (RAG1, n=4) animals. Pairwise comparisons of percentages between groups were not significant. Error bars represent standard deviation. d Quantification of E0771 tumor burden at endpoint on day 12 by IVIS. Pseudocolor shows radiance (p/sec/cm2/sr) in each whole brain.
Extended Data Fig. 7 |. Analysis of BCBM immune repertoire in T cell deficient and replete mice.

a Dot plot shows top marker genes for each cell type in total CD45hi-int sorted cells, ranked by the average log2 fold-change and determined by the Wilcoxon rank sum test. Dot size represents the percentage of cells that express each gene, and dot greyscale represents the average expression level. Macro.DCs = macrophages and dendritic cells, mDCs = mature dendritic cells, pvMacro = perivascular macrophages. Bar graphs illustrate relative contribution of each cluster to total leukocytes, separated by mouse strain and timepoint. b UMAPs show T cells (n = 1949 cells) from C57BL/6 mice at day 4 and 10, colored by cluster (left) and timepoint (right). c Bar graph illustrates the distribution of T cell clusters in each animal (n = 6) separated by timepoint. d Dot plot shows expression of top marker genes for each T cell cluster from Extended Data Fig. 7b. CD4.eff = CD4+ effector T cell, CD8.eff = CD8+ effector T cell, Lt.stg.eff = late stage effector T cell, γδ = gamma delta T cell. e Dot plot shows expression of top marker genes for each microglia cell cluster from Fig. 7b.
Extended Data Fig. 8 |. Analysis of humanized mouse model of BCBM and patient BCBM data.

a Whole mount brightfield and fluorescence microscopy images show brains from MITRG mice transplanted with GFP-labeled iHPSC cells and mCherry-labeled 231BR cells from Fig. 8a. b Identification of mouse and human cells by the frequency of reads that align to the mm10 mouse genome. Cutoffs used to identify mouse cells (>0.95 aligned, n = 641 cells), human cells (<0.1 aligned, n=25,287 cells) and doublets (0.1–0.95 aligned, n = 387 cells) are shown. c Violin plots show cell distributions for key quality control metrics pre- and post-filtering and removal of poor quality cells. Cells were removed that displayed >20% of genes mapped to the mitochondrial genome (percent mito genes). d tSNE plot shows human cells, colored by cluster and labeled by cell type. pvMacro = perivascular macrophages. Cycling = cycling myeloid cells. See Supplementary Table 6 for full gene list. e Dot plot shows top marker genes for each cell type determined by the Wilcoxon rank sum test and ranked by average natural logFC. Dot size represents the percentage of cells that express the gene, and dot greyscale represents the average expression level. See Supplementary Table 6 for full gene list. pvMacro = perivascular macrophages. f Bar chart shows the frequency of cells contributed by each mouse to the cell types shown in e. g tSNE plots colored to show the expression of BST2, CD74 and CCL3. h tSNE plot shows the distribution in human microglia of the three core topics identified in mouse microglia in response to BCBM. Gene scores for each topic from Fig. 2e were generated using the AddModuleScore function in Seurat (See Methods). Each topic is indicated by color, where only cells with a topic score > 0.25 are colored. Contrast gray scale indicates topic weights. Scaling was performed by dividing all topic scores by the maximum topic score across the dataset. i Bar plot shows the relative enrichment of each topic score in human microglia. j Kaplan-Meier plots show overall survival probability stratified by MHC-II, CSF1, and BST2 expression in bulk RNA-seq data from human patient BCBM tumors (Varešlija et al.50).
Supplementary Material
Acknowledgements
Research reported in this publication was supported by the National Institute of Health/National Cancer Institute award number R01CA237376-01A1, to D.A.L., the American Cancer Society award number IRG-98-279-10 to D.A.L., the Center for Complex Biological Systems, University of California, Irvine NIH/NCI U54-CA-217378 to D.A.L. and M.B.-J., the NIH/NINDS award number R01NS120060 to S.A.V., the National Institutes of Health T32AI 0602573, the Stanley Behrens Fellows in Medicine award and the UCI Graduate Dean’s Dissertation Fellowship to K.T.E., the National Institute of Health award number NIHT32EB009418 and the UCI Public Impact Fellowship to K.B., the National Institutes of Health award T32NS121727-01 to A.L., the National Institute of Neurological Disorders, Stroke/National Institutes of Health under award number T32NS082174 to M.A.C., the Feodor-Lynen fellowship from the Alexander-von-Humboldt Stiftung to J.I.-R., the National Institutes of Health award T32GM008620 to T.P.M., the Canadian Institutes of Health Research Postdoctoral Fellowship and the NIH/NCI K99/R00 Transition to Independence Award (1K99CA267160-01) to D.M., and the National Institutes of Health T32GM136624 and F31CA281331 to T.L. The authors wish to acknowledge the support of the Chao Family Comprehensive Cancer Center Experimental Tissue Shared Resource, supported by the National Cancer Institute of the National Institutes of Health under award number P30CA062203. The funders had no role in study design, data collection and analysis, decision to publish or preparation of the manuscript. Experiments using the GFP-expressing iPSC line AICS-0036 were made possible through the Allen Cell Collection, available from Coriell Institute for Medical Research. The authors also sincerely thank O. Shivashankar for sharing their advice and expertise, M. Pein for reviewing the manuscript and for her generation of GFP- and luciferase-labelled EO771 cells, D. Tifrea for obtaining human specimens, J. Atwood for assistance and training in flow cytometry and cell sorting, I. Smith for his generous gift of MDA-231-BR2 cells, and I. Chang and the UCI Research Cyberinfrastructure Center for maintenance and development of computational resources. This research is solely the responsibility of the authors and does not necessarily represent the official views of the National Institutes of Health.
Footnotes
Additional information
Extended data is available for this paper at https://doi.org/10.1038/s41556-023-01273-y.
Supplementary information The online version contains supplementary material available at https://doi.org/10.1038/s41556-023-01273-y.
Competing interests
The authors declare no competing interests.
Data availability
RNA-seq data that support the findings of this study have been deposited in the Gene Expression Omnibus (GEO) under accession codes GSE147949 and GSE237386. Reference genome GRCh38/mm10 are available from Ensembl. MULTI-seq reads were processed according to the MULTI-seq protocol64 and available on GitHub (https://github.com/chris-mcginnis-ucsf/MULTIseq. Qptiff images were segmented in QuPath using StarDist and is available on GitHub (https://github.com/stardist/stardist). All other data are available from the corresponding author on reasonable request. Source data are provided with this paper.
References
- 1.Witzel I, Oliveira-Ferrer L, Pantel K, Müller V. & Wikman H. Breast cancer brain metastases: biology and new clinical perspectives. Breast Cancer Res. 18, 1–9 (2016). [DOI] [PMC free article] [PubMed] [Google Scholar]
- 2.Ostrom QT, Wright CH & Barnholtz-Sloan JS Brain Metastases: Epidemiology. Handbook of Clinical Neurology vol. 149 (Elsevier, 2018). [DOI] [PubMed] [Google Scholar]
- 3.Niikura N. et al. Treatment outcomes and prognostic factors for patients with brain metastases from breast cancer of each subtype: a multicenter retrospective analysis. Breast Cancer Res. Treat 147, 103–112 (2014). [DOI] [PubMed] [Google Scholar]
- 4.Brufsky AM et al. Central nervous system metastases in patients with HER2-positive metastatic breast cancer: incidence, treatment, and survival in patients from registHER. Clin. Cancer Res 17, 4834–4843 (2011). [DOI] [PubMed] [Google Scholar]
- 5.Rostami R, Mittal S, Rostami P, Tavassoli F. & Jabbari B. Brain metastasis in breast cancer: a comprehensive literature review. J. Neuro-Oncol 10.1007/s11060-016-2075-3 (2016). [DOI] [PubMed] [Google Scholar]
- 6.Martin AM et al. Immunotherapy and symptomatic radiation necrosis in patients with brain metastases treated with stereotactic radiation. JAMA Oncol. 4, 1123–1124 (2018). [DOI] [PMC free article] [PubMed] [Google Scholar]
- 7.Deeken JF & Löscher W. The blood-brain barrier and cancer: transporters, treatment, and Trojan horses. Clin. Cancer Res 13, 1663–1674 (2007). [DOI] [PubMed] [Google Scholar]
- 8.Tosoni A, Ermani M. & Brandes AA The pathogenesis and treatment of brain metastases: a comprehensive review. Crit. Rev. Oncol. Hematol 52, 199–215 (2004). [DOI] [PubMed] [Google Scholar]
- 9.Hanisch UK & Kettenmann H. Microglia: active sensor and versatile effector cells in the normal and pathologic brain. Nat. Neurosci 10.1038/nn1997 (2007). [DOI] [PubMed] [Google Scholar]
- 10.Wolf SA, Boddeke HWGM & Kettenmann H. Microglia in physiology and disease. Annu. Rev. Physiol 79, 619–643 (2017). [DOI] [PubMed] [Google Scholar]
- 11.Hammond TR, Robinton D. & Stevens B. Microglia and the brain: complementary partners in development and disease. Annu. Rev. Cell Dev. Biol 34, 523–544 (2018). [DOI] [PubMed] [Google Scholar]
- 12.Quail DF & Joyce JA The microenvironmental landscape of brain tumors. Cancer Cell 31, 326–341 (2017). [DOI] [PMC free article] [PubMed] [Google Scholar]
- 13.Goldmann T. et al. Origin, fate and dynamics of macrophages at central nervous system interfaces. Nat. Immunol 10.1038/ni.3423 (2016). [DOI] [PMC free article] [PubMed] [Google Scholar]
- 14.Mrdjen D. et al. High-dimensional single-cell mapping of central nervous system immune cells reveals distinct myeloid subsets in health. Aging, and disease. Immunity 48,380–395.e6 (2018). [DOI] [PubMed] [Google Scholar]
- 15.Jordão MJC et al. Single-cell profiling identifies myeloid cell subsets with distinct fates during neuroinflammation. Science 10.1126/science.aat7554 (2019). [DOI] [PubMed] [Google Scholar]
- 16.Duchnowska R. et al. Immune response in breast cancer brain metastases and their microenvironment: the role of the PD-1/PD-L axis. Breast Cancer Res. 18, 43 (2016). [DOI] [PMC free article] [PubMed] [Google Scholar]
- 17.Coniglio SJ et al. Microglial stimulation of glioblastoma invasion involves epidermal growth factor receptor (EGFR) and colony stimulating factor 1 receptor (CSF-1R) signaling. Mol. Med 10.2119/molmed.2011.00217 (2012). [DOI] [PMC free article] [PubMed] [Google Scholar]
- 18.Pyonteck SM et al. CSF-1R inhibition alters macrophage polarization and blocks glioma progression. Nat. Med 19, 1264–1272 (2013). [DOI] [PMC free article] [PubMed] [Google Scholar]
- 19.Quail DF et al. The tumor microenvironment underlies acquired resistance to CSF-1R inhibition in gliomas. Science 10.1126/science.aad3018 (2016). [DOI] [PMC free article] [PubMed] [Google Scholar]
- 20.Yan D. et al. Inhibition of colony stimulating factor-1 receptor abrogates microenvironment-mediated therapeutic resistance in gliomas. Oncogene 10.1038/onc.2017.261 (2017). [DOI] [PMC free article] [PubMed] [Google Scholar]
- 21.Qiao S, Qian Y, Xu G, Luo Q. & Zhang Z. Long-term characterization of activated microglia/macrophages facilitating the development of experimental brain metastasis through intravital microscopic imaging. J. Neuroinflammation 10.1186/s12974-018-1389-9 (2019). [DOI] [PMC free article] [PubMed] [Google Scholar]
- 22.Guldner IH et al. CNS-native myeloid cells drive immune suppression in the brain metastatic niche through Cxcl10. Cell 10.1016/j.cell.2020.09.064 (2020). [DOI] [PMC free article] [PubMed] [Google Scholar]
- 23.Prinz M. & Priller J. Tickets to the brain: role of CCR2 and CX3CR1 in myeloid cell entry in the CNS. J. Neuroimmunol 224, 80–84 (2010). [DOI] [PubMed] [Google Scholar]
- 24.Rojo R. et al. Deletion of a Csflr enhancer selectively impacts CSF1R expression and development of tissue macrophage populations. Nat Commun. 10, 3215 (2019). [DOI] [PMC free article] [PubMed] [Google Scholar]
- 25.Bos PD et al. Genes that mediate breast cancer metastasis to the brain. Nature 10.1038/nature08021 (2009). [DOI] [PMC free article] [PubMed] [Google Scholar]
- 26.Lorger M. & Felding-Habermann B. Capturing changes in the brain microenvironment during initial steps of breast cancer brain metastasis. Am. J. Pathol 176, 2958–2971 (2010). [DOI] [PMC free article] [PubMed] [Google Scholar]
- 27.Kienast Y. et al. Real-time imaging reveals the single steps of brain metastasis formation. Nat. Med 16, 116–122 (2010). [DOI] [PubMed] [Google Scholar]
- 28.Valiente M. et al. Serpins promote cancer cell survival and vascular co-option in brain metastasis. Cell 10.1016/j.cell.2014.01.040 (2014). [DOI] [PMC free article] [PubMed] [Google Scholar]
- 29.Kettenmann H, Hanisch U-K, Noda M. & Verkhratsky A. Physiology of microglia. Physiol. Rev 10.1152/physrev.00011.2010 (2011). [DOI] [PubMed] [Google Scholar]
- 30.Bowman RL et al. Macrophage ontogeny underlies differences in tumor-specific education in brain malignancies. Cell Rep. 17, 2445–2459 (2016). [DOI] [PMC free article] [PubMed] [Google Scholar]
- 31.O’Flanagan CH et al. Dissociation of solid tumor tissues with cold active protease for single-cell RNA-seq minimizes conserved collagenase-associated stress responses. Genome Biol. 20, 1–13 (2019). [DOI] [PMC free article] [PubMed] [Google Scholar]
- 32.Motenko H, Neuhauser SB, O’Keefe M. & Richardson JE MouseMine: a new data warehouse for MGI. Mamm. Genome 26, 325–330 (2015). [DOI] [PMC free article] [PubMed] [Google Scholar]
- 33.Dey KK, Hsiao CJ & Stephens M. Visualizing the structure of RNA-seq expression data using grade of membership models. PLoS Genet. 13, 1–23 (2017). [DOI] [PMC free article] [PubMed] [Google Scholar]
- 34.Mathys H. et al. Temporal tracking of microglia activation in neurodegeneration at. single-cell resolution. Cell Rep. 21, 366–380 (2017). [DOI] [PMC free article] [PubMed] [Google Scholar]
- 35.Hammond TR et al. Single-cell RNA sequencing of microglia throughout the mouse lifespan and in the injured brain reveals complex cell-state changes. Immunity 50, 253–271.e6 (2019). [DOI] [PMC free article] [PubMed] [Google Scholar]
- 36.Ochocka N. et al. Single-cell RNA sequencing reveals functional heterogeneity of glioma-associated brain macrophages. Nat. Commun 12, 1–14 (2021). [DOI] [PMC free article] [PubMed] [Google Scholar]
- 37.Ivashkiv LB & Donlin LT Regulation of type I interferon responses. Nat. Rev. Immunol 14, 36–49 (2014). [DOI] [PMC free article] [PubMed] [Google Scholar]
- 38.Keren-Shaul H. et al. A unique microglia type associated with restricting development of Alzheimer’s disease. Cell 169, 1276–1290.e17 (2017). [DOI] [PubMed] [Google Scholar]
- 39.Blasius AL et al. Bone marrow stromal cell antigen 2 is a specific marker of type I IFN-producing cells in the naive mouse, but a promiscuous cell surface antigen following IFN stimulation. J. Immunol 10.4049/jimmunol.177.5.3260 (2006). [DOI] [PubMed] [Google Scholar]
- 40.Neil SJD, Zang T. & Bieniasz PD Tetherin inhibits retrovirus release and is antagonized by HIV-1 Vpu. Nature 10.1038/nature06553 (2008). [DOI] [PubMed] [Google Scholar]
- 41.Ting JPY & Trowsdale J. Genetic control of MHC class II expression. Cell 10.1016/s0092-8674(02)00696-7 (2002). [DOI] [PubMed] [Google Scholar]
- 42.Schröder B. The multifaceted roles of the invariant chain CD74—more than just a chaperone. Biochim. Biophys. Acta 1863, 1269–1281 (2016). [DOI] [PubMed] [Google Scholar]
- 43.Stanley ER et al. Biology and action of colony-stimulating factor-1. Mol. Reprod. Dev 46,4–10 (1997). [DOI] [PubMed] [Google Scholar]
- 44.Tokunaga R. et al. CXCL9, CXCL10, CXCL11/CXCR3 axis for immune activation—a target for novel cancer therapy. Cancer Treat. Rev 63,40–47 (2018). [DOI] [PMC free article] [PubMed] [Google Scholar]
- 45.Spangenberg E. et al. Sustained microglial depletion with CSF1R inhibitor impairs parenchymal plaque development in an Alzheimer’s disease model. Nat. Commun 10.1038/s41467-019-11674-z (2019). [DOI] [PMC free article] [PubMed] [Google Scholar]
- 46.Munro DAD et al. CNS macrophages differentially rely on an intronic Csf1r enhancer for their development. Development 147, dev194449 (2020). [DOI] [PMC free article] [PubMed] [Google Scholar]
- 47.McQuade A. et al. Development and validation of a simplified method to generate human microglia from pluripotent stem cells. Mol. Neurodegener 10.1186/s13024-018-0297-x (2018). [DOI] [PMC free article] [PubMed] [Google Scholar]
- 48.Hasselmann J. et al. Development of a chimeric model to study and manipulate human microglia in vivo. Neuron 10.1016/j.neuron.2019.07.002 (2019). [DOI] [PMC free article] [PubMed] [Google Scholar]
- 49.Rongvaux A. et al. Development and function of human innate immune cells in a humanized mouse model. Nat. Biotechnol 10.1038/nbt.2858 (2014). [DOI] [PMC free article] [PubMed] [Google Scholar]
- 50.Varešlija D. et al. Transcriptome characterization of matched primary breast and brain metastatic tumors to detect novel actionable targets. J. Natl Cancer Inst 111, 388–398 (2019). [DOI] [PMC free article] [PubMed] [Google Scholar]
- 51.Marsh SE et al. Dissection of artifactual and confounding glial signatures by single-cell sequencing of mouse and human brain. Nat. Neurosci 25, 306–316 (2022). [DOI] [PMC free article] [PubMed] [Google Scholar]
- 52.Ocañas SR et al. Minimizing the ex vivo confounds of cell-isolation techniques on transcriptomic and translatomic profiles of purified microglia. eNeuro 9, ENEUR0.0348- (2022). [DOI] [PMC free article] [PubMed] [Google Scholar]
- 53.Klemm F. et al. Compensatory CSF2-driven macrophage activation promotes adaptive resistance to CSF1R inhibition in breast-to-brain metastasis. Nat. Cancer 10.1038/s43018-021-00254-0 (2021). [DOI] [PubMed] [Google Scholar]
- 54.Huang Y. et al. Repopulated microglia are solely derived from the proliferation of residual microglia after acute depletion. Nat. Neurosci 21, 530–540 (2018). [DOI] [PubMed] [Google Scholar]
- 55.Lund H. et al. Competitive repopulation of an empty microglial niche yields functionally distinct subsets of microglia-like cells. Nat. Commun 9, 4845 (2018). [DOI] [PMC free article] [PubMed] [Google Scholar]
- 56.Bruttger J. et al. Genetic cell ablation reveals clusters of local self-renewing microglia in the mammalian central nervous system. Immunity 43, 92–106 (2015). [DOI] [PubMed] [Google Scholar]
- 57.Han J, Harris RA & Zhang XM An updated assessment of microglia depletion: current concepts and future directions. Mol. Brain 10, 1–8 (2017). [DOI] [PMC free article] [PubMed] [Google Scholar]
- 58.Butovsky O. et al. Identification of a unique TGF-β-dependent molecular and functional signature in microglia. Nat. Neurosci 10.1038/nn.3599 (2014). [DOI] [PMC free article] [PubMed] [Google Scholar]
- 59.Gosselin D. et al. An environment-dependent transcriptional network specifies human microglia identity. Science 10.1126/science.aal3222 (2017). [DOI] [PMC free article] [PubMed] [Google Scholar]
- 60.Campbell JP, Merkel AR, Masood-Campbell SK, Elefteriou F & Sterling JA Models of bone metastasis.. J. Vis. Exp 10.3791/4260 (2012). [DOI] [PMC free article] [PubMed] [Google Scholar]
- 61.Graphpad Prism, https://www.graphpad.com (2023).
- 62.stardist. GitHub https://github.com/stardist/stardist (2018).
- 63.McGinnis CS et al. MULTI-seq: sample multiplexing for single-cell RNA sequencing using lipid-tagged indices. Nat. Methods 10.1038/s41592-019-0433-8 (2019). [DOI] [PMC free article] [PubMed] [Google Scholar]
- 64.MULTI-seq. GitHub. https://github.com/chris-mcginnis-ucsf/MULTIseq (2021).
- 65.Living Image, https://www.perkinelmer.com/category/in-vivo-imaging-software (2017).
- 66.Chen EY et al. Enrichr: interactive and collaborative HTML5 gene list enrichment analysis tool. BMC Bioinf. 14,128 (2013). [DOI] [PMC free article] [PubMed] [Google Scholar]
- 67.Kuleshov MV et al. Enrichr- a comprehensive gene set enrichment analysis web server 2016 update. Nucleic Adds Res. 44, W90–W97 (2016). [DOI] [PMC free article] [PubMed] [Google Scholar]
- 68.Cao J. et al. The single-cell transcriptional landscape of mammalian organogenesis. Nature 566,496–502 (2019). [DOI] [PMC free article] [PubMed] [Google Scholar]
- 69.jnc_2018. GitHub https://github.com/npriedig/jnci_2018/blob/master/brainMetPairs.salmon.cts.txt (2018).
Associated Data
This section collects any data citations, data availability statements, or supplementary materials included in this article.
Supplementary Materials
Data Availability Statement
RNA-seq data that support the findings of this study have been deposited in the Gene Expression Omnibus (GEO) under accession codes GSE147949 and GSE237386. Reference genome GRCh38/mm10 are available from Ensembl. MULTI-seq reads were processed according to the MULTI-seq protocol64 and available on GitHub (https://github.com/chris-mcginnis-ucsf/MULTIseq. Qptiff images were segmented in QuPath using StarDist and is available on GitHub (https://github.com/stardist/stardist). All other data are available from the corresponding author on reasonable request. Source data are provided with this paper.